Abstract
A thorough understanding of how polarized near-IR light propagates through sound and carious dental hard tissues is important for the development of dental optical imaging systems. New optical imaging tools for the detection and assessment of dental caries (dental decay) such as near-IR imaging and optical coherence tomography can exploit the enhanced contrast provided by polarization sensitivity. In this investigation, an automated system was developed to collect images for the full 16-element Mueller Matrix. The polarized light was controlled by linear polarizers and liquid crystal retarders and the 36 images were acquired as the polarized near-IR light propagates through the enamel of extracted human thin tooth sections. In previous work, we reported that polarized light is rapidly depolarized by demineralized enamel, and sound and demineralized dentin.1 The rapid depolarization of polarized light by dental caries in the near-IR provides high contrast for caries imaging and detection. In this initial study, major differences in the Mueller matrix elements were observed in both sound and demineralized enamel which supports this approach and warrants further investigation.
Keywords: Mueller-Matrix, polarization, Imaging, Near-IR, dental hard tissue
1. INTRODUCTION
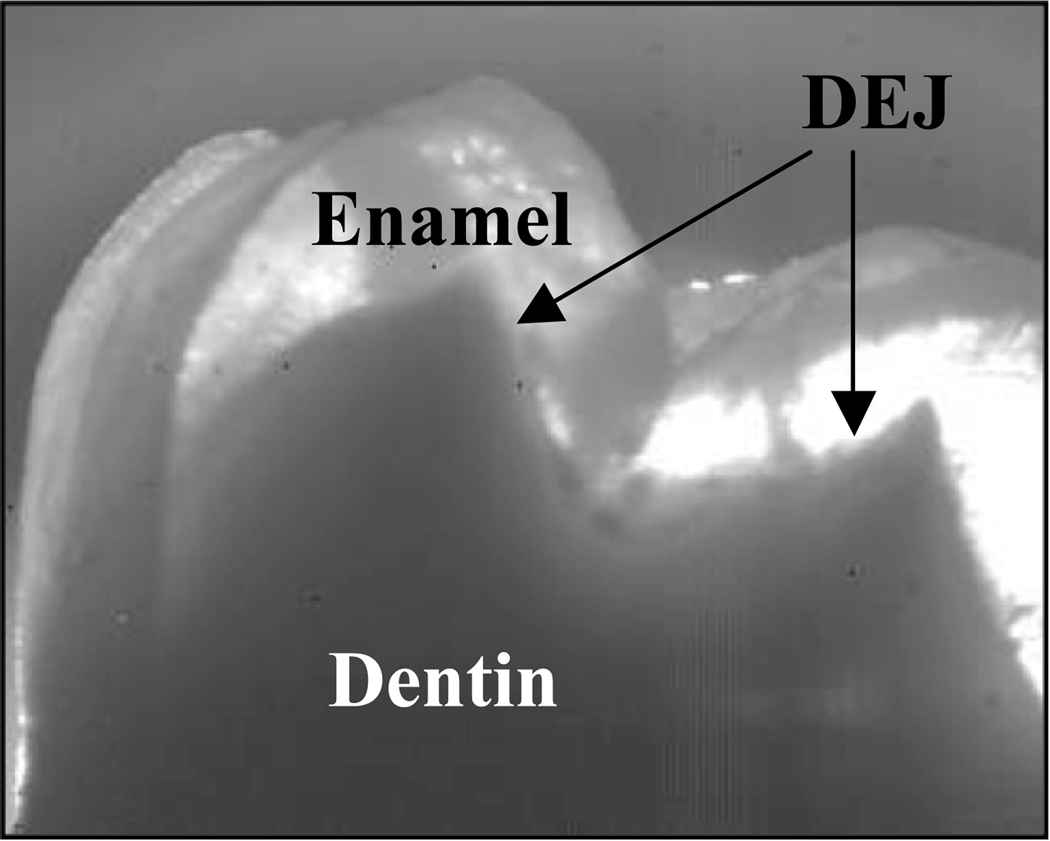
A thorough understanding of how polarized near-IR light propagates through sound and carious dental hard tissues is important for the development of dental optical imaging systems. New optical imaging tools for the detection and assessment of dental caries (dental decay) such as near-IR imaging and optical coherence tomography can exploit the enhanced contrast provided by polarization sensitivity. Stokes polarimetry was used in the previous study to monitor the state of polarization of incident linearly and circularly polarized light as it propagates through extracted human thin tooth sections(1). These measurements on extracted whole teeth and thin tooth sections at 1310-nm suggest that the degree of polarization is maintained through sound tooth enamel and transparent dentin and that circularly polarized light is typically depolarized more rapidly than linearly light. Polarized light is rapidly depolarized by demineralized enamel and sound and demineralized dentin(1). The rapid depolarization of polarized light by dental caries in the near-IR provides high contrast for caries imaging and detection. Research with polarized scattered light deals with the entire scattering process in the context of Stokes vectors, Mueller matrices, angle of incidence, intensities, and degree of polarization. Polarized light can be completely described by six degenerate polarization states of light, four linear, and two circular used to construct the Mueller matrix-Stokes vector formalism(2–6). All the other polarization states are considered elliptical. There are many well-known examples of polarized and unpolarized light. The output light from a laser beam is typically highly polarized while familiar examples of unpolarized light would include a light bulb, or light from the sun. Unpolarized light is a random mixture of all possible polarization states. The ability of polarized light to aid imaging of skin pathology is extensive (7–9). Certain elements of the Mueller-matrix have been found to yield significantly higher contrast of known cancerous lesions due to significant changes in light scattering and tissue birefringence (10–14). Dental hard tissues are also highly birefringent and demineralization results in marked increases in light scattering and large changes in birefringence. Polarized light microscopy has been used extensively for more than a hundred years to study dental caries (15). Our previous studies have discovered that the highest transparency of dental hard tissues lies in the near-IR region near 1310-nm (16–20). Therefore we believe that the near-IR is best suited to provide high contrast imaging of dental caries. Figure 1 shows a 3 mm tooth section of enamel imaged under near-IR light at 1310-nm. Note the high transparency of the enamel. Polarization resolved imaging could remove most of the glare from the surface and enhance the contrast of the underlying tissue. In this investigation, we were able to show that there are differences between the diagonal and off-diagonal elements of the normalized Mueller-matrix.
Fig. 1.
Near-IR image of a 3 mm tooth section showing the high-transparency of dental enamel.
2. MATERIALS AND METHODS
2.1 Sample Preparation
Sound 3rd molars extracted from patients in the San Francisco Bay area were collected, cleaned and sterilized with gamma radiation. Whole teeth were inspected for lesions using near-IR transillumination. Sound and carious teeth were sectioned and one slice from each tooth was selected and the surface's polished with aluminum oxide down to a finish of 0.3 microns.
2.2 Imaging Setup
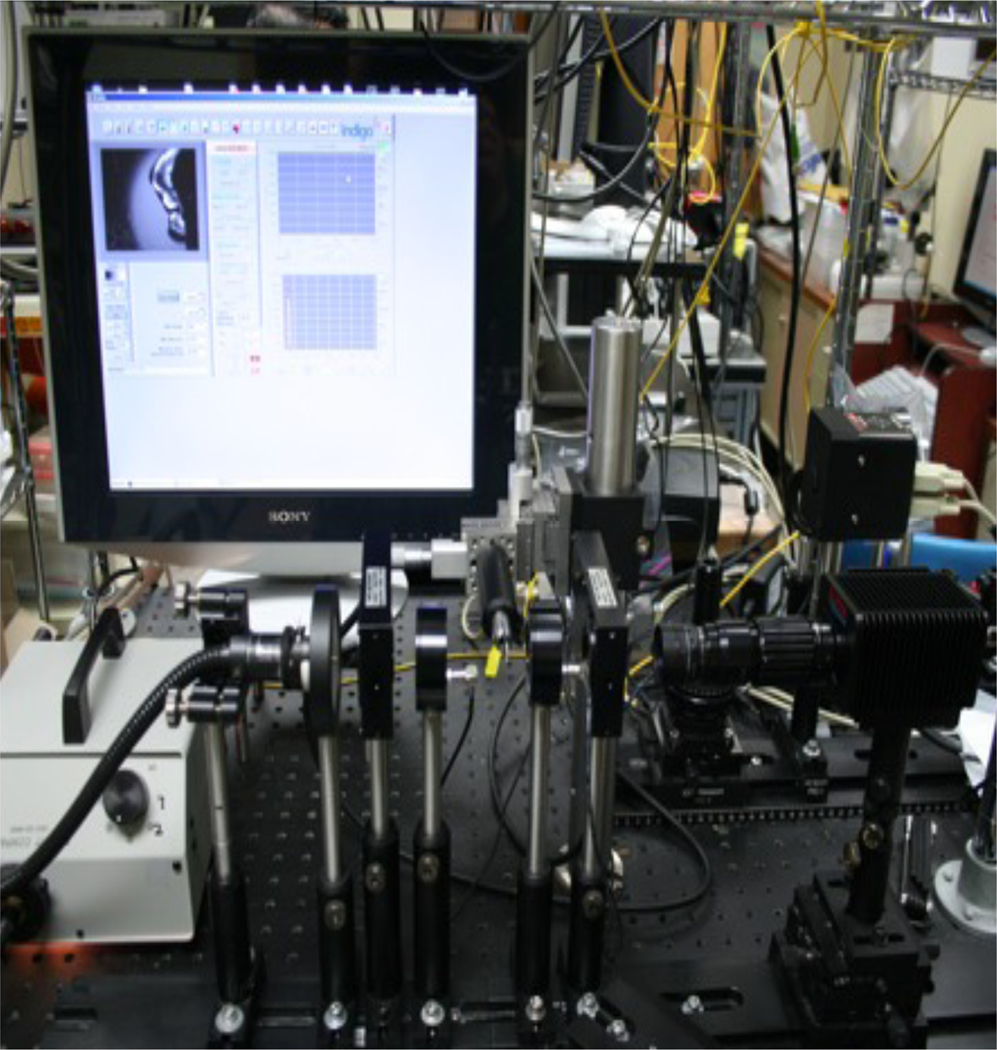
The experimental setup for measurement is transmission shown in Fig. 2. Unpolarized near-IR light from a tungsten-halogen 150-W fiber-optic illuminator, FOI-1 E Licht Company (Denver, CO) coupled to an adjustable aperture and a 90-nm bandpass filter centered at 1300-nm, Filter# BP-1300-090-B Spectrogon US Inc. (Parsippany, NJ) was used to illuminate the samples. The incidence polarization states were controlled electro-optically via a rotating linear polarizer and a liquid-crystal voltage-dependent variable retarders with attached compensator Meadowlark Optics (Frederick, CO) with the ability to alter the incident polarization state between H (linear horizontal), V (linear vertical), P (linear +45), M (linear −45), L (left circular) and R (right circular). After passing through the sample, the polarization states of the emerging light were analyzed by an additional electro-optic variable retarder, and a near-IR linear polarizer. The images were acquired by a InGaAs focal plane array (318×252 pixels) the Alpha NIR™ camera Indigo Systems, (Goleta, CA) with an Infinimite video lens Infinity (Boulder, CO) and the 12-bit images were analyzed using image analysis software. The polarization states were confirmed using a PA530 polarimeter, ThorLabs (Newton, NJ).
Fig. 2.
Mueller Matrix imaging setup consisting of tungsten light source, near-IR filter, optical density filter, linear polarizer, liquid crystal retarder, sample mount, liquid crystal retarder, linear polarizer, and InGas camera.
3. THEORY
Using the Mueller-Stokes method, the detected Stokes vector of an output beam of light after propagating through an input linear polarizer, two liquid crystal retarders and an analyzer polarizer can be determined. In equation 1, the Stokes vector S describes the near-IR light polarization as:
Equation 1. The Stokes vector S elements S0, S1, S2 and S3 are defined relative to the following intensity measurements: I is the total light intensity, Q is the intensity difference between horizontal and vertical linearly polarized light, U is the intensity difference between a linearly polarized +45 and a linearly polarized −45 light, and V is the intensity difference between left and right circular light. The Stokes vector formalism is written for H = (S0 S1 S2 S3) = (1100), V = (1-100), P = (1010), M = (10-10), R = (1001) and L = (100-1).
For Mueller-matrix imaging Sout = MsampleSIN, there are basically six polarization states of light, four linear (H, V, P, and M) and two circular (R and L), used to construct the Mueller-matrix. The sample Mueller matrix in equation 2 relates the Stokes vector SIN of the light impinging on a sample to the light leaving the sample Sout and is calculated by a combination of input and output polarization states. There are 36 equations with 36 unknowns and the Mueller matrix is over determined when all possible combinations of the six input and six output polarization states are used. The acquired images were imported into an image analysis program to generate each element of the matrix. The M11 term is sometimes refer to as the transmission element and the other fifteen elements of the Mueller-matrix are normalized to M11 after subtracting off the dark current.
Equation 2. Sixteen elements of the Mueller-matrix are: M11 = HH + HV + VH + VV, M21 = HH − HV + VH − VV, M31 = HP − HM + VP − VM, M41 = HR − HL + VR − VL, M12 = HH + HV − VH − VV, M22 = HH − HV −VH +VV, M32 = HP − HM − VP +VM, M42 = HR − HL –VR +VL, M13 = PH + PV − MH − MV, M23 = PH − PV − MH + MV, M33 = PP − PM − MP + MM, M43 = PR − PL − MR + ML, M14 = RH + RV − LH − LV, M24 = RH − RV − LH + LV, M34 = RP − RM −LP + LM, M44 = RR − RL − LR + LL. The notation is as follows: the first term represents the input polarization state while the second term represents the output polarization state.
4. RESULTS & DISCUSSION
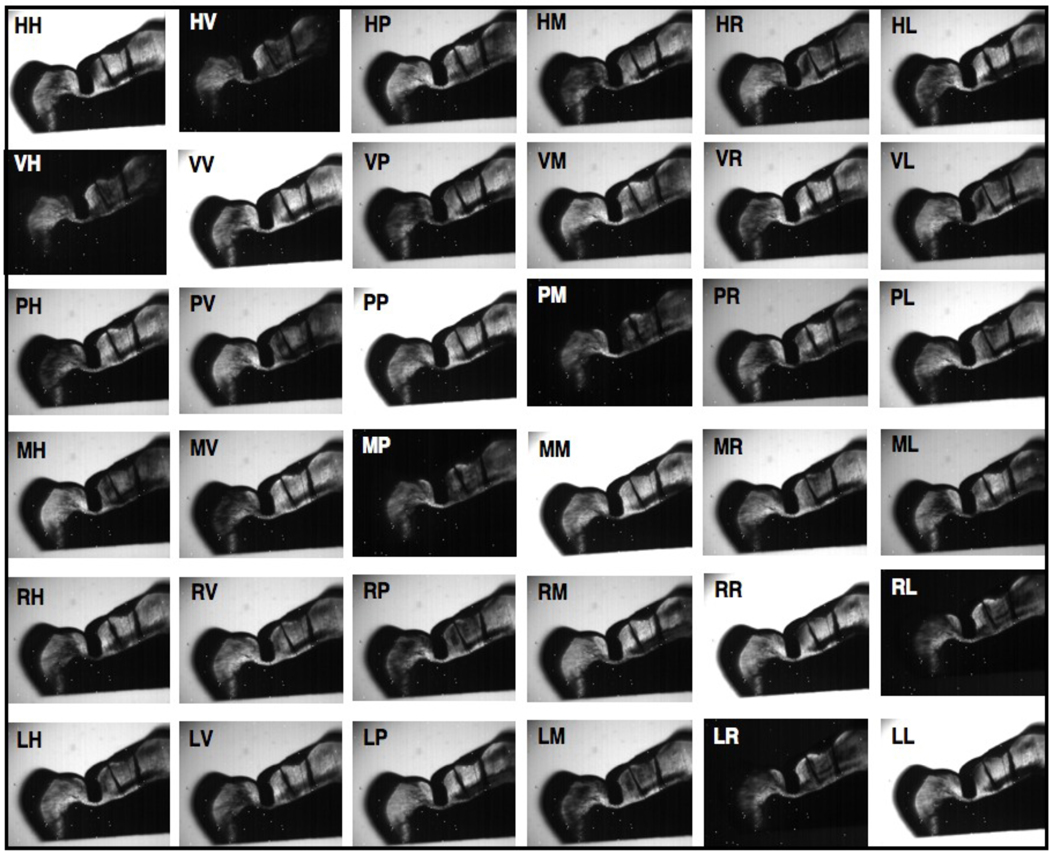
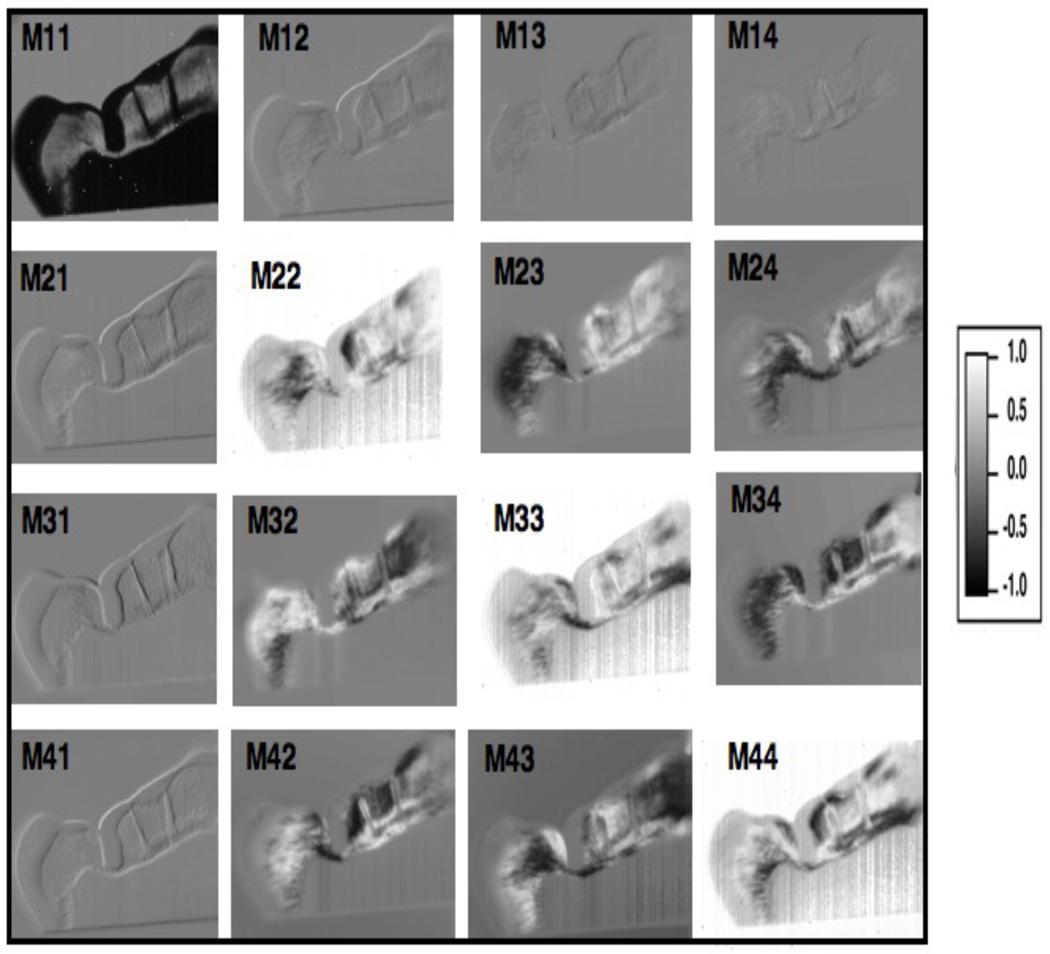
The initial aim of this investigation was to construct the sixteen elements of the Muller-matrix that will provide a complete description of the polarization properties of a tooth sample. Figure 3 shows a series of 36 unprocessed images taken with the setup of Fig. 2. In the upper left hand corner are two letters that designate the initial and final polarization states selected and analyzed. Each image shows the same 1 mm tooth slice in different polarization states. The enamel is still transparent in most of the images but varies in intensity from image to image because of the birefringence of the tissue. The dentin is very dark in the images because of the high scattering coefficient and it is very hard to discern any meaningful differences. The carious region is located in the pit of the fissure and almost extends down to the dentin and is very dark. The edge of the tooth is dark due to the tooth curvature. The two lines extending down from the edge of the tooth that are to the right of the carious region are cracks. From the 36 images in Fig. 3, the Mueller matrix elements of Fig. 4 can be constructed from equation 2 and normalized to the M11 element. The scale of the Mueller matrix elements ranges from -1 to 1 with 0 exhibiting no preferential polarization. The M11 image equals 1 when normalized and is not shown normalized in Fig. 4. In Fig. 4, the M12, M13, M14, M21, M31, M41 element are close to zero for the enamel, dentin, and caries regions. The diagonal elements M22, M33 M44 show the greatest contrast. The intensity in the dentin was too low for reliable analysis.
Fig. 3.
Unprocessed intensity images of 1 a tooth section (1 mm thick) used to construct the matrix elements of the Mueller Matrix. The notation is as follows: the first term represents the input polarization state while the second term represents the output polarization state for H, V, P, M, R and L.
Fig. 4.
Normalized elements Mij/M11 of the Mueller-matrix with M11 image shown without normalization.
It is clear from these initial images that there are major differences in the specific matrix elements for both sound and carious enamel. More extensive studies are planned involving both transmission and reflectance measurements. We anticipate that specific elements of the Mueller-matrix will yield the optimal contrast between sound and demineralized dental hard tissue.
ACKNOWLEDGMENTS
This work was supported By NIH/NIDCR Grant R01-DE14698 and the UCSF Academic Senate Committee on Research. The authors would also like to acknowledge the contributions of Kenneth H. Chan.
REFERENCES
- 1.Darling CL, Fried D. Polarized light propagation through sound and carious enamel at 1310-nm. Lasers in Dentistry XII. 2006;Vol. 6137:1–7. [Google Scholar]
- 2.Collett E. Polarized light : fundamentals and applications. Marcel Dekker: New York; 1993. [Google Scholar]
- 3.Collett E. Polarized light in fiber optics. PolaWave Group: Lincroft, N.J.; 2003. [Google Scholar]
- 4.Goldstein DH, Collett E. Polarized light. Marcel Dekker: New York; 2003. [Google Scholar]
- 5.Kliger DS, Lewis JW, Randall CE. Polarized light in optics and spectroscopy. Boston: Academic Press; 1990. [Google Scholar]
- 6.Shurcliff WA. Polarized Light: Production and Use. Cambridge: Harvard University Press; 1966. [Google Scholar]
- 7.Jacques SL, Ramella-Roman JC, Lee K. Imaging skin pathology with polarized light. J Biomed Opt. 2002;7(3):329–340. doi: 10.1117/1.1484498. [DOI] [PubMed] [Google Scholar]
- 8.Jacques SL, Roman JR, Lee K. Imaging superficial tissues with polarized light. Lasers Surg Med. 2000;26(2):119–129. doi: 10.1002/(sici)1096-9101(2000)26:2<119::aid-lsm3>3.0.co;2-y. [DOI] [PubMed] [Google Scholar]
- 9.de Boer JF, Milner TE, vanGemert MJC, Nelson JS. Two-dimensional birefringence imaging in biological tissue by polarization-sensitive optical coherence tomography. Optics Letters. 1997;22(12):934–936. doi: 10.1364/ol.22.000934. [DOI] [PubMed] [Google Scholar]
- 10.Baba JS, Chung JR, DeLaughter AH, Cameron BD, Cote GL. Development and calibration of an automated Mueller matrix polarization imaging system. J Biomed Opt. 2002;7(3):341–349. doi: 10.1117/1.1486248. [DOI] [PubMed] [Google Scholar]
- 11.Cameron BD, Li Y, Nezhuvingal A. Determination of optical scattering properties in turbid media using Mueller matrix imaging. J Biomed Opt. 2006;11(5):054031. doi: 10.1117/1.2363347. [DOI] [PubMed] [Google Scholar]
- 12.Cameron BD, Rakovi MJ, Mehrubeo Lu M, Kattawar GW, Rastegar S, Wang LV, Cote GL. Measurement and calculation of the two-dimensional backscattering Mueller matrix of a turbid medium: errata. Opt Lett. 1998;23(20):1630. doi: 10.1364/ol.23.001630. [DOI] [PubMed] [Google Scholar]
- 13.Cameron BD, Rakovic MJ, Mehrubeoglu M, Kattawar GW, Rastegar S, Wang LV, Cote GL. Measurement and calculation of the two-dimensional backscattering Mueller matrix of a turbid medium. Opt Lett. 1998;23(7):485–487. doi: 10.1364/ol.23.000485. [DOI] [PubMed] [Google Scholar]
- 14.Rakovi MJ, Kattawar GW, Mehru Beo Lu MB, Cameron BD, Wang LV, Rastegar S, Cote GL. Light backscattering polarization patterns from turbid media: theory and experiment. Appl Opt. 1999;38(15):3399–3408. doi: 10.1364/ao.38.003399. [DOI] [PubMed] [Google Scholar]
- 15.Schmidt WJ, Keil A. Polarizing Microscopy of Dental Tissues. NY: Pergamon Press; 1971. [Google Scholar]
- 16.Bühler CM, Ngaotheppitak P, Fried D. Imaging of occlusal dental caries (decay) with near-IR light at 1310-nm. Optics Express. 2005;13(2):573–582. doi: 10.1364/opex.13.000573. [DOI] [PubMed] [Google Scholar]
- 17.Darling CL, Fried D. Optical properties of natural caries lesions in dental enamel at 1310-nm. Lasers in Dentistry XI. 2005;Vol. 5687:34–41. [Google Scholar]
- 18.Jones G, Jones RS, Fried D. Transillumination of interproximal caries lesions with 830-nm light. Lasers in Dentistry X. 2004;Vol. 5313:17–22. [Google Scholar]
- 19.Jones RS, Fried D. Attenuation of 1310-nm and 1550-nm Laser Light through Sound Dental Enamel. Lasers in Dentistry VIII. 2002;Vol. 4610:187–190. [Google Scholar]
- 20.Jones RS, Huynh GD, Jones GC, Fried D. Near-IR Transillumination at 1310-nm for the Imaging of Early Dental Caries. Optics Express. 2003;11(18):2259–2265. doi: 10.1364/oe.11.002259. [DOI] [PubMed] [Google Scholar]


