

Abstract
Objectives
To quantify rates of change in quadriceps muscle (QM) and intermuscular fat (IMF) volumes over 2-years in women in the Osteoarthritis Initiative (OAI) study and examine group differences between those with radiographic OA (ROA) and those without (non-ROA).
Methods
The OAI database was queried for women ≥50 years old in the incident and progression cohorts with and without ROA at baseline. Mid-thigh MRI scans (15 contiguous slices, 5 mm slice thickness) of eligible women were randomly selected and anonymized. Image pairs were registered. QM and IMF were segmented in the 12 most proximal matching slices with the segmenter blinded to image time point. Age-adjusted differences in QM and IMF volume changes between groups were tested using ANCOVA.
Results
41 women without ROA (mean (SD) age 60.7 (7.6) yrs) and 45 with ROA (mean (SD) age 64.5 (6.7) yrs) were included. Mean QM and IMF volume changes in the non-ROA group were -4.1 (11.1) cm3 and 3.4 (7.1) cm3, respectively, and -5.4 (13.5) cm3 and 3.1 (7.4) cm3 in the ROA group, respectively. Age-adjusted between-group differences in QM and IMF changes were not significant (p>0.05).
Conclusions
Two-year changes in QM and IMF volume appear consistent with ageing and do not seem to be related to OA status. Direct comparison with a control cohort without OA risk factors could confirm this. Since group assignment was based on baseline data, there may have been women in the non-ROA group who developed radiographic OA over follow-up resulting in some overlap between groups.
Among the prominent risk factors for the onset of knee OA are increasing age, female sex, previous joint trauma, obesity, and muscle weakness; obesity and muscle weakness are also implicated in OA progression (1-3). As a strong predictor of OA (4-6), the role of obesity was originally attributed to increased mechanical loading (4, 7). This theory has been supported by the discovery of mechanoreceptors, such as integrins, on chondrocytes that, when activated, stimulate the release of inflammatory mediators including cytokines, matrix metalloproteinases (MMP) and growth factors (4, 8, 9). However, obesity is also a risk factor for OA of non-weight bearing joints such as the hand; thus adipose tissue is thought to play a metabolic role in OA (5, 10, 11). The characterization of adipose tissue as an endocrine organ has increased our understanding of the role of adipokines in OA. These adipokines are mainly proinflammatory and, accordingly, are implicated in OA pathophysiology (4, 5, 8, 12, 13). One widely studied adipokine, leptin, facilitates the release of metalloproteinases (e.g., MMP-9, MMP-13) which degrade articular cartilage (8, 14, 15). Additionally, leptin increases growth factor expression (e.g., IGF-1, TGF- β). These growth factors, which stimulate chondrocyte repair, have also demonstrated harmful effects through stimulation of osteophyte formation (8, 14, 16). Obesity may also influence knee OA through adipose infiltration into thigh skeletal muscle, which is linked to poorer lower extremity performance in older individuals (17).
Like obesity, quadriceps weakness is implicated in knee OA incidence and progression (1-3, 18-22). As well as producing movement, the quadriceps muscles (QM) provide shock absorption and dynamic stability of the knee joint by dissipating loads and decreasing joint contact forces (19, 20, 23). In those with quadriceps weakness, this action would be compromised (19, 20). This weakness may result from a number of factors including poor muscle activation, and the ageing-associated loss of muscle mass and increased fatty infiltration into muscle, referred to as sarcopenia (19, 24-26). Clinical findings support the involvement of quadriceps weakness in knee OA. Ikeda and colleagues found QM cross-sectional area (CSA) to be, on average, 12% smaller in asymptomatic women with incident radiographic OA compared to age and body-mass matched controls (27). Additionally, quadriceps weakness correlated better with pain and disability than radiographic OA (18-22). Some studies have shown increased risk of disease initiation (22, 28). Quadriceps weakness has also been linked to the progression of knee OA through disuse atrophy of the quadriceps due to pain and disability: common consequences of knee OA (22). However, the amount of change in QM that occurs over time in individuals with knee OA remains unknown as previous studies have examined quadriceps CSA at a single time point (23). To the best of our knowledge, changes that occur in QM volume over time in an osteoarthritic population have not yet been reported.
Given the importance of obesity and muscle weakness in knee OA, the ability to quantify muscle and intermuscular fat (IMF) volume changes longitudinally may be critical factors in understanding OA initiation and progression. To our knowledge, such longitudinal changes have not been quantified in individuals at risk for or with established knee OA. As a result, this study aimed to quantify longitudinal changes in QM and IMF volumes in postmenopausal women at risk for and with existing knee OA over two years. Secondarily, we aimed to determine if longitudinal decreases in QM and increases in IMF volumes were greater in those with progressive knee OA than in those at risk for knee OA.
Patients and Methods
Study Participants
Data used in the preparation of this article were obtained from the Osteoarthritis Initiative (OAI) database, which is available for public access at http://www.oai.ucsf.edu/. The OAI is a multi-centre, longitudinal, observational cohort study designed to facilitate investigation of factors that influence OA incidence and progression. The OAI study population (N=4796) includes individuals 45 to 79 years of age and is divided into three cohorts; control, incident and progression. Controls (N=122) are an unexposed reference cohort with no radiographic evidence of OA and no risk factors, with the exception of age ≥ 70. The incident cohort (N=3285) includes individuals with risk factors for the development of OA. The progression cohort (N=1389) includes individuals with symptomatic and radiographic evidence of OA in at least one knee at baseline. Exclusion criteria for the OAI population included rheumatoid arthritis, magnetic resonance imaging (MRI) contraindication and bilateral end-stage knee OA (29).
Baseline and two-year follow-up thigh images were acquired for the entire OAI cohort from the OAI Coordinating Centre (UCSF, San Francisco, CA). The online OAI participant database was queried for women 50 years of age and older who had both baseline and two-year follow-up MRI thigh images available. Only those women in the incident and progression cohorts with no symptomatic and radiographic evidence of OA in the right knee were eligible for the non-OA group, while women were eligible for the OA group only if they had both radiographic and symptomatic OA in the right knee. The variables analyzed from the OAI database to determine symptomatic and radiographic OA were the screening variables coded P01RSXKOA and P01RXRKOA, respectively. Upon the release of baseline Kellgren-Lawrence (K-L) grades determined from right knee X-rays, the groups were re-classified. Individuals with a K-L grade of 0 or 1 were classified as having no radiographic OA in the right knee, but with risk factors, herein referred to as the non-ROA group. Individuals with a K-L grade of 2, 3 or 4 were classified as having symptomatic and radiographic OA in the right knee, herein referred to as the ROA group. Of all women meeting these criteria, baseline and 2-year follow up thigh images belonging to a random selection of eligible individuals were retrieved and saved on a PC. As shown in Figure 1, participants were excluded for three reasons based on quality control issues with the thigh MRI scans: inconsistent spatial resolution between baseline and follow-up scans, compressed or flattened thighs on either one of the two scans (Figure 2), and poor matches between baseline and follow-up scans (see Image Analysis Protocol section). Participants were also excluded if a baseline K-L grade was not available.
Figure 1.

Flow diagram representing selection of OAI participants meeting inclusion/exclusion criteria.
Figure 2.
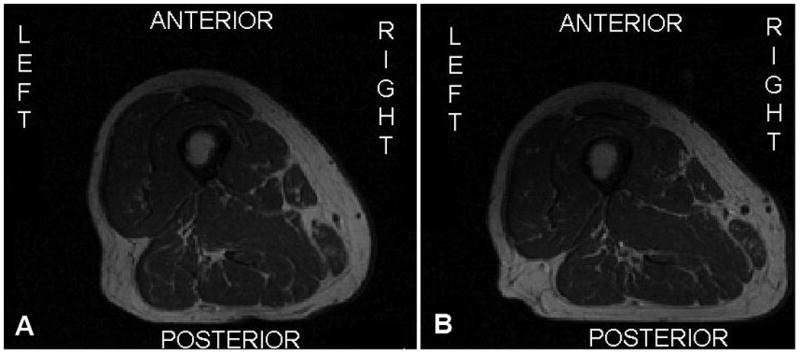
Example of baseline (A) and follow-up (B) right thigh images from the same participant where the posterior aspect of the thigh appears flattened out on the follow-up image.
Image Analysis Protocol
Bilateral MR images of the thighs include 15 consecutive T1-weighted axial slices (5mm slice thickness covering a 7 cm region of interest) with a TE/TI of 10ms and spatial resolution of 0.977mm × 0.977mm, acquired using a published protocol (29, 30). For each individual, only the right thigh was segmented. While the scanning protocol dictated that the most distal slice of the thigh be acquired at a distance 10 cm proximally from the epiphyseal line of the distal femur, inconsistences were observed in positioning of the scanned region of interest between baseline and 2-year follow-up scans. Given this, 3D volumetric image registration software (Analyze, Biomedical Imaging Resource, Mayo Clinic, Rochester, Minnesota) was used to match the slice positions in the baseline and 2-year images (31). Axial images were reconstructed using the software and matched across the axial, sagittal and coronal planes. Since the most distal slice of the baseline image did not always match with the most distal slice of the follow-up image, Analyze was used to determine which slices should be segmented for tissue volume based on the number of slices that matched. Acceptable matches were considered those with at least 12 out of 15 slices that matched (≥80%). Participants with fewer than 12 matching slices were excluded (referred to as “poor matches” in Figure 1). Participants with more than 12 matching slices were assessed based on the proximal 12 slices for consistency.
Thigh images were anonymized and analyzed for QM and IMF volume using a semi-automated software program that featured a watershed segmentation algorithm (SliceOmatic 4.3, TomoVision, Quebec, Canada). As noted by Cotofana et al, the gold standard for measuring muscle volume is the segmentation of muscle from a series of contiguous MRI scans which are acquired perpendicular to a muscle region of interest (32). Right thigh images from each participant were analyzed in pairs with the individual performing the segmentation blinded to the time point of image acquisition (baseline or follow-up). On each slice, tissues that were identified and segmented included cortical bone, bone marrow, QM, all remaining muscles, subcutaneous fat, and IMF. Subcutaneous fat was defined as fat immediately adjacent to the skin and external to the deep fascia around the thigh muscles; cortical bone was considered as the dark area of bone surrounding the marrow; and IMF was considered as all tissue (including vessels) surrounding the muscles within the deep facial layer. Fat located within the muscle (intramuscular fat) was included in the segmentation of the muscle because of limitations of the software's capabilities. Each tissue was tagged using a different colour (Figure 3). Within SliceOmatic, the watershed algorithm was configured with thresholds set at 1 pixel surface and 0.01% mean difference. The morphological segmentation of the first analyzed slice was propagated forward to the next 11 slices which were adjusted manually according to changes in tissue orientation. For the purpose of this study, only the IMF volume and QM volume data were used.
Figure 3.
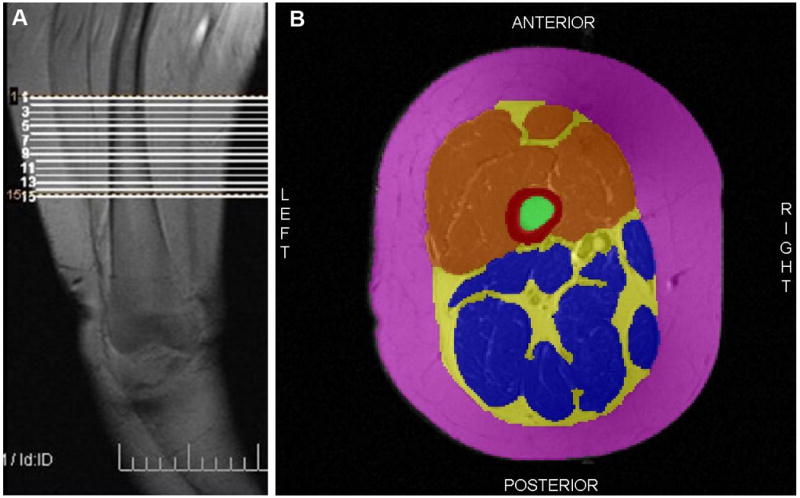
(A) Coronal MRI scout scan of right thigh showing region of interest. (B) Example of a segmented MRI of the right thigh. Red is cortical bone, green is bone marrow, orange is quadriceps muscles, blue is all other muscles, yellow is intermuscular fat and pink is subcutaneous fat.
Reliability
One trained research assistant segmented 72 right knee images belonging to 36 incident cohort participants and 36 progression cohort participants on two separate occasions separated by one week. During the second analyses, the segmenter was blinded to previous segmentations and results. A second research assistant, blinded to segmentation and results of the first segmenter, analyzed a random subset of the cohort (n=18) to provide comparison for inter-rater reliability. Reliability was calculated for each tissue using the two analyses of the baseline images and expressed as a root mean square coefficient of variation (RMSCV%) and type 2,1 Intraclass Correlation Coefficient (ICC). A sample size of 36 was calculated based on an ICC of 0.85 (lower 95% confidence interval limit of 0.75) (33). To assess reliability of the change in QM and IMF volume, one segmenter analyzed image pairs (baseline and 2-year follow-up images) on two separate occasions, four months apart. Again, type 1,2 ICCs were calculated.
Statistical Analyses
We estimated the sample size to be 40 participants per group based on the following assumptions: Type I error = 0.05 (1-tailed given our directional alternate hypothesis), Type II error = 0.15, and an effect size of 0.60. Descriptive statistics of baseline height, weight, body mass index (BMI) and WOMAC scores were calculated. Descriptive statistics of mean baseline, follow-up and change (follow-up value minus baseline value) in QM and IMF volumes were also calculated. Independent t-tests were conducted to determine if baseline age, weight, body mass index, WOMAC scores, QM volume and IMF volume were significantly different between the non-ROA and ROA groups. Paired t-tests were conducted to determine if longitudinal changes in QM volume and IMF volume within each group were significant. These analyses were repeated using an ANCOVA analysis to adjust for age. Differences or changes were considered significant at a level p<0.05. To determine whether longitudinal changes were greater in the ROA group than in the non-ROA group, an ANCOVA was performed. Given that age is associated with increases in fat and decreases in lean tissue, we adjusted for age in our analyses (24-26). Changes in QM and IMF volumes were analyzed separately.
Results
In total, 86 participants were included in the analyses; 41 from the non-ROA group and 45 from the ROA group. Baseline descriptive statistics for the study sample are shown in Table 1. The ROA group was found to be significantly older, heavier and more symptomatic at baseline than the non-ROA group.
Table 1.
Descriptive statistics of the total study sample and each group separately.
| Total Sample (n = 86) |
Non-ROA Group (n = 41) |
ROA Group (n = 45) |
|
|---|---|---|---|
| Mean (SD) | Mean (SD) | Mean (SD) | |
| Age (yrs) | 62.7 (7.3) | 60.7 (7.6) | 64.5(6.7) * |
| Height (cm) | 161.9 (6.0) | 162.1 (6.6) | 161.8 (5.3) |
| Weight (kg) | 71.4 (13.6) | 66.8 (12.2) | 75.6 (13.6) * |
| BMI (kg/m2) | 27.3 (5.1) | 25.6 (4.8) | 29.0 (4.9) * |
| WOMAC Pain Score (/20) | 3.2 (3.4) | 2.1 (2.6) | 4.2 (3.6) * |
| WOMAC Stiffness Score (/8) | 1.7 (1.5) | 1.1 (1.4) | 2.2 (1.4) * |
| WOMAC Physical Function Score (/68) | 9.8 (10.4) | 6.3 (8.1) | 13.0 (11.2) * |
denotes significant differences (p < 0.05) between groups.
Baseline and 2-year follow-up data for QM and IMF volumes are displayed in Table 2. Baseline QM and IMF volumes were not significantly different between groups (p>0.05). The mean QM volume decreased by 1.5% in the non-ROA group compared to a decrease of 2.1% in the ROA group. Concurrently, the mean IMF volume increased by 3.5% in the non-ROA group compared to 2.9% in the ROA group. Within each group, these longitudinal changes were significant (p<0.05).
Table 2.
Measurements of quadriceps muscle and intermuscular fat volume and longitudinal changes for the total study sample and each group separately.
| Total Sample (n = 86) |
Non-ROA Group (n = 41) |
ROA Group (n = 45) |
||
|---|---|---|---|---|
| Mean (SD) | Mean (SD) | Mean (SD) | ||
| Quadriceps Muscle Volume | Baseline (cm3) | 248.6 (45.5) | 245.3 (42.7) | 251.6 (48.2) |
| Follow-up (cm3) | 243.8 (44.8) | 241.2 (41.5) | 246.2 (48.0) | |
| Change (cm3) | -4.8 (12.3) | -4.1 (11.1) * | -5.4 (13.5) * | |
| % Change | -1.8 (5.0) | -1.5 (4.4) | -2.1 (5.5) | |
| Intermuscular Fat Volume | Baseline (cm3) | 103.5 (36.0) | 95.2 (32.5) | 111.1 (37.7) |
| Follow-up (cm3) | 106.7 (37.9) | 98.6 (35.2) | 114.1 (39.2) | |
| Change (cm3) | 3.2 (7.2) | 3.4 (7.1) * | 3.1 (7.4) * | |
| % Change | 3.2 (7.4) | 3.5 (8.2) | 2.9 (6.7) |
denotes significant changes within each group from baseline without adjustment for age (p<0.05).
After adjusting for age, longitudinal changes in QM and IMF volumes within each group were no longer significant (p>0.05). The between-group difference in change in QM volume when adjusted for age was not statistically significant [ANCOVA: F(1,83)=0.037, p=0.848). Likewise, a significant difference between groups was not observed for the age-adjusted change in IMF volume [ANCOVA: F(1,83)=0.000, p=0.986).
Intra-rater reliability for QM volume was RMSCV = 0.403%; ICC = 1.00 [95%CI:1.00, 1.00], and was RMSCV = 5.7%; ICC = 0.958 [95%CI:0.641, 0.987] for IMF. Inter-rater reliability based on the subset of images was excellent for QM RMSCV = 0.57%; ICC =0.999 (95%CI:0.996, 0.999) and IMF (RMSCV = 2.79%; ICC = 0.997 ([95%CI:0.992, 0.999]). Reliability measures were similar between participants from both groups (data not shown). Reliability for changes in QM and IMF data was also calculated. For QM change, the ICC was 1.00 [95%CI:1.00, 1.00], and for IMF change, the ICC was 1.00 [95%CI:1.00, 1.00].
Discussion
To our knowledge, this is the first study to quantify tissue volume in women at risk for knee OA and with progressive OA, to investigate the magnitude of change in QM and IMF volume over 2-years and to compare these longitudinal changes between the women with and without radiographic knee OA. Outcome measures of QM and IMF volume were acquired from analyses of MRI scans of the mid-thigh region. While most research to date has reported area measurements derived from cross-sectional images as an outcome measure, such outcomes are less robust in quantifying longitudinal change because even slight alterations in position of slice acquisition can significantly alter results. Results of our analyses revealed that longitudinal changes in QM and IMF volumes were relatively small in absolute and relative magnitude for both groups. Given that increasing age is associated with increasing IMF and decreasing QM mass and strength, within-group changes in QM and IMF volumes were age-adjusted and found to be not statistically significant. Additionally, longitudinal changes in QM and IMF volumes were not greater in magnitude in women with progressive radiographic knee OA than in women with risk factors for knee OA after adjustment for age.
Previous work conducted in non-osteoarthritic populations has reported longitudinal tissue changes, although the imaging modalities and outcome measures have varied. One previous study documenting longitudinal changes in IMF mass and skeletal muscle mass using MRI was identified. This study, conducted in 26 older (mean age 75 years), healthy African-American women without knee OA, showed decreases in whole body skeletal muscle mass and increases in IMF mass over 2-years (34). It should be noted that while skeletal muscle and IMF were imaged using MRI, scans were not acquired at the same thigh region of interest as those in the present study. Another study examining longitudinal changes in cross-sectional areas of thigh muscle and IMF in 1678 well-functioning elderly men and women (mean age 73 years) measured from computed tomography (CT) scans (35) found 5 year changes of -3.2% (SD: 7.9%) and 29.0% (SD: 43.6%) for total thigh muscle and IMF areas, respectively. Additionally, a study conducted in 328 elderly men and women (mean age 74.6 years) using dual-energy x-ray absorptiometry (DXA) scans to measure 3-year change in appendicular skeletal muscle mass reported a change of 1.9% (SD 5.4%) (36) Comparisons between our study and those previously published in otherwise-healthy ageing adults are difficult to assess given differences in population sex, age, imaging modality (i.e. DXA, CT) and outcome measures (i.e. cross-sectional area, mass).
The tissue changes observed here in women without ROA but with OA risk factors and in women with radiographic and symptomatic OA of concurrent losses in QM volume and gains in IMF volume appear consistent with sarcopenic changes observed in previously conducted longitudinal studies of ageing in relatively healthy, non-osteoarthritic populations described in the previous paragraph (24, 34-36). In fact, after adjusting for age in our analyses, longitudinal changes in QM volume and IMF volume were not significant. Changes due to ageing are associated with disuse atrophy, impaired muscle activation and metabolic changes. However, it must be noted that since there was no “control” group included in our study, longitudinal volume changes in QM and IMF yielded from analyses of mid-thigh MRI images that occur in otherwise healthy ageing individuals without risk factors for knee OA were not assessed. Our results can be interpreted in two ways; tissue changes that occur due to the presence of risk factors for knee OA or progressive knee OA may not be greater than changes that are associated with ageing or 2-year changes that occur in women due to knee OA risk factors or the disease itself are small.
The absence of significant differences between the group with and without ROA in the longitudinal change in QM and IMF volumes suggests that women with risk factors for knee OA experience similar tissue changes to those with progressive knee OA. IMF has been found to be associated with adverse metabolic effects due to mediators such as cytokines, and to negatively influence muscle strength, thus contributing to an increased risk of loss of mobility (17, 26, 37). Increases in IMF volume in women at risk for OA may contribute to worsening disease symptoms and progressive disease, although this must be investigated further in future studies. The same may be true for declines in quadriceps muscle volume in women at risk for knee OA where tissue decreases may precede declines in clinical symptoms or muscle strength and lower extremity function which have been associated with increased joint pain and neuromuscular deficits in individuals with knee OA (20, 21). Slemenda and colleagues previously reported that increased quadriceps strength at baseline reduced the risk of developing knee OA by 55% over a 2.5 year follow up, thus suggesting a role for QM weakness in knee OA initiation (28). In fact, quadriceps weakness was found to predict joint space narrowing, but not incident knee symptoms, in the Multicentre Knee Osteoarthritis cohort (MOST) (38-40). Associations between longitudinal changes in QM volume and concurrent changes in pain and functional decline have not yet been described.
Given our study objectives, several limitations were identified. Our study was underpowered to detect differences between groups based on the small effect sizes (0.01 to 0.02 for QM and IMF, respectively) revealed in this study suggesting that a large sample size would be required to detect differences between groups. The study sample only included women and was drawn from a database comprised of mainly Caucasian participants. Thigh MRI scans were acquired from a region of interest at a fixed distance above the epiphyseal line, rather than a relative distance, resulting in slightly different regions of interest given individual differences in leg lengths. We minimized the impact of these positioning differences by reporting tissue changes within individuals over time. Image acquisition inconsistency (poor region matches between time points, inconsistent pixel spacing in images between time points, and compressed thighs in images in either time point) resulted in the exclusion of a number of potential participants. Quadriceps volume was determined for a specified region of interest in the thigh and not the entire thigh and thus may not be most representative of the region of the quadriceps which experiences the most change in knee OA. Additionally, intramuscular fat was not evaluated separately in this study due to limitations of software analysis techniques. It may be beneficial to evaluate intramuscular fat changes in future study. Finally, the OAI study population included a very small control group which was younger than the incident and progression groups. Since the vast majority of these participants were ineligible for our study because of a lack of available thigh MRI scan or they did not meet our image inclusion criteria, a reference group was not available for comparison. Future longitudinal analyses of such a sub-group might allow the calculation of smallest detectable differences to determine the level of change in an individual that could be said to be a definite loss of volume.
Our study results provide novel data upon which to base plans for future research investigating longitudinal changes over a longer time period to gauge the pattern of the trajectory for soft tissue change in those at risk for and with existing knee radiographic and symptomatic OA. Upon the release of more follow-up thigh images from the OAI (i.e. 4-year follow-up scans), it may be beneficial to identify sub-groups of participants to further elucidate potential differences between individuals who progress to radiographic OA during the study follow-up compared to those who do not and those with established progressive disease.
Conclusions
Women at risk for knee OA and with progressive radiographic OA demonstrate decreases in QM volume and increases in IMF volume over 2-years which appear to be consistent with sarcopenic changes related to ageing and not necessarily disease state. The magnitudes of these longitudinal changes appear similar, regardless of the presence of radiographic and symptomatic OA. The inclusion of a similarly aged group of women without risk factors for knee OA may help determine whether tissue changes observed here are solely consequences of ageing or whether tissue changes precede disease onset and continue thereafter. While questions remain about the long-term trajectory of thigh tissue changes in those at risk for and with progressive knee OA, these results have important implications in understanding this disease process in relation to integral thigh tissues supporting the knee joint. Future analyses of 4-year follow-up thigh images may help to address these questions.
Significance and Innovations.
Changes in intermuscular fat and quadriceps muscle volume, the primary outcome measures in this study, are novel outcomes. Most research has reported area derived from cross-sectional images as an outcome measure which is less robust in measuring longitudinal change because even slight alterations in position of slice acquisition can significantly alter results.
This is the first time that longitudinal changes in thigh intermuscular fat and quadriceps muscle volume have been quantified.
This is the first time that longitudinal changes in thigh intermuscular fat and quadriceps muscle volume have been quantified in a population with knee OA.
For the first time, comparisons in thigh tissue volume in individuals with established knee OA are compared with a population at-risk for knee OA, using images acquired in the Osteoarthritis Initiative Study.
Acknowledgments
The OAI is a public-private partnership comprised of five contracts (N01-AR-2-2258; N01-AR-2-2259; N01-AR-2-2260; N01-AR-2-2261; N01-AR-2-2262) funded by the National Institutes of Health, a branch of the Department of Health and Human Services, and conducted by the OAI Study Investigators. Private funding partners include Merck Research Laboratories; Novartis Pharmaceuticals Corporation, GlaxoSmithKline; and Pfizer, Inc. Private sector funding for the OAI is managed by the Foundation for the National Institutes of Health. This manuscript was prepared using an OAI public use data set and does not necessarily reflect the opinions or views of the OAI investigators, the NIH, or the private funding partners.
Financial Support: Dr. Karen Beattie holds a McMaster University Department of Medicine Internal Career Research Award and a Network Scholar Award through the Canadian Arthritis Network. This study was funded in part by NSERC Discovery Grant (#311896, NJM).
Contributor Information
Karen A. Beattie, Email: karen.beattie@camris.ca, Dept. of Medicine, McMaster University, c/o 501-25 Charlton Ave. East, Hamilton, ON L8N 1Y2, Phone: 905-527-9100 Fax: 905-521-1297.
Norma J. MacIntyre, Email: macint@mcmaster.ca, School of Rehabilitation Science, Institute for Applied Health Sciences, Rm 432/403, 1400 Main Street West, Hamilton, ON L8S 1C7.
Khaled Ramadan, Email: khaledramadan22@gmail.com, McMaster University, c/o 501-25 Charlton Ave. East, Hamilton, ON L8N 1Y2.
Dean Inglis, Email: dean.inglis@symptatico.ca, Dept. of Civil Engineering, McMaster University, c/o 501-25 Charlton Ave. East, Hamilton, ON L8N 1Y2.
Monica R. Maly, Email: mmaly@mcmaster.ca, School of Rehabilitation Science, Institute for Applied Health Sciences, Rm 435/403, 1400 Main Street West, Hamilton, ON L8S 1C7.
References
- 1.Creamer P, Hochberg MC. Osteoarthritis. Lancet. 1997;350(9076):503–8. doi: 10.1016/S0140-6736(97)07226-7. [DOI] [PubMed] [Google Scholar]
- 2.Goldring MB, Goldring SR. Osteoarthritis. J Cell Physiol. 2007;213(3):626–34. doi: 10.1002/jcp.21258. [DOI] [PubMed] [Google Scholar]
- 3.Sharma L, Dunlop DD, Cahue S, Song J, Hayes KW. Quadriceps strength and osteoarthritis progression in malaligned and lax knees. Ann Intern Med. 2003;138(8):613–9. doi: 10.7326/0003-4819-138-8-200304150-00006. [DOI] [PubMed] [Google Scholar]
- 4.Gabay O, Hall DJ, Berenbaum F, Henrotin Y, Sanchez C. Osteoarthritis and obesity: experimental models. Joint Bone Spine. 2008;75(6):675–9. doi: 10.1016/j.jbspin.2008.07.011. [DOI] [PMC free article] [PubMed] [Google Scholar]
- 5.Pottie P, Presle N, Terlain B, Netter P, Mainard D, Berenbaum F. Obesity and osteoarthritis: more complex than predicted! Ann Rheum Dis. 2006;65(11):1403–5. doi: 10.1136/ard.2006.061994. [DOI] [PMC free article] [PubMed] [Google Scholar]
- 6.Anderson JJ, Felson DT. Factors associated with osteoarthritis of the knee in the first national Health and Nutrition Examination Survey (HANES I). Evidence for an association with overweight, race, and physical demands of work. Am J Epidemiol. 1988;128(1):179–89. doi: 10.1093/oxfordjournals.aje.a114939. [DOI] [PubMed] [Google Scholar]
- 7.Griffin TM, Guilak F. The role of mechanical loading in the onset and progression of osteoarthritis. Exerc Sport Sci Rev. 2005;33(4):195–200. doi: 10.1097/00003677-200510000-00008. [DOI] [PubMed] [Google Scholar]
- 8.Dumond H, Presle N, Terlain B, Mainard D, Loeuille D, Netter P, et al. Evidence for a key role of leptin in osteoarthritis. Arthritis Rheum. 2003;48(11):3118–29. doi: 10.1002/art.11303. [DOI] [PubMed] [Google Scholar]
- 9.Guilak F, Fermor B, Keefe FJ, Kraus VB, Olson SA, Pisetsky DS, et al. The role of biomechanics and inflammation in cartilage injury and repair. Clin Orthop Relat Res. 2004;(423):17–26. doi: 10.1097/01.blo.0000131233.83640.91. [DOI] [PubMed] [Google Scholar]
- 10.Cicuttini FM, Baker JR, Spector TD. The association of obesity with osteoarthritis of the hand and knee in women: a twin study. J Rheumatol. 1996;23(7):1221–6. [PubMed] [Google Scholar]
- 11.Oliveria SA, Felson DT, Cirillo PA, Reed JI, Walker AM. Body weight, body mass index, and incident symptomatic osteoarthritis of the hand, hip, and knee. Epidemiology. 1999;10(2):161–6. [PubMed] [Google Scholar]
- 12.Gegout PP, Francin PJ, Mainard D, Presle N. Adipokines in osteoarthritis: friends or foes of cartilage homeostasis? Joint Bone Spine. 2008;75(6):669–71. doi: 10.1016/j.jbspin.2008.07.008. [DOI] [PubMed] [Google Scholar]
- 13.Kershaw EE, Flier JS. Adipose tissue as an endocrine organ. J Clin Endocrinol Metab. 2004;89(6):2548–56. doi: 10.1210/jc.2004-0395. [DOI] [PubMed] [Google Scholar]
- 14.Ku JH, Lee CK, Joo BS, An BM, Choi SH, Wang TH, et al. Correlation of synovial fluid leptin concentrations with the severity of osteoarthritis. Clin Rheumatol. 2009;28(12):1431–5. doi: 10.1007/s10067-009-1242-8. [DOI] [PubMed] [Google Scholar]
- 15.Simopoulou T, Malizos KN, Iliopoulos D, Stefanou N, Papatheodorou L, Ioannou M, et al. Differential expression of leptin and leptin's receptor isoform (Ob-Rb) mRNA between advanced and minimally affected osteoarthritic cartilage; effect on cartilage metabolism. Osteoarthritis Cartilage. 2007;15(8):872–83. doi: 10.1016/j.joca.2007.01.018. [DOI] [PubMed] [Google Scholar]
- 16.van Beuningen HM, Glansbeek HL, van der Kraan PM, van den Berg WB. Osteoarthritis-like changes in the murine knee joint resulting from intra-articular transforming growth factor-beta injections. Osteoarthritis Cartilage. 2000;8(1):25–33. doi: 10.1053/joca.1999.0267. [DOI] [PubMed] [Google Scholar]
- 17.Visser M, Kritchevsky SB, Goodpaster BH, Newman AB, Nevitt M, Stamm E, et al. Leg muscle mass and composition in relation to lower extremity performance in men and women aged 70 to 79: the health, aging and body composition study. J Am Geriatr Soc. 2002;50(5):897–904. doi: 10.1046/j.1532-5415.2002.50217.x. [DOI] [PubMed] [Google Scholar]
- 18.Hurley MV. Quadriceps weakness in osteoarthritis. Curr Opin Rheumatol. 1998;10(3):246–50. doi: 10.1097/00002281-199805000-00015. [DOI] [PubMed] [Google Scholar]
- 19.Hurley MV. The role of muscle weakness in the pathogenesis of osteoarthritis. Rheum Dis Clin North Am. 1999;25(2):283–98. vi. doi: 10.1016/s0889-857x(05)70068-5. [DOI] [PubMed] [Google Scholar]
- 20.Lewek MD, Rudolph KS, Snyder-Mackler L. Quadriceps femoris muscle weakness and activation failure in patients with symptomatic knee osteoarthritis. J Orthop Res. 2004;22(1):110–5. doi: 10.1016/S0736-0266(03)00154-2. [DOI] [PMC free article] [PubMed] [Google Scholar]
- 21.O'Reilly SC, Jones A, Muir KR, Doherty M. Quadriceps weakness in knee osteoarthritis: the effect on pain and disability. Ann Rheum Dis. 1998;57(10):588–94. doi: 10.1136/ard.57.10.588. [DOI] [PMC free article] [PubMed] [Google Scholar]
- 22.Slemenda C, Brandt KD, Heilman DK, Mazzuca S, Braunstein EM, Katz BP, et al. Quadriceps weakness and osteoarthritis of the knee. Ann Intern Med. 1997;127(2):97–104. doi: 10.7326/0003-4819-127-2-199707150-00001. [DOI] [PubMed] [Google Scholar]
- 23.Bennell KL, Hunt MA, Wrigley TV, Lim BW, Hinman RS. Role of muscle in the genesis and management of knee osteoarthritis. Rheum Dis Clin North Am. 2008;34(3):731–54. doi: 10.1016/j.rdc.2008.05.005. [DOI] [PubMed] [Google Scholar]
- 24.Frontera WR, Hughes VA, Fielding RA, Fiatarone MA, Evans WJ, Roubenoff R. Aging of skeletal muscle: a 12-yr longitudinal study. J Appl Physiol. 2000;88(4):1321–6. doi: 10.1152/jappl.2000.88.4.1321. [DOI] [PubMed] [Google Scholar]
- 25.Visser M, Goodpaster BH, Kritchevsky SB, Newman AB, Nevitt M, Rubin SM, et al. Muscle mass, muscle strength, and muscle fat infiltration as predictors of incident mobility limitations in well-functioning older persons. J Gerontol A Biol Sci Med Sci. 2005;60(3):324–33. doi: 10.1093/gerona/60.3.324. [DOI] [PubMed] [Google Scholar]
- 26.Marcus RL, Addison O, Kidde JP, Dibble LE, Lastayo PC. Skeletal muscle fat infiltration: impact of age, inactivity, and exercise. J Nutr Health Aging. 2010;14(5):362–6. doi: 10.1007/s12603-010-0081-2. [DOI] [PMC free article] [PubMed] [Google Scholar]
- 27.Ikeda S, Tsumura H, Torisu T. Age-related quadriceps-dominant muscle atrophy and incident radiographic knee osteoarthritis. J Orthop Sci. 2005;10(2):121–6. doi: 10.1007/s00776-004-0876-2. [DOI] [PubMed] [Google Scholar]
- 28.Slemenda C, Heilman DK, Brandt KD, Katz BP, Mazzuca SA, Braunstein EM, et al. Reduced quadriceps strength relative to body weight: a risk factor for knee osteoarthritis in women? Arthritis Rheum. 1998;41(11):1951–9. doi: 10.1002/1529-0131(199811)41:11<1951::AID-ART9>3.0.CO;2-9. [DOI] [PubMed] [Google Scholar]
- 29.Nevitt M, Felson D, Lester G. The Osteoarthritis Initiative California. San Francisco: University of California San Francisco; 2006. [Google Scholar]
- 30.Nevitt M, Felson D, Lester G. OAI Protocol Appendix F. Knee MRI Sequence Parameters. 2006 [Google Scholar]
- 31.Patel VV, Hall K, Ries M, Lindsey C, Ozhinsky E, Lu Y, et al. Magnetic resonance imaging of patellofemoral kinematics with weight-bearing. J Bone Joint Surg Am. 2003;85-A(12):2419–24. doi: 10.2106/00004623-200312000-00021. [DOI] [PubMed] [Google Scholar]
- 32.Cotofana S, Hudelmaier M, Wirth W, Himmer M, Ring-Dimitriou S, Sanger AM, et al. Correlation between single-slice muscle anatomical cross-sectional area and muscle volume in thigh extensors, flexors and adductors of perimenopausal women. Eur J Appl Physiol. 2010;110(1):91–7. doi: 10.1007/s00421-010-1477-8. [DOI] [PubMed] [Google Scholar]
- 33.Stratford P. Getting more from the literature: Estimating the standard error of measurement for reliability studies. Physiother Can. 2003;56:27–30. [Google Scholar]
- 34.Song MY, Ruts E, Kim J, Janumala I, Heymsfield S, Gallagher D. Sarcopenia and increased adipose tissue infiltration of muscle in elderly African American women. Am J Clin Nutr. 2004;79(5):874–80. doi: 10.1093/ajcn/79.5.874. [DOI] [PubMed] [Google Scholar]
- 35.Delmonico MJ, Harris TB, Visser M, Park SW, Conroy MB, Velasquez-Mieyer P, et al. Longitudinal study of muscle strength, quality, and adipose tissue infiltration. Am J Clin Nutr. 2009;90(6):1579–85. doi: 10.3945/ajcn.2009.28047. [DOI] [PMC free article] [PubMed] [Google Scholar]
- 36.Schaap LA, Pluijm SM, Deeg DJ, Visser M. Inflammatory markers and loss of muscle mass (sarcopenia) and strength. Am J Med. 2006;119(6):526, e9–17. doi: 10.1016/j.amjmed.2005.10.049. [DOI] [PubMed] [Google Scholar]
- 37.Clark BC, Manini TM. Sarcopenia =/= dynapenia. J Gerontol A Biol Sci Med Sci. 2008;63(8):829–34. doi: 10.1093/gerona/63.8.829. [DOI] [PubMed] [Google Scholar]
- 38.Segal NA, Glass NA, Torner J, Yang M, Felson DT, Sharma L, et al. Quadriceps weakness predicts risk for knee joint space narrowing in women in the MOST cohort. Osteoarthritis Cartilage. 2010;18(6):769–75. doi: 10.1016/j.joca.2010.02.002. [DOI] [PMC free article] [PubMed] [Google Scholar]
- 39.Segal NA, Torner JC, Felson DT, Niu J, Sharma L, Lewis CE, et al. Knee extensor strength does not protect against incident knee symptoms at 30 months in the multicenter knee osteoarthritis (MOST) cohort. PM R. 2009;1(5):459–65. doi: 10.1016/j.pmrj.2009.03.005. [DOI] [PMC free article] [PubMed] [Google Scholar]
- 40.Segal NA, Torner JC, Felson D, Niu J, Sharma L, Lewis CE, et al. Effect of thigh strength on incident radiographic and symptomatic knee osteoarthritis in a longitudinal cohort. Arthritis Rheum. 2009;61(9):1210–7. doi: 10.1002/art.24541. [DOI] [PMC free article] [PubMed] [Google Scholar]