

In 1988, the International Agency for Research on Cancer (IARC) Monograph on the carcinogenic risk to humans of alcohol drinking concluded that the occurrence of malignant tumours of the oral cavity, pharynx, larynx, oesophagus and liver was causally related to the consumption of alcoholic beverages. In an updated review (Baan et al, 2007; Secretan et al, 2009), they noted the consistent finding of an increased risk of breast cancer with increasing alcohol intake, and that an association between alcohol consumption and colorectal cancer had been reported by more than 50 prospective and case–control studies, with no difference in the risk for colon and rectal cancers (Baan et al, 2007). The World Cancer Research Fund report (WCRF, 2007) considered that the evidence for an association of alcohol intake with these sites was convincing and, for liver cancer, probable.
Methods
Quantitative risk of alcohol
Table 1 shows the increase in risk associated with consumption of 1 g per day of alcohol. The estimates in these studies had been adjusted for major confounders, notably smoking.
Table 1. Increase in risk of cancer associated with 1 gram of alcohol per day.
| Cancer type | Studies | Increase in risk per gram alcohol per day |
|---|---|---|
| Oral cavity and pharynx | Corrao et al (2004) | 0.0185 |
| Larynx | Corrao et al (2004) | 0.0136 |
| Oesophagus | Corrao et al (2004) | 0.0129 |
| Colorectal cancer | Cho et al (2004) | 0.0080 |
| Moskal et al (2007) | ||
| Ferrari et al (2007) | ||
| WCRF (2007) | ||
| Breast | Collaborative Group (Hamajima et al, 2002) | 0.0071 |
| Liver | Corrao et al (2004) | 0.0059 |
With respect to breast cancer, the estimate was derived from a meta-analysis of 53 studies, conducted by the Collaborative Group on Hormonal Factors in Breast Cancer (Hamajima et al, 2002), which found that the risk was increased by 7.1% for every 10 g of daily alcoholintake. The values observed in subsequent studies are not substantially different. A pooled analysis of six cohort studies with data on alcohol and dietary factors found that the risk of breast cancer increased monotonically with increasing intake of alcohol; the multivariate relative risk (RR) for a 10-g per day increase in alcohol was 1.09 (95% CI=1.04–1.13; Smith-Warner et al, 1998). The EPIC study (Tjønneland et al, 2007) found that the risk was 1.03 (95% CI=1.01–1.05) per 10-g per day recent alcohol intake, whereas in the Million Women Study the increase in risk associated with 10 g per day intake was 12% (Allen et al, 2009).
With respect to cancers of the colorectum, a pooled analysis of eight cohort studies reported a borderline statistically significant 16% risk increase for people drinking 30–45 g per day of alcohol and a significant 41% risk increase for people drinking ⩾45 g per day (Cho et al, 2004). A more recent meta-analysis of cohort studies found a 15% increase in the risk of colon or rectal cancer for an increase of 100 g alcohol intake per week (Moskal et al, 2007), with no difference between men and women. In the EPIC study (Ferrari et al, 2007), the effect was a bit weaker, with alcohol intake at study baseline increasing colorectal cancer risk by 9% per 15 g per day, a risk greater for rectal cancer than for cancer of the distal colon, which in turn was greater than the risk for cancer of the proximal colon. In the WCRF (2007) report, a meta-analysis of eight studies of colon cancer yielded a combined RR of 1.09 (1.03–1.14) per 10 g intake per day, and a meta-analysis of nine studies of rectal cancer yielded an RR of 1.06 (1.01–1.12) per 10 g intake per day.
The means in the meta-analyses of Cho et al (2004), Moskal et al (2007), the EPIC study (Ferrari et al, 2007) and WCRF (2007) are 0.75% per gram alcohol per day for colon cancer and 0.85% per gram per day for rectal cancer. As these estimates are similar, the global figure of 0.8% per gram (increase of 0.008 per gram per day) was used for colorectal cancer as a whole (Table 1).
For the remaining cancers, the meta-analysis of Corrao et al (2004) was used to estimate the RRs. They present RRs associated with a mean intake of 0, 25, 50 and 100 g of alcohol per day. The RR per gram of alcohol intake was estimated by assuming a log–linear relationship between exposure and risk, so that:
where x is the exposure level (in grams per day).
Prevalence of exposure to alcohol
The latent period or interval between ‘exposure’ to alcohol and the appropriate increase in risk of these cancers is not known. We chose to assume that this would be, on average, 10 years, and thus examine the effects on cancers occurring in 2010 from non-optimal levels of alcohol consumption in the year 2000.
There are two main ways of measuring the amount of alcohol consumed: asking people how much alcohol they drink or counting how much alcohol is sold. As the estimates of the effect of past alcohol drinking on cancer risk are based on epidemiological studies in which alcohol intake is estimated from questionnaire data, it is most appropriate to base the exposure prevalence on data from a similar source.
We have used data from the National Diet and Nutrition Survey, a survey of the diet and nutrition of a representative sample of adults in the age group of 19–64 years living in private households in Great Britain, carried out between July 2000 and June 2001 (Henderson et al, 2003). For the age group >65 years, we used data on the proportion of non-drinkers, and average alcohol consumption from the General Household Survey (for England) (Goddard, 2006). From these tables, an estimate was prepared of the proportions of individuals (by age group and sex) consuming different quantities of alcohol in terms of grams per day, assuming that 1 unit of alcoholic beverages contains 8 g of pure alcohol (Table 2).
Table 2. Estimated percentage of the population at 12 levels of alcohol consumption.
|
% of
population consuming the specified grams per day alcohol in
Great Britain during 2000–2001
|
|||||||||||||
|---|---|---|---|---|---|---|---|---|---|---|---|---|---|
|
Alcohol consumption
|
Men by age (years)
|
Women by age
(years)
|
|||||||||||
| Level | Grams per day | 19–24 | 25–34 | 35–49 | 50–64 | 65+ | All 19+ | 19–24 | 25–34 | 35–49 | 50–64 | 65+ | All 19+ |
| 1 | 0 | 20 | 18 | 16 | 23 | 26 | 20 | 29 | 31 | 31 | 33 | 49 | 35 |
| 2 | 0.5 | 2 | 1 | 1 | 2 | 4 | 2 | 0 | 2 | 3 | 5 | 3 | 3 |
| 3 | 1.5 | 3 | 4 | 1 | 4 | 5 | 3 | 8 | 6 | 5 | 5 | 4 | 5 |
| 4 | 3.5 | 5 | 8 | 11 | 7 | 7 | 8 | 11 | 10 | 10 | 15 | 9 | 11 |
| 5 | 7.5 | 16 | 9 | 10 | 8 | 11 | 10 | 16 | 16 | 18 | 9 | 8 | 13 |
| 6 | 12.5 | 14 | 8 | 6 | 14 | 10 | 10 | 7 | 12 | 11 | 9 | 7 | 9 |
| 7 | 17.5 | 4 | 14 | 9 | 7 | 8 | 9 | 7 | 10 | 7 | 7 | 6 | 7 |
| 8 | 25 | 11 | 11 | 16 | 9 | 7 | 11 | 10 | 7 | 9 | 11 | 7 | 9 |
| 9 | 35 | 5 | 7 | 11 | 5 | 6 | 7 | 5 | 5 | 3 | 3 | 4 | 4 |
| 10 | 45 | 7 | 5 | 5 | 8 | 5 | 6 | 4 | 0 | 2 | 3 | 2 | 2 |
| 11 | 55 | 8 | 4 | 5 | 3 | 6 | 5 | 2 | 0 | 0 | 0 | 1 | 0 |
| 12 | 70 | 5 | 11 | 9 | 10 | 5 | 8 | 1 | 1 | 1 | 0 | 0 | 0 |
| Mean grams per day | 20.4 | 22.2 | 23.1 | 21.1 | 12.6 | 23.6 | 11.4 | 9.1 | 9.2 | 8.6 | 7.7 | 11.6 | |
Data for 19–64-year-olds from Henderson (2003); data for >65-year-olds from Goddard (2006).
The same data are shown in Figure 1, as the cumulative percentages of men and women of different ages with different levels of alcohol intake in 2000, as grams per day of alcohol.
Figure 1.

Cumulative percentage of population with different alcohol intakes.
Estimation of population attributable fractions (PAFs)
For the six cancer types, PAFs were calculated for each sex–age group according to the usual formula:
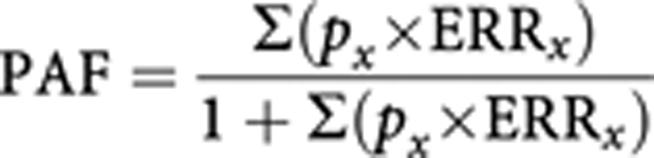 |
where px is the proportion of the population in consumption level x (x=1–12) and ERRx the excess relative risk (RRx−1) in consumption level x (x=1–12).
The ERR of alcohol consumption for each level x of alcohol consumption given in Table 2 was calculated as follows:
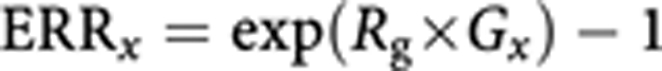 |
where Rg is the increase in risk per gram of alcohol intake (Table 1) and Gx the intake of alcohol (grams per day) in consumption category x (Table 2).
Results
Table 3 shows for each sex and age group the numbers of cases of the six alcohol-related cancers in the UK in 2010, the PAFs due to alcohol consumption 10 years earlier (2000–2001) and the corresponding number of excess cases (calculated as (observed × PAF)).
Table 3. Cancer cases diagnosed in 2010 attributable to alcohol consumption in 2000–2001.
|
Cases attributable to alcohol
consumption for each cancer
|
|||||||||||||||||||
|---|---|---|---|---|---|---|---|---|---|---|---|---|---|---|---|---|---|---|---|
|
Age (years)
|
Oral cavity and pharynx
|
Oesophagus
|
Colon–rectum
|
Liver
|
Larynx
|
Breast
|
|||||||||||||
| At exposure | At outcome (+10 years) | PAF | Obs. | Excess attrib. cases | PAF | Obs. | Excess attrib. cases | PAF | Obs. | Excess attrib. cases | PAF | Obs. | Excess attrib. cases | PAF | Obs. | Excess attrib. cases | PAF | Obs. | Excess attrib. cases |
| Men | |||||||||||||||||||
| 15–24 | 25–34 | 0.36 | 55 | 19.6 | 0.25 | 11 | 2.8 | 0.16 | 133 | 20.8 | 0.12 | 19 | 2.1 | 0.26 | 2 | 0.5 | |||
| 25–34 | 35–44 | 0.39 | 244 | 96.1 | 0.28 | 86 | 24.0 | 0.17 | 397 | 69.2 | 0.13 | 43 | 5.5 | 0.29 | 35 | 10.3 | |||
| 35–49 | 45–59 | 0.40 | 1591 | 631.8 | 0.28 | 970 | 274.9 | 0.18 | 2921 | 521.1 | 0.13 | 351 | 46.4 | 0.30 | 407 | 121.3 | |||
| 50–64 | 60–74 | 0.38 | 1888 | 709.1 | 0.26 | 2535 | 668.2 | 0.16 | 9481 | 1548.0 | 0.12 | 1011 | 121.4 | 0.28 | 914 | 253.9 | |||
| ⩾65 | ⩾75 | 0.32 | 768 | 249.1 | 0.22 | 2108 | 473.7 | 0.14 | 9162 | 1262.7 | 0.10 | 828 | 83.7 | 0.24 | 444 | 105.3 | |||
| Total | 4571 | 1705.9 | 5713 | 1443.5 | 22 127 | 3421.8 | 2270 | 259.1 | 1803 | 491.3 | |||||||||
| % | 37.3 | 25.3 | 15.5 | 11.4 | 27.3 | ||||||||||||||
| Women | |||||||||||||||||||
| 15–24 | 25–34 | 0.23 | 50 | 11.4 | 0.16 | 4 | 0.6 | 0.10 | 136 | 13.0 | 0.07 | 12.11 | 0.9 | 0.17 | 2 | 0.3 | 0.08 | 715.1 | 60.7 |
| 25–34 | 35–44 | 0.18 | 131 | 23.2 | 0.12 | 27 | 3.3 | 0.07 | 402 | 29.9 | 0.05 | 29.48 | 1.6 | 0.13 | 12 | 1.5 | 0.07 | 3857 | 254.0 |
| 35–49 | 45–59 | 0.18 | 622 | 113.5 | 0.12 | 303 | 37.9 | 0.08 | 2292 | 174.8 | 0.06 | 142.8 | 8.0 | 0.13 | 99 | 13.1 | 0.07 | 14 628 | 987.4 |
| 50–64 | 60–74 | 0.17 | 855 | 146.3 | 0.12 | 922 | 108.5 | 0.07 | 6116 | 440.7 | 0.05 | 453 | 23.9 | 0.12 | 168 | 20.9 | 0.06 | 17 194 | 1096.9 |
| ⩾65 | ⩾75 | 0.16 | 666 | 105.2 | 0.11 | 1560 | 166.8 | 0.06 | 8810 | 568.8 | 0.05 | 642.4 | 30.2 | 0.11 | 101 | 11.4 | 0.06 | 11 952 | 681.3 |
| Total | 2359 | 399.7 | 2819 | 317.2 | 17 787 | 1227.3 | 1298 | 64.6 | 386 | 47.3 | 48 385 | 3080.3 | |||||||
| % | 16.9 | 11.3 | 6.9 | 5.0 | 12.2 | 6.4 | |||||||||||||
| Persons | |||||||||||||||||||
| 15–24 | 25–34 | 105 | 31.1 | 15 | 3.4 | 269 | 33.8 | 31 | 3.0 | 4 | 0.9 | 715 | 60.7 | ||||||
| 25–34 | 35–44 | 375 | 119.3 | 113 | 27.3 | 799 | 99.1 | 72 | 7.1 | 47 | 11.8 | 3857 | 254.0 | ||||||
| 35–49 | 45–59 | 2213 | 745.4 | 1273 | 312.8 | 5213 | 695.9 | 494 | 54.3 | 506 | 134.4 | 14 628 | 987.4 | ||||||
| 50–64 | 60–74 | 2743 | 855.5 | 3457 | 776.7 | 15 597 | 1988.8 | 1464 | 145.4 | 1082 | 274.8 | 17 194 | 1096.9 | ||||||
| ⩾65 | ⩾75 | 1434 | 354.3 | 3668 | 640.5 | 17 972 | 1831.5 | 1470 | 113.9 | 545 | 116.7 | 11 952 | 681.3 | ||||||
| Total | 6930 | 2105.6 | 8532 | 1761 | 39 914 | 4649 | 3568 | 324 | 2189 | 539 | 48 385 | 3080 | |||||||
| % | 30.4 | 20.6 | 11.6 | 9.1 | 24.6 | 6.4 | |||||||||||||
Abbreviations: attrib.=attributable; Obs.=observed cases; PAF=population-attributable fraction.
Because of the high risk of upper aero-digestive tract cancer associated with alcohol drinking, cancers of the mouth and pharynx, as well as larynx, had the highest percentages of alcohol-attributable cases (30.4% of cancers of the oral cavity and pharynx, 24.6% of laryngeal cancers). Although the fractions of colorectal (11.6%) and breast (6.4%) cancers were much lower, the actual numbers of alcohol-attributable cases were much greater – together, they account for about 7700 alcohol-attributable cases in 2010 (or 62% of all alcohol-related cancers).
Table 4 sums the excess numbers of cases at the six sites, caused by alcohol consumption, and expresses these numbers as a fraction of the total burden of (incident) cancer. The estimates are 4.6% cancers in men and 3.3% in women due to alcohol consumption, or 4.0% cancers overall.
Table 4. Estimated total numbers of cancers in the UK in 2010, PAFs due to alcohol consumption 10 years earlier (2000–2001), and the corresponding number and percentage of excess cases, by age group and sex.
|
Age (years)
|
All cancersa
|
|||
|---|---|---|---|---|
| Exposure | Outcome (+10 years) | Observed cases | Excess attributable cases | PAF (%) |
| Men | ||||
| 15–24 | 25–34 | 2109 | 46 | 2.2 |
| 25–34 | 35–44 | 4124 | 205 | 5.0 |
| 35–49 | 45–59 | 22 388 | 1596 | 7.1 |
| 50–64 | 60–74 | 68 043 | 3301 | 4.9 |
| ⩾65 | 75+ | 60 149 | 2175 | 3.6 |
| Total | 158 667 | 7322 | 4.6 | |
| Women | ||||
| 15–24 | 25–34 | 3284.1 | 87 | 2.6 |
| 25–34 | 35–44 | 8619.2 | 313 | 3.6 |
| 35–49 | 45–59 | 31 631 | 1335 | 4.2 |
| 50–64 | 60–74 | 54 966 | 1837 | 3.3 |
| ⩾65 | 75+ | 55 437 | 1564 | 2.8 |
| Total | 155 584 | 5136 | 3.3 | |
| Persons | ||||
| 15–24 | 25–34 | 5393 | 133 | 2.5 |
| 25–34 | 35–44 | 12 743 | 519 | 4.1 |
| 35–49 | 45–59 | 54 019 | 2930 | 5.4 |
| 50–64 | 60–74 | 123 009 | 5138 | 4.2 |
| ⩾65 | 75+ | 115 586 | 3738 | 3.2 |
| Total | 314 251 | 12 458 | 4.0 | |
Abbreviations: PAF=population-attributable fraction.
Excluding non-melanoma skin cancer.
Discussion
The estimates of the RR of alcohol consumption for various cancers are an ‘average’ taken from widely cited meta-analyses; more extreme values can be found in specific studies.
Table 5 compares the excess RRs of 1 g of alcohol consumption per day as used in this study with those from the Million Women Study (Allen et al, 2009) and the EPIC study (Ferrari et al, 2007; Tjonneland et al, 2007), as well as with those derived from various meta-analyses by WCRF (2007). The values for cohort studies are shown for cancers of the breast, colon, rectum and liver. For upper aero-digestive and oesophageal cancers, meta-analyses were based on case–control studies only.
Table 5. Estimates of excess relative risk associated with 1 gram alcohol intake per day.

For the most part, the risks associated with consumption of alcohol used in the present study are similar to those in the three comparative studies listed in Table 5. The ERRs reported in the Million Women Study (Allen et al, 2009) are rather higher than those in Table 1 for cancers of the oesophagus, liver and larynx, although the values used in the current analysis (Table 1) lie within the relevant 95% confidence intervals; for colon cancer, however, the value is considerably lower.
With respect to cancer of the oesophagus, some of the differences may relate to the differing proportions of squamous cell and adenocarcinomas in the series of cancers in various studies. Although squamous cell carcinomas are clearly related to alcohol exposure, the risk of adenocarcinoma is much lower, or nil (Lagergren et al, 2000; Wu et al, 2001; Lindblad et al, 2005; Pandeya et al, 2009). Currently, adenocarcinomas comprise approximately 70% of oesophageal cancers in men in the UK, and 40% in women (see section 8, in Cancers attributable to overweight and obesity). However, the studies currently used to estimate the RR of oesophageal cancer in relation to alcohol do not distinguish between the histological subtypes, and no correction to the estimate for the UK has been made on this basis.
We chose to use the estimates of alcohol consumption in the UK based on population survey data (the National Diet and Nutrition Survey). However, it is well known that surveys produce figures far lower than would be expected from alcohol sales. Alcohol sales are estimated based on clearance data produced by HM Revenue and Customs (HMRC). Not all alcohol that is cleared is actually consumed; for example, it is conceivable that some of it may be thrown away when it passes its best-before date. Conversely, not all alcohol that is consumed in the UK is cleared by HMRC; for example, home brew and illegally imported alcohol.
Table 6 compares consumption as estimated by the General Household Survey (Goddard, 2006) and from clearance data produced by HM Revenue and Customs (HMRC, 2008). The large difference between the two sets of data is unlikely to be due to large amounts of purchased alcohol not being consumed. Both the General Household Survey and the Government's alcohol strategy (HMG, 2007) believe that many people underestimate the amount of alcohol they drink. However, as estimates of risk are generally based on responses to questionnaires, they are likely to overestimate the risk in relation to actual alcohol consumption. It is more appropriate, therefore, to use estimates of alcohol intake from (self-reported) survey data than the more accurate clearance data.
Table 6. UK alcohol consumption per adult.
|
General Household
Surveya
|
HM Revenue and
Customsb
|
|||
|---|---|---|---|---|
| Year | Units per week | Litres of pure alcohol per year | Units per week | Litres of pure alcohol per year |
| 1990 | 10.8 | 5.3 | 19.2 | 10 |
| 2000 | 12.0 | 6.2 | 20.2 | 10.5 |
| 2005 | 10.8 | 5.6 | 21.9 | 11.4 |
General Household Survey (Goddard, 2006).
HM Revenue and Customs (HMRC, 2008).
The current estimate (3.6% of new cancers in 2010 related to alcohol) is similar to the figure published by Doll and Peto (2003) – that around 6% of UK cancer deaths could be avoided if people did not drink. The estimation is based on the attribution to alcohol of 2/3 deaths from alcohol-related cancers (mouth, pharynx, larynx, oesophagus) in men and 1/3 in women, plus ‘a small proportion’ of liver cancer deaths. A recent publication, based on the risks of alcohol consumption observed in the EPIC study, estimates a rather higher fraction of cancers attributable to alcohol in the UK – especially in men: 8% of cancer in men and 3% in women (Schütze et al, 2011). The difference appears to be mainly because of the rather higher level and prevalence of alcohol consumption that were used to estimate attributable fractions (an average intake of 35.2 g per day in men and 17.6 g per day in women, cf. Table 2). These were calculated from data available on the World Health Organisation website, which appear to be derived from clearance data, with levels of consumption equivalent to those in Table 6 (on average, annually 13.4 l of alcohol per capita in 2003–5). As noted above, it would seem more appropriate to use self-reported consumption, even though this is an underestimate of the true situation, as the RR estimates in EPIC (as in other cohort studies) are also based on questionnaire data.
See acknowledgements on page Si.
Footnotes
The author declares no conflict of interest.
References
- Allen NE, Beral V, Casabonne D, Kan SW, Reeves GK, Brown A, Green J (2009) Moderate alcohol intake and cancer incidence in women. J Natl Cancer Inst 101: 296–305 [DOI] [PubMed] [Google Scholar]
- Baan R, Straif K, Grosse Y, Secretan B, El Ghissassi F, Bouvard V, Altieri A, Cogliano V (2007) Carcinogenicity of alcoholic beverages. Lancet Oncol 8: 292–293 [DOI] [PubMed] [Google Scholar]
- Cho E, Smith-Warner SA, Ritz J, van den Brandt PA, Colditz GA, Folsom AR, Freudenheim JL, Giovannucci E, Goldbohm RA, Graham S, Holmberg L, Kim DH, Malila N, Miller AB, Pietinen P, Rohan TE, Sellers TA, Speizer FE, Willett WC, Wolk A, Hunter DJ (2004) Alcohol intake and colorectal cancer: a pooled analysis of 8 cohort studies. Ann Intern Med 140: 603–613 [DOI] [PubMed] [Google Scholar]
- Corrao G, Bagnardi V, Zambon A, La Vecchia C (2004) A meta-analysis of alcohol consumption and the risk of 15 diseases. Prev Med 38: 613–619 [DOI] [PubMed] [Google Scholar]
- Doll R, Peto R (2003) Epidemiology of Cancer. In Oxford Textbook of Medicine, Warrell DA, Cox TM, Firth JD, Benz Jr EJ (eds), 4th edn. Oxford University Press: Oxford, UK [Google Scholar]
- Ferrari P, Jenab M, Norat T, Moskal A, Slimani N, Olsen A, Tjønneland A, Overvad K, Jensen MK, Boutron-Ruault MC, Clavel-Chapelon F, Morois S, Rohrmann S, Linseisen J, Boeing H, Bergmann M, Kontopoulou D, Trichopoulou A, Kassapa C, Masala G, Krogh V, Vineis P, Panico S, Tumino R, van Gils CH, Peeters P, Bueno-de-Mesquita HB, Ocké MC, Skeie G, Lund E, Agudo A, Ardanaz E, López DC, Sanchez MJ, Quirós JR, Amiano P, Berglund G, Manjer J, Palmqvist R, Van Guelpen B, Allen N, Key T, Bingham S, Mazuir M, Boffetta P, Kaaks R, Riboli E (2007) Lifetime and baseline alcohol intake and risk of colon and rectal cancers in the European Prospective Investigation into Cancer and Nutrition (EPIC). Int J Cancer 121: 2065–2072 [DOI] [PubMed] [Google Scholar]
- Goddard E (2006) General Household Survey, 2006. Smoking and Drinking Among Adults, 2006. Office of National Statistics, 2006: London. http://www.parliament.uk/deposits/depositedpapers/2008/DEP2008-2395.pdf [Google Scholar]
- Hamajima N, Hirose K, Tajima K, Rohan T, Calle EE, Heath Jr CW, Coates RJ, Liff JM, Talamini R, Chantarakul N, Koetsawang S, Rachawat D, Morabia A, Schuman L, Stewart W, Szklo M, Bain C, Schofield F, Siskind V, Band P, Coldman AJ, Gallagher RP, Hislop TG, Yang P, Kolonel LM, Nomura AM, Hu J, Johnson KC, Mao Y, De Sanjosé S, Lee N, Marchbanks P, Ory HW, Peterson HB, Wilson HG, Wingo PA, Ebeling K, Kunde D, Nishan P, Hopper JL, Colditz G, Gajalanski V, Martin N, Pardthaisong T, Silpisornkosol S, Theetranont C, Boosiri B, Chutivongse S, Jimakorn P, Virutamasen P, Wongsrichanalai C, Ewertz M, Adami HO, Bergkvist L, Magnusson C, Persson I, Chang-Claude J, Paul C, Skegg DC, Spears GF, Boyle P, Evstifeeva T, Daling JR, Hutchinson WB, Malone K, Noonan EA, Stanford JL, Thomas DB, Weiss NS, White E, Andrieu N, Brêmond A, Clavel F, Gairard B, Lansac J, Piana L, Renaud R, Izquierdo A, Viladiu P, Cuevas HR, Ontiveros P, Palet A, Salazar SB, Aristizabel N, Cuadros A, Tryggvadottir L, Tulinius H, Bachelot A, Lê MG, Peto J, Franceschi S, Lubin F, Modan B, Ron E, Wax Y, Friedman GD, Hiatt RA, Levi F, Bishop T, Kosmelj K, Primic-Zakelj M, Ravnihar B, Stare J, Beeson WL, Fraser G, Bullbrook RD, Cuzick J, Duffy SW, Fentiman IS, Hayward JL, Wang DY, McMichael AJ, McPherson K, Hanson RL, Leske MC, Mahoney MC, Nasca PC, Varma AO, Weinstein AL, Moller TR, Olsson H, Ranstam J, Goldbohm RA, van den Brandt PA, Apelo RA, Baens J, de la Cruz JR, Javier B, Lacaya LB, Ngelangel CA, La Vecchia C, Negri E, Marubini E, Ferraroni M, Gerber M, Richardson S, Segala C, Gatei D, Kenya P, Kungu A, Mati JG, Brinton LA, Hoover R, Schairer C, Spirtas R, Lee HP, Rookus MA, van Leeuwen FE, Schoenberg JA, McCredie M, Gammon MD, Clarke EA, Jones L, Neil A, Vessey M, Yeates D, Appleby P, Banks E, Beral V, Bull D, Crossley B, Goodill A, Green J, Hermon C, Key T, Langston N, Lewis C, Reeves G, Collins R, Doll R, Peto R, Mabuchi K, Preston D, Hannaford P, Kay C, Rosero-Bixby L, Gao YT, Jin F, Yuan JM, Wei HY, Yun T, Zhiheng C, Berry G, Cooper Booth J, Jelihovsky T, MacLennan R, Shearman R, Wang QS, Baines CJ, Miller AB, Wall C, Lund E, Stalsberg H, Shu XO, Zheng W, Katsouyanni K, Trichopoulou A, Trichopoulos D, Dabancens A, Martinez L, Molina R, Salas O, Alexander FE, Anderson K, Folsom AR, Hulka BS, Bernstein L, Enger S, Haile RW, Paganini-Hill A, Pike MC, Ross RK, Ursin G, Yu MC, Longnecker MP, Newcomb P, Bergkvist L, Kalache A, Farley TM, Holck S, Meirik O, Collaborative Group on Hormonal Factors in Breast Cancer (2002) Alcohol, tobacco and breast cancer - collaborative reanalysis of individual data from 53 epidemiological studies, including 58,515 women with breast cancer and 95,067 women without the disease. Br J Cancer 87: 1234–1245 [DOI] [PMC free article] [PubMed] [Google Scholar]
- Henderson L, Gregory J, Irving K, Swan G (2003) The National Diet & Nutrition Survey: Adults Aged 19 to 64 Years. Vol. 2. Energy, Protein, Carbohydrate, Fat and Alcohol Intake. HMSO: London. http://www.food.gov.uk/science/dietarysurveys/ndnsdocuments/ndnsprevioussurveyreports/ndnsv2 [Google Scholar]
- HM Government (HMG) (2007) Safe. Sensible. Social. The next steps in the National Alcohol Strategy
- HM Revenue and Customs (HMRC) (2008) Alcohol fact sheet, http://www.uktradeinfo.com/index.cfm?task=factalcohol
- IARC Monographs on the Evaluation of Carcinogenic Risks to Humans (1988) Alcohol Drinking, Vol. 44, IARC: Lyon [Google Scholar]
- Lagergren J, Bergstrom R, Lindgren A, Nyrén O (2000) The role of tobacco, snuff and alcohol use in the aetiology of cancer of the oesophagus and gastric cardia. Int J Cancer 85: 340–346 [PubMed] [Google Scholar]
- Lindblad M, Rodriguez LA, Lagergren J (2005) Body mass, tobacco and alcohol and risk of esophageal, gastric cardia, and gastric non-cardia adenocarcinoma among men and women in a nested case-control study. Cancer Causes Control 16: 285–294 [DOI] [PubMed] [Google Scholar]
- Moskal A, Norat T, Ferrari P, Riboli E (2007) Alcohol intake and colorectal cancer risk: a dose-response meta-analysis of published cohort studies. Int J Cancer 120: 664–671 [DOI] [PubMed] [Google Scholar]
- Pandeya N, Williams G, Green AC, Webb PM, Whiteman DC (2009) Australian Cancer Study. Alcohol consumption and the risks of adenocarcinoma and squamous cell carcinoma of the esophagus. Gastroenterology 136: 1215–1224 [DOI] [PubMed] [Google Scholar]
- Schütze M, Boeing H, Pischon T, Rehm J, Kehoe T, Gmel G, Olsen A, Tjønneland AM, Dahm CC, Overvad K, Clavel-Chapelon F, Boutron-Ruault MC, Trichopoulou A, Benetou V, Zylis D, Kaaks R, Rohrmann S, Palli D, Berrino F, Tumino R, Vineis P, Rodríguez L, Agudo A, Sánchez MJ, Dorronsoro M, Chirlaque MD, Barricarte A, Peeters PH, van Gils CH, Khaw KT, Wareham N, Allen NE, Key TJ, Boffetta P, Slimani N, Jenab M, Romaguera D, Wark PA, Riboli E, Bergmann MM (2011) Alcohol attributable burden of incidence of cancer in eight European countries based on results from prospective cohort study. Br Med J 342: d1584. [DOI] [PMC free article] [PubMed] [Google Scholar]
- Secretan B, Straif K, Baan R, Grosse Y, El Ghissassi F, Bouvard V, Benbrahim-Tallaa L, Guha N, Freeman C, Galichet L, Cogliano V (2009) A review of human carcinogens – part E: tobacco, areca nut, alcohol, coal smoke, and salted fish. Lancet Oncol 10: 1033–1034 [DOI] [PubMed] [Google Scholar]
- Smith-Warner SA, Spiegelman D, Yaun S-S, Adami HO, van den Brandt PA, Folsom AR, Goldbohm RA, Graham S, Howe GR, Marshall JR, Miller AB, Potter JD, Speizer FE, Willett WC, Wolk A, Hunter DJ (1998) Alcohol and breast cancer in women: a pooled analysis of cohort studies. J Am Med Assoc 279: 535–540 [DOI] [PubMed] [Google Scholar]
- Tjonneland A, Christensen J, Olsen A, Stripp C, Thomsen BL, Overvad K, Peeters PH, van Gils CH, Bueno-de-Mesquita HB, Ocké MC, Thiebaut A, Fournier A, Clavel-Chapelon F, Berrino F, Palli D, Tumino R, Panico S, Vineis P, Agudo A, Ardanaz E, Martinez-Garcia C, Amiano P, Navarro C, Quirós JR, Key TJ, Reeves G, Khaw KT, Bingham S, Trichopoulou A, Trichopoulos D, Naska A, Nagel G, Chang-Claude J, Boeing H, Lahmann PH, Manjer J, Wirfält E, Hallmans G, Johansson I, Lund E, Skeie G, Hjartåker A, Ferrari P, Slimani N, Kaaks R, Riboli E (2007) Alcohol intake and breast cancer risk: the European Prospective Investigation into Cancer and Nutrition (EPIC). Cancer Causes Control 18: 361–373 [DOI] [PubMed] [Google Scholar]
- World Cancer Research Fund (WCRF) Panel (2007) Food, Nutrition, Physical Activity, and the Prevention of Cancer: A Global Perspective. World Cancer Research Fund: Washington, DC [Google Scholar]
- Wu AH, Wan P, Bernstein L (2001) A multiethnic population-based study of smoking, alcohol and body size and risk of adenocarcinomas of the stomach and esophagus (United States). Cancer Causes Control 12: 721–732 [DOI] [PubMed] [Google Scholar]