

In 2004, the International Agency for Research on Cancer (IARC) judged that there was sufficient evidence in humans that tobacco smoking causes cancers of the lung, larynx, oral cavity and pharynx, paranasal sinuses, oesophagus, stomach, pancreas, liver, kidney, ureter, bladder, uterine cervix and bone marrow (myeloid leukaemia; IARC, 2004). At a recent expert review (to be published as IARC Monograph 100E), the list of cancers for which the evidence for tobacco smoking being causative was considered to be ‘sufficient’ was updated to include cancers of the colon and rectum, and mucinous tumours of the ovary (Secretan et al, 2009).
In the 2004 evaluation, the IARC judged that there was sufficient evidence that involuntary smoking – that is, exposure to second-hand or ‘environmental’ tobacco smoke (ETS) – causes lung cancer in humans (IARC, 2004). In this monograph, the results of meta-analyses were reported, showing a statistically significant and consistent association between lung cancer risk in spouses of smokers and exposure to second-hand tobacco smoke from the spouse who smokes. The relative risk was 1.24 in women and 1.37 in men after controlling for some potential sources of bias and confounding. The excess risk increases with increasing exposure. For lung cancer in never smokers exposed to ETS at the workplace, the relative risks were 1.19 in women and 1.12 in men. For children exposed to smoke from their parents smoking, the evidence for an increased risk of lung cancer was less consistent.
The reported increases in risk of lung cancer from ETS exposure pertain to non-smokers (indeed, usually to persons who have never smoked). It would be impossible to directly quantify the tiny increment in risk that a smoker might suffer from exposure to another person's smoke (as well as his own). Thus, calculation of attributable fractions will be undertaken only for lung cancer cases in never smokers. This makes sense in that the ultimate aim is to estimate how much cancer is caused by smoking, and this comprises the cases caused by direct smoking and those caused by involuntary smoking in never smokers. Even if a theoretical estimate of the total effect of other persons' smoking was made (including the incremental risk to current and past smokers), this latter component would have to be deducted from the total tobacco-attributable fraction, as involuntary smoking cannot occur without active smoking by others.
Tobacco smoking
Methods
The numbers and percentage of cancers caused by tobacco smoking are estimated using the method developed by Peto et al (1992). This is based on the assumption that tobacco smoking is overwhelmingly the most important cause of lung cancer, and that the incidence of this disease in the absence of smoking would be more or less the same in all populations, so that contemporary incidence (or mortality) rates from lung cancer simply reflect the cumulative exposure of a particular population to tobacco smoking. A set of data is required for the calculation, comprising, from the same population, incidence rates of lung cancer in persons who have never smoked and relative risks of different cancers in smokers relative to never smokers. Similar to Peto et al (1992), we use the data from the follow-up during 1982–1988 of the American Cancer Society's second ‘Cancer Prevention Study’ (CPS II; Thun et al, 1997), the largest cohort study carried out until now, involving more than a million volunteers aged ⩾30 years at the time of enrolment in 1982 (Garfinkel, 1980; Burns et al, 1997). Lung cancer incidence in never smokers has been estimated from the death rates in the CPS II study, for a slightly longer period of follow-up (1982–2002; Thun et al, 2006; Figure 1).
Figure 1.

Age-specific incidence rates of lung cancer in the lifelong never smokers (CPS-II) in the US.
The relative risks of death from different cancers during the follow-up period (1984–1988); and the sources are shown in Table 1. Most values listed here were those published in Ezzati et al (2005). For cancers of the colon and rectum, the values were those from the follow-up of the CPS II Nutrition Cohort to June 2005 (Hannan et al, 2009), in which the multivariate hazard ratios in current smokers were 1.24 in men and 1.30 in women. No data for the risk of mucinous carcinomas of the ovary in smokers have been published based on the CPS II cohort; the value used (2.1) was that from a meta-analysis published by Jordan et al (2006).
Table 1. Estimated relative risks (RR) for current smokers aged ⩾35 compared with never-smokers.
| Cancer | Male | Female |
|---|---|---|
| Lunga | 21.3 | 12.5 |
| Oral cavity and pharynxb | 10.9 | 5.1 |
| Oesophagusb | 6.8 | 7.8 |
| Stomacha | 2.2 | 1.5 |
| Livera | 2.3 | 1.5 |
| Pancreasa | 2.2 | 2.2 |
| Colon–rectumc | 1.24 | 1.30 |
| Larynxb | 14.6 | 13.0 |
| Cervixa | — | 1.5 |
| Ovary (mucinous)d | — | 2.1 |
| Urinary bladdera | 3.0 | 2.4 |
| Kidney and renal pelvisa | 2.5 | 1.5 |
| Acute myeloid leukaemiaa | 1.9 | 1.2 |
The first step is to calculate the number of lung cancer cases expected in the UK in the absence of smoking, by applying the age- and sex-specific never-smoker rates (in Figure 1) to the population of the UK in 2010. The number of cases attributable to smoking (and the attributable fraction) is then derived by subtracting the expected cases from the number actually observed in 2010. The results are shown in Table 2.
Table 2. Cases of lung cancer attributable to smoking, by sex and age group (UK, 2010).
| Age group (years) | Population (thousands) | Rates observed | Cases observed | Rates expected a | Cases expected a | Excess attributable cases | PAF (%) |
|---|---|---|---|---|---|---|---|
| Males | |||||||
| 0–14 | 5548 | 0.0 | 1 | 0.0 | 0 | 1 | 0 |
| 15–34 | 8365 | 0.5 | 38 | 0.5 | 38 | 0 | 0 |
| 35–44 | 4387 | 4.9 | 215 | 2.9 | 128 | 87 | 40 |
| 45–54 | 4202 | 27.1 | 1138 | 6.0 | 252 | 886 | 78 |
| 55–64 | 3580 | 116.9 | 4184 | 14.3 | 513 | 3705 | 89 |
| ⩾65 | 4526 | 368.9 | 16 697 | 51.5 | 2331 | 14 366 | 86 |
| Total | 30 609 | 72.8 | 22 273 | — | 3262 | 19 011 | 85 |
| Females | |||||||
| 0–14 | 5292 | 0.0 | 2 | 0.0 | 0 | 2 | 0 |
| 15–34 | 8048 | 0.4 | 42 | 0.5 | 42 | 0 | 0 |
| 35–44 | 4452 | 4.5 | 224 | 3.8 | 168 | 56 | 25 |
| 45–54 | 4331 | 26.7 | 1088 | 7.4 | 320 | 768 | 71 |
| 55–64 | 3731 | 85.3 | 3441 | 14.9 | 556 | 2885 | 84 |
| ⩾65 | 5759 | 218.0 | 13 335 | 42.9 | 2471 | 10 864 | 81 |
| Total | 31 614 | 53.1 | 18 132 | — | 3557 | 14 575 | 80 |
Abbreviations: PAF=population-attributable fraction.
Expected in a population that had never smoked.
For the other cancers, the rates in non-smokers are not known, and thus the usual formula for calculating the population attributable fraction (PAF) is used:
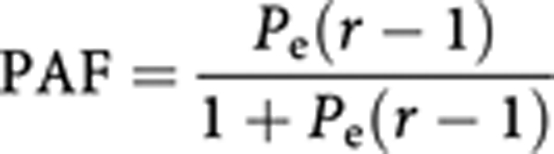 |
where Pe is the prevalence of exposure and r is the relative risk in smokers.
Using the attributable fractions of lung cancer, already estimated (Table 2) by age group and sex, and the relative risks for lung cancer in smokers from the American cohort (Table 1), the above formula enables calculation of Pe for each age/sex group. This may be thought of as the ‘notional’ prevalence of smoking (ever vs never) in the UK population – more specifically, the prevalence that would have been necessary in the UK population to produce the observed incidence rates if the relative risks of the CPS II study had pertained.
Finally, we use the same formula, the values of prevalence (Pe) and the relative risks for the other cancers (Table 1) to estimate their PAF and, consequently, the numbers of cases attributable to smoking.
‘Notional prevalence’ (Pe) is an artificial concept that may be quite different from the true prevalence, depending on how different the past experience of tobacco smoking in the population under study was from that in the volunteers of the CPS II study. It can, in fact, even be >1 if a particular age/sex/population cohort has a higher prevalence of smoking and/or a higher relative risk of lung cancer than the CPS II subjects.
Results
For lung cancer (Table 2), the results suggest that about 85% of the lung cancer cases in men are attributable to smoking, and in women the percentage is 80%.
Table 3 shows the estimated numbers of cancer cases at sites other than the lung, and the fractions due to tobacco smoking. (No estimate is made for cancers of the paranasal sinuses, owing to the lack of relevant data on the risk of tobacco smoking; the number of cases concerned would be very few: the total number of cases registered in England in 2008 was 125.)
Table 3. Other cancers: cases attributable to smoking in 2010.
|
Cases attributable
to smoking for specific cancers
|
||||||||||||||||||||||||||||||||||||
|---|---|---|---|---|---|---|---|---|---|---|---|---|---|---|---|---|---|---|---|---|---|---|---|---|---|---|---|---|---|---|---|---|---|---|---|---|
|
Oral cavity and
pharynx
|
Oesophagus
|
Stomach
|
Liver
|
Pancreas
|
Colon–rectum
|
Larynx
|
Cervix
|
Ovary
|
Bladder
|
Kidney and
ureter
|
Myeloid
leukaemia
|
|||||||||||||||||||||||||
| Age (years) | Obs. | Exp. | PAF (%) | Obs. | Exp. | PAF (%) | Obs. | Exp. | PAF (%) | Obs. | Exp. | PAF (%) | Obs. | Exp. | PAF (%) | Obs. | Exp. | PAF (%) | Obs. | Exp. | PAF (%) | Obs. | Exp. | PAF (%) | Obs. | Exp. | PAF (%) | Obs. | Exp. | PAF (%) | Obs. | Exp. | PAF (%) | Obs. | Exp. | PAF (%) |
| Males | ||||||||||||||||||||||||||||||||||||
| 0–14 | 5 | 5 | 0 | 0 | 0 | 0 | 0 | 0 | 0 | 15 | 15 | 0 | 0 | 0 | 0 | 1 | 1 | 0 | 0 | 0 | 0 | — | — | — | — | — | — | 1 | 1 | 0 | 54 | 54 | 0 | 41 | 41 | 0 |
| 15–34 | 77 | 77 | 0 | 12 | 12 | 0 | 14 | 14 | 0 | 23 | 23 | 0 | 9 | 9 | 0 | 163 | 163 | 0 | 2 | 2 | 0 | — | — | — | — | — | — | 8 | 8 | 0 | 37 | 37 | 0 | 97 | 97 | 0 |
| 35–44 | 244 | 183 | 25 | 86 | 72 | 16 | 82 | 79 | 4 | 43 | 41 | 4 | 67 | 64 | 4 | 397 | 394 | 1 | 35 | 24 | 31 | — | — | — | — | — | — | 58 | 54 | 6 | 206 | 196 | 5 | 89 | 86 | 3 |
| 45–54 | 902 | 332 | 63 | 469 | 234 | 50 | 251 | 208 | 17 | 166 | 136 | 18 | 278 | 230 | 17 | 1436 | 1379 | 4 | 195 | 58 | 70 | — | — | — | — | — | — | 235 | 175 | 26 | 612 | 486 | 21 | 150 | 130 | 13 |
| 55–64 | 1458 | 325 | 78 | 1308 | 430 | 67 | 677 | 476 | 30 | 493 | 338 | 31 | 818 | 575 | 30 | 4129 | 3807 | 8 | 535 | 92 | 83 | — | — | — | — | — | — | 961 | 564 | 41 | 1295 | 847 | 35 | 348 | 264 | 24 |
| ⩾65 | 1887 | 471 | 75 | 3836 | 1389 | 64 | 3443 | 2524 | 27 | 1530 | 1097 | 28 | 2910 | 2133 | 27 | 15 999 | 14 912 | 7 | 1035 | 202 | 81 | — | — | — | — | — | — | 5448 | 3390 | 38 | 3493 | 2400 | 31 | 1321 | 1038 | 21 |
| Total | 4573 | 1393 | 70 | 5711 | 2137 | 63 | 4467 | 3300 | 26 | 2270 | 1650 | 27 | 4082 | 3011 | 26 | 22 125 | 20 656 | 7 | 1802 | 378 | 79 | — | — | — | — | — | — | 6711 | 4191 | 38 | 5697 | 4020 | 29 | 2046 | 1656 | 19 |
| Females | ||||||||||||||||||||||||||||||||||||
| 0–14 | 6 | 6 | 0 | 0 | 0 | 0 | 0 | 0 | 0 | 18 | 18 | 0 | 0 | 0 | 0 | 2 | 2 | 0 | 0 | 0 | 0 | 0 | 0 | 0 | 12 | 12 | 0 | 1 | 1 | 0 | 57 | 57 | 0 | 43 | 43 | 0 |
| 15–34 | 75 | 75 | 0 | 5 | 5 | 0 | 29 | 29 | 0 | 12 | 12 | 0 | 12 | 12 | 0 | 164 | 164 | 0 | 2 | 2 | 0 | 739 | 739 | 0 | 273 | 273 | 0 | 6 | 6 | 0 | 37 | 37 | 0 | 86 | 86 | 0 |
| 35–44 | 131 | 117 | 11 | 27 | 23 | 16 | 64 | 63 | 1 | 29 | 29 | 1 | 53 | 51 | 3 | 402 | 399 | 1 | 12 | 9 | 26 | 679 | 669 | 1 | 438 | 435 | 1 | 31 | 30 | 4 | 110 | 108 | 1 | 90 | 89 | 1 |
| 45–54 | 354 | 191 | 46 | 147 | 61 | 59 | 129 | 117 | 9 | 70 | 64 | 9 | 221 | 177 | 20 | 1230 | 1158 | 6 | 53 | 15 | 71 | 411 | 372 | 9 | 926 | 901 | 3 | 104 | 80 | 23 | 298 | 270 | 9 | 142 | 136 | 4 |
| 55–64 | 593 | 208 | 65 | 398 | 98 | 75 | 287 | 234 | 18 | 199 | 163 | 18 | 633 | 411 | 35 | 2755 | 2427 | 12 | 105 | 16 | 84 | 317 | 259 | 18 | 1506 | 1451 | 4 | 303 | 186 | 39 | 639 | 521 | 18 | 210 | 193 | 8 |
| ⩾65 | 1196 | 466 | 61 | 2240 | 622 | 72 | 2067 | 1735 | 16 | 969 | 813 | 16 | 3361 | 2304 | 31 | 13 233 | 11 871 | 10 | 210 | 38 | 82 | 547 | 459 | 16 | 3665 | 3571 | 3 | 2126 | 1385 | 35 | 2223 | 1866 | 16 | 1025 | 952 | 7 |
| Total | 2355 | 1063 | 55 | 2817 | 808 | 71 | 2576 | 2178 | 15 | 1298 | 1099 | 15 | 4280 | 2955 | 31 | 17 786 | 16 020 | 10 | 382 | 80 | 79 | 2693 | 2498 | 7 | 6820 | 6643 | 3 | 2571 | 1688 | 34 | 3364 | 2860 | 15 | 1596 | 1500 | 6 |
Abbreviations: Exp.=cases expected; Obs.=cases observed; PAF (%)=population-attributable fraction.
Taking these figures together, we can estimate that, in total, 36 102 (22.8% of the total) cancers in men and 23 722 (15.2% of the total) in women are attributable to smoking tobacco (currently, or in the past).
Discussion
The method of estimation developed by Peto et al (1992, 2000) is based on the assumption that the excess mortality (or incidence) from lung cancer, above that which would have been observed in persons who have never smoked, is the result of smoking (past and current). Thus, the attributable fraction of lung cancer can be estimated as
and used to estimate the attributable fractions of other cancers. It should be noted that it is of no consequence that the data set used for estimates of PAF in 2010 is derived from study results pertaining to the period 1984–1988, so long as the two components (mortality/incidence of lung cancer in non-smokers, and relative risks of different cancers in smokers vs never-smokers) derive from the same population. On the other hand, it is important that the non-smoker rates observed in the US volunteers in 1984–1988 are appropriate to the UK population in 2010. The only large cohort study in the UK was for British Doctors – almost all of them being men. The US CPS II non-smoker rates predicted 19.03 lung cancer deaths in 40 years of follow-up, vs 19 actually observed (Peto et al, 2000), confirming that non-smoker rates in the UK are likely to be very similar to those in the US CPS II cohort.
The main advantage of the Peto method is that it does not require detailed information of the current relative risks of different cancers in relation to smoking history in the UK population. The risk of tobacco smoking depends on cumulative exposure to carcinogens in tobacco smoke, and therefore varies with the amount smoked, duration of smoking and time since cessation (in ex-smokers), as well as with the type of cigarette smoked. Factors such as these differ between countries, and over time, and thus one cannot be sure that relative risks taken from studies in different populations (geographic or temporal) would be appropriate for the UK in 2010. In the USA, the relative risk of lung cancer in current smokers (relative to never smokers) was 11.5 in men and 2.7 in women in the Cancer Prevention Study I (CPS I) conducted by the American Cancer Society during 1959–1965, whereas it was 23.3 in men and 12.7 in women in CPS II (US Department of Health and Human Services, 2004). In the British Doctors study, the relative risk in current smokers rose from 15.5 during 1951–1971 to 18.5 during 1971–1991 (Doll et al, 1994). In fact, one might have expected the switch to cigarettes delivering low tar to have reduced the hazard of lung cancer, but this effect is being offset by the ‘maturing’ of the smoking epidemic, and thus smokers still alive in more recent years have had a longer history of regular consumption of cigarettes than men of the same ages would have had during the 1950s and 1960s. Another factor that may be important in the maturing of the epidemic (but which is impossible to quantify) is a change in the way cigarettes have been smoked in recent decades. The minority of doctors who continued to smoke cigarettes in the latter half of the study may have tended to be those who smoked them in a way different from that of the greater number who had stopped smoking them earlier.
Using the ratio of mortality rates from lung cancer in never, former and current smokers after the 50-year follow-up of British doctors (Doll et al, 2005), and the prevalence of smoking among British men in 2008 (22% current smokers, 30% ex-smokers; General Lifestyle Survey 2008/ONS 2010, 2010), the estimate of the PAF of lung cancer is 80%. This is somewhat lower than the 85% estimate of the current analysis, and that of Peto et al (2006), who, using essentially the same methodology, estimated that 88% of lung cancer deaths in men in the UK in the year 2007 were due to smoking, and 84% of deaths in women. The reason, as noted above, is that the relative risks observed in British doctors are unlikely to be the same as the averages for the UK population in 2010.
Environmental tobacco smoke (ETS)
Methods
Estimation of the fraction of cancer caused by exposure to ETS in lifelong non-smokers uses the traditional method for attributable fractions, incorporating estimates of relative risk (of exposure to tobacco smoke) and the prevalence of such exposure among never smokers. The formula for calculating PAF is as follows:
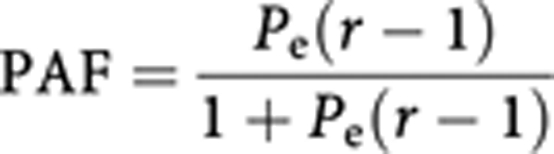 |
where Pe is the prevalence of exposure and r is the relative risk of lung cancer in those exposed to ETS. The attributable fraction is applied to the number of lung cancer cases estimated to occur among never smokers. From the section on tobacco smoking, this was estimated to be 6819 (3262 in men and 3557 in women) in the UK in 2010 (Table 2).
We may estimate two components:
Cases of lung cancer (in never smokers) caused by domestic exposure to ETS.
Cases of lung cancer (in never smokers) caused by exposure to ETS in the workplace.
The relative risks from the IARC (2004) meta-analyses, described in the Introduction, are used (Table 4).
Table 4. Relative risks of lung cancer from exposure to ETS (IARC, 2004).
|
RR by
sex
|
||
|---|---|---|
| Source of exposure to ETS | Males | Females |
| At home (spouse) | 1.37 | 1.24 |
| At work (occupational) | 1.12 | 1.19 |
Abbreviations: ETS=environmental tobacco smoke; RR=relative risk.
Exposure to ETS at home Most studies investigate the risk of lung cancer in lifelong non-smokers (never-smokers) living with a smoking spouse, and it was on a meta-analysis of such studies that the estimated relative risks in the IARC monograph were based. There appear to be no survey data upon which one can estimate the prevalence of such exposures in the UK. A range of approaches have been used by others, from using the exposure prevalence of control subjects in case–control studies (IARC, 2007) to extrapolation from exposure of children to ETS at home (Jamrozik, 2005). Trédaniel et al (1997) estimate the exposure from spouse smoking based on the prevalence of smoking in men and women, and the probability that couples would be discordant for their smoking status. This seems to be the method most likely to yield exposures equivalent to those for which relative risks have been estimated, as well as allowing estimates specific to the UK (which controls from case–control studies cannot). Using data from the General Household Survey for 2008, we may obtain the prevalence of current, ever or never smokers by age group, as well as the probability of being married or cohabiting currently or ever in the past. We use the ‘aggregation factor’ of 3.0 proposed by Wald et al (1986) to express the relative probability of couples being concordant for smoking status.
Table 5 shows the percentage of the UK population who are currently married or cohabiting (column 1), and the percentage who have ever been married (or cohabiting; column 2), by age group. Column 3 shows the prevalence of current smokers, and column 4 the percentage of persons who have never smoked.
Table 5. Prevalence estimates of cohabitation with smoking partner among non-smokers in UK, and fraction of lung cancer cases attributable to cohabitation with a smoking partner.
| Cohabitation status of never-smokers (%) a | Population smoking status (%) a | Estimated prevalence of never-smokers cohabiting with smoking partner and lung cancer cases attributable to cohabitation with smoking partner (%) b | ||||||||
|---|---|---|---|---|---|---|---|---|---|---|
| 1 | 2 | 3 | 4 | 5 | 6 | 7 | 8 | 9 | 10 | |
| Age group (years) | Living with a partner | Ever had a partner | Current smokers | Never smokers | Never-smokers living with current smoking partner | PAF | Never-smokers living with ever smoking partner | PAF | Never-smokers ever living with smoking partner | PAF |
| Men | ||||||||||
| 16–24 | 8 | 8 | 24 | 69 | 1 | 0.5 | 2 | 0.6 | 2 | 0.6 |
| 25–34 | 61 | 63 | 30 | 53 | 10 | 3.5 | 19 | 6.4 | 19 | 6.6 |
| 35–44 | 77 | 82 | 24 | 51 | 11 | 3.8 | 25 | 8.3 | 26 | 8.8 |
| 45–54 | 77 | 88 | 24 | 48 | 11 | 3.8 | 24 | 8.1 | 27 | 9.1 |
| 55–64 | 79 | 93 | 18 | 41 | 7 | 2.5 | 16 | 5.6 | 19 | 6.5 |
| 65–74 | 77 | 94 | 13 | 37 | 4 | 1.3 | 20 | 6.9 | 25 | 8.3 |
| ⩾75 | 60 | 93 | 13 | 37 | 8 | 2.8 | 14 | 5.0 | 22 | 7.5 |
| Total | 63 | 72 | 22 | 49 | 6 | 2.0 | 17 | 6.0 | 20 | 6.8 |
| Women | ||||||||||
| 16–24 | 18 | 19 | 26 | 71 | 3 | 1.0 | 4 | 1.5 | 4 | 1.5 |
| 25–34 | 68 | 72 | 29 | 57 | 12 | 4.1 | 24 | 8.1 | 25 | 8.6 |
| 35–44 | 75 | 87 | 25 | 56 | 8 | 3.0 | 29 | 9.8 | 34 | 11.2 |
| 45–54 | 75 | 93 | 24 | 57 | 10 | 3.4 | 31 | 10.3 | 38 | 12.4 |
| 55–64 | 72 | 96 | 22 | 55 | 4 | 1.6 | 29 | 9.7 | 39 | 12.5 |
| 65–74 | 63 | 96 | 13 | 56 | 7 | 2.5 | 32 | 10.7 | 50 | 15.5 |
| ⩾75 | 29 | 94 | 13 | 56 | 4 | 1.6 | 14 | 5.1 | 47 | 14.8 |
| Total | 59 | 79 | 21 | 57 | 7 | 2.5 | 23 | 7.8 | 31 | 10.1 |
Abbreviations: PAF=population-attributable fraction.
Cohabitation status and population smoking status from General Lifestyle Survey 2008/ONS 2010 (2010).
Estimates are based on cohabitation status and population smoking status, and assume couples are in the same broad age groups as those in the table and the relative probability of couples being concordant for smoking status is 3.0 (Wald et al, 1986).
Under the assumption that couples are in the same broad age groups as those in the table, and that the ‘aggregation factor’ described above is 3.0, we can estimate the percentage of never smokers who belong to the following categories:
Currently living with a smoking partner (column 5)
Currently living with a partner who has ever smoked (column 7)
Has ever lived with a partner who was a smoker at some point of time (column 9).
The corresponding attributable fractions of lung cancers among never smokers are shown in columns 6, 8 and 10. They range from 2% of lung cancer cases in non-smoking men (due to their current partner's smoke) to 10.1% of lung cancers in non-smoking women, as a consequence of ever having had a partner who was a smoker at some point of time.
Although the relative risks derive from studies of non-smokers with current partners who smoked, the corresponding estimates of PAF in Table 5 (column 6) are probably an underestimate, because of the following factors:
They take account only of current partnerships, and it is likely that past partnerships with a smoker would have had some adverse effects, particularly when separation had occurred only recently
Some non-smoking partners may have quit relatively recently, and their past smoking would have had an adverse effect
There may be other members of the household smoking, even though the partner does not.
For these reasons, the attributable fractions in column 8 (based on non-smokers with a current partner who was ever a smoker) are taken as the relevant estimate for the UK population.
Exposure to ETS at work Jamrozik (2005) gives the prevalence of passive smoking at work as 11%, an estimate that probably derives from the survey commissioned by ASH in April 1999, which revealed that approximately 3 million people in the UK are regularly exposed to ETS at work (ASH, 2004). There are otherwise very few data on workplace exposure to ETS in the UK. Chen et al (2001), in a small sample derived from participants in the fourth Scottish MONICA survey of 1995, found that any (regular) exposure of adults aged 25–64 years to environmental tobacco smoke at work was 68.1% for men and 57.5% for women (of which 21.5% of men and 17.4% of women classified such exposure as ‘some’ or ‘a lot’). The EPIC study collected data on exposure to ETS at the time of recruitment among 123 000 non-smokers from 11 centres (none of them in UK) during 1993–1998, 78% of whom were women; 67% reported exposure at work (Vineis et al, 2005). The proportion of non-smoker controls in the multi-centre European case–control study of Boffetta et al (1998) who reported ever being exposed to ETS at work was 71% in men and 47% in women.
It is difficult, based on such incomplete data, and the varying definition of ‘exposure’, to decide an appropriate prevalence for the UK. On the basis of the average of the results from Boffetta et al (1998), Chen et al (2001) and Vineis et al (2005), 71% for men and 53% for women, 8% of lung cancers in never-smoking men and 9% in women would be due to workplace exposure to ETS. With the much lower exposure estimate of Jamrozik (11%), the attributable fractions would be 1.3% and 2.0% in men and women, respectively.
Results
Estimate of attributable fraction in lifelong non-smokers
Table 6 shows the final estimates of lung cancer attributable to ETS from the spouse, and at work, with the assumptions described above. With respect to combined exposure, it is assumed that the relative risks are simply multiplicative (no interaction). The exposures are assumed to be either
independent of each other or
correlated, in that individuals exposed at home are more likely to be exposed at work. In fact, the concordance between exposures at the two sites is rather weak: on the basis of the results among the control subjects in the study by Boffetta et al (1998), the κ value is −0.005 for women and +0.05 for men.
Table 6. Lung cancer cases attributable to exposure of non-smokers to ETS in UK in 2010.
|
Source of
exposure
|
|||||||||||
|---|---|---|---|---|---|---|---|---|---|---|---|
|
Both
|
|||||||||||
|
Spouse
|
Workplace
|
Independent ETS
exposure
|
Correlated ETS
exposure
|
||||||||
| Age group (years) | PAF | Obs. | Excess attributable cases | PAF | Obs. | Excess attributable cases | Obs. | Excess attributable cases | PAF (%) | Excess attributable cases | PAF (%) |
| Men | |||||||||||
| 16–24 | 0.01 | 0 | 0 | 0.08 | 0 | 0 | 0 | 0 | — | 0 | — |
| 25–34 | 0.06 | 38 | 2 | 0.08 | 38 | 3 | 38 | 5 | 13.7 | 5 | 12.9 |
| 35–44 | 0.08 | 128 | 11 | 0.08 | 128 | 10 | 128 | 20 | 15.5 | 19 | 14.6 |
| 45–54 | 0.08 | 252 | 20 | 0.08 | 252 | 20 | 252 | 38 | 15.3 | 36 | 14.4 |
| 55–64 | 0.06 | 513 | 28 | 0.08 | 513 | 40 | 513 | 66 | 12.9 | 62 | 12.0 |
| 65–74 | 0.07 | 854 | 59 | 0.08 | 854 | 67 | 854 | 121 | 14.2 | 114 | 13.3 |
| ⩾75 | 0.05 | 1478 | 74 | 0.08 | 1478 | 115 | 1478 | 183 | 12.4 | 170 | 11.5 |
| All ages | 3262 | 195 | 3262 | 255 | 3262 | 434 | — | 406 | — | ||
| % of total (all ages) | 6.0 | 7.8 | 13.3 | 12.4 | |||||||
| Women | |||||||||||
| 16–24 | 0.01 | 0 | 0 | 0.09 | 0 | 0 | 0 | 0 | 0 | ||
| 25–34 | 0.08 | 42 | 3 | 0.09 | 42 | 4 | 42 | 7 | 16.5 | 7 | 15.6 |
| 35–44 | 0.10 | 168 | 16 | 0.09 | 168 | 15 | 168 | 30 | 18.0 | 29 | 17.1 |
| 45–54 | 0.10 | 320 | 33 | 0.09 | 320 | 29 | 320 | 59 | 18.5 | 56 | 17.6 |
| 55–64 | 0.10 | 556 | 54 | 0.09 | 556 | 51 | 556 | 100 | 18.0 | 95 | 17.1 |
| 65–74 | 0.11 | 822 | 88 | 0.09 | 822 | 75 | 822 | 155 | 18.9 | 148 | 18.0 |
| ⩾75 | 0.05 | 1649 | 84 | 0.09 | 1649 | 151 | 1649 | 227 | 13.8 | 212 | 12.8 |
| All ages | 3557 | 279 | 3557 | 325 | 3557 | 578 | — | 547 | — | ||
| % of total (all ages) | 7.8 | 9.1 | 16.3 | 15.4 | |||||||
| Persons | |||||||||||
| 16–24 | 0 | 0 | 0 | 0 | 0 | 0 | 0 | ||||
| 25–34 | 80 | 6 | 80 | 7 | 80 | 12 | 15.2 | 6 | 7.3 | ||
| 35–44 | 296 | 27 | 296 | 25 | 296 | 50 | 16.9 | 27 | 9.1 | ||
| 45–54 | 572 | 53 | 572 | 49 | 572 | 98 | 17.1 | 53 | 9.3 | ||
| 55–64 | 1069 | 82 | 1069 | 91 | 1069 | 166 | 15.5 | 82 | 7.7 | ||
| 65–74 | 1676 | 147 | 1676 | 142 | 1676 | 276 | 16.5 | 147 | 8.8 | ||
| ⩾75 | 3127 | 158 | 3127 | 266 | 3127 | 410 | 13.1 | 158 | 5.0 | ||
| All ages | 6820 | 474 | 6820 | 580 | 6820 | 1013 | — | 952 | — | ||
| % of total (all ages) | 6.9 | 8.5 | 14.8 | 14.0 | |||||||
Abbreviations: ETS=environmental tobacco smoke; Obs.=observed cases; PAF=population-attributable fraction.
In total, 14–15% of lung cancer cases among individuals who have never smoked are estimated to be due to exposure to ETS.
Discussion
The estimate of the effect of exposure to spousal smoking is based on current (2008) data on the proportion of persons married or cohabiting, and an estimate of the likelihood that their current partner has ever smoked. The percentages are 17% for men (aged over 16) and 23% for women. Self-reported exposure to spousal smoke among controls in the multi-centre European case–control study of Boffetta et al (1998) was reported as 12.8% for men and 62.7% for women – but these are values for those ever exposed, which were used in estimating the PAF in France (IARC, 2007). In the EPIC study, 28.5% of non-smokers (78% women) from 11 centres in Europe (not UK) reported ETS exposure (probably at the time of recruitment) at home (Vineis et al, 2005). The estimates of Jamrozik (2005) − 37% of adults under 65 exposed at home – are clearly inappropriate, as they relate to exposure of children to smoke at home from either parent. In the UK, Jarvis et al (2003), in a sample of adults from the general population of England in 1994 and 1996, found that among 9556 married or cohabiting non-smokers 14.5% had a partner who was a current cigarette smoker. This is similar to the indirect estimate of 17% (men) and 23% (women) who would be expected to have a smoking partner, based on the current prevalence in 2008, and an aggregation factor of 3, on which the result in Table 5 is based. Smoking prevalence has declined over time, and exposure to smoke from a smoking spouse would have been greater in the past (among individuals developing lung cancer in 2010), especially for women, as smoking has declined among men much more than among women. However, as the estimate is based on the probability of the current partner ever having been a smoker, any bias will be small.
The estimate of the role of exposure to ETS in the workplace uses the relative risks from the meta-analysis of case–control studies conducted by IARC (2004). A somewhat more recent meta-analysis of 22 studies (Stayner et al, 2007) suggested a similar magnitude of relative risk (1.24). The definition of ‘exposure’ in the studies included in these analyses varies, and, in any case, estimates of the PAF depend on the prevalence of workplace exposure to ETS in the UK population, for which there are no representative data.
A previous estimate for deaths attributable to passive smoking in the UK was made by Jamrozik (2005). The results are rather different from those obtained here – 1372 deaths from lung cancer due to exposure at home and 160 due to exposure at work. The reasons for this are different assumptions concerning prevalence of exposure (as mentioned above) and relative risk, and the attribution of no lung cancer deaths after the age of 64 years to workplace exposures. What is more, Jamrozik estimates lung cancer deaths attributable to passive smoking in the whole population – including among current and past smokers; as noted in the introduction, this is illogical, as such deaths would not occur among non-smokers if no one smoked.
Summary
Table 7 summarizes the findings with respect to lung cancer and exposure to tobacco smoke. In total, 34 599 cases of lung cancer in the UK (86% of the total) were due to exposure to tobacco smoke in 2010, the great majority of which (97.4%) are due to active smoking (current or in the past). The figures for men are 87% cases due to exposure to tobacco (of which 97.7% were due to smoking), and for women 84% cases due to exposure to tobacco (of which 96.2% were due to smoking).
Table 7. Cases of lung cancer attributable to tobacco, by sex and age group (UK 2010).
|
Total attributable
cases
|
|||||
|---|---|---|---|---|---|
| Age group (years) | Observed cases | Smoking attributable cases | ETS attributable cases | Excess attributable cases | PAF (%) |
| Males | |||||
| 0–34 | 38 | 0 | 5 | 5 | 14 |
| 35–44 | 215 | 87 | 20 | 107 | 50 |
| 45–54 | 1138 | 886 | 38 | 924 | 81 |
| 55–64 | 4184 | 3671 | 66 | 3737 | 89 |
| ⩾65 | 16 697 | 14 366 | 305 | 14 671 | 88 |
| Total | 22 273 | 19 011 | 434 | 19 445 | 87 |
| Females | |||||
| 0–34 | 42 | 0 | 7 | 7 | 17 |
| 35–44 | 224 | 56 | 30 | 86 | 39 |
| 45–54 | 1088 | 768 | 59 | 827 | 76 |
| 55–64 | 3441 | 2885 | 100 | 2985 | 87 |
| ⩾65 | 13 335 | 10 864 | 382 | 11 246 | 84 |
| Total | 18 132 | 14 575 | 578 | 15 153 | 84 |
| Persons | |||||
| 0–34 | 80 | 0 | 12 | 12 | 15 |
| 35–44 | 439 | 143 | 50 | 193 | 44 |
| 45–54 | 2226 | 1654 | 98 | 1752 | 79 |
| 55–64 | 7625 | 6556 | 166 | 6722 | 88 |
| ⩾65 | 30 032 | 25 230 | 687 | 25 917 | 86 |
| Total | 40 405 | 33 586 | 1013 | 34 599 | 86 |
Abbreviations: ETS=environmental tobacco smoke; PAF=population-attributable fraction.
Table 8 shows the final summary of the estimate of tobacco-attributable cancer in the UK. In total, the estimate is of 60 837 cancer cases (19.4% of all new cancer cases) attributable to tobacco: 36 537 (23.0%) of cancers in men and 24 300 (15.6%) of cancers in women.
Table 8. Cancer cases caused by exposure to tobacco smoke (by smoking, or environmental), UK 2010.
|
Cases in UK,
2010
|
|||
|---|---|---|---|
| Cancer | Observed cases | Excess attributable cases Number (% at this site) | Population-attributable fraction (% of all cancers) |
| Males | |||
| Lung | 22 273 | 19 445 (87) | 12.3 |
| Oral cavity and pharynx | 4573 | 3180 (70) | 2.0 |
| Oesophagus | 5711 | 3574 (63) | 2.3 |
| Stomach | 4467 | 1167 (26) | 0.7 |
| Liver | 2270 | 620 (27) | 0.4 |
| Pancreas | 4082 | 1071 (26) | 0.7 |
| Colon–rectum | 22 125 | 1469 (7) | 0.9 |
| Larynx | 1802 | 1424 (79) | 0.9 |
| Cervix uteri | — | — | — |
| Ovary | — | — | — |
| Bladder | 6711 | 2520 (38) | 1.6 |
| Kidney | 5697 | 1677 (29) | 1.1 |
| Leukaemia | 4639 | 390 (8) | 0.2 |
| All cancers | 158 667 | 36 537 (23.0) | 23.0 |
| Females | |||
| Lung | 18 132 | 15 153 (84) | 9.7 |
| Oral cavity and pharynx | 2355 | 1292 (55) | 0.8 |
| Oesophagus | 2817 | 2009 (71) | 1.3 |
| Stomach | 2576 | 398 (15) | 0.3 |
| Liver | 1298 | 199 (15) | 0.1 |
| Pancreas | 4280 | 1325 (31) | 0.9 |
| Colon–rectum | 17 786 | 1766 (10) | 1.1 |
| Larynx | 382 | 302 (79) | 0.2 |
| Cervix uteri | 2693 | 195 (7) | 0.1 |
| Ovary | 6820 | 177 (3) | 0.1 |
| Bladder | 2571 | 883 (34) | 0.6 |
| Kidney | 3364 | 504 (15) | 0.3 |
| Leukaemia | 3201 | 96 (3) | 0.1 |
| All cancers | 155 584 | 24 300 (15.6) | 15.6 |
| Persons | |||
| Lung | 40 405 | 34 599 (86) | 11.0 |
| Oral cavity and pharynx | 6928 | 4472 (65) | 1.4 |
| Oesophagus | 8528 | 5583 (65) | 1.8 |
| Stomach | 7043 | 1565 (22) | 0.5 |
| Liver | 3568 | 819 (23) | 0.3 |
| Pancreas | 8362 | 2396 (29) | 0.8 |
| Colon–rectum | 39 911 | 3235 (8) | 1.0 |
| Larynx | 2184 | 1726 (79) | 0.5 |
| Cervix uteri | 2693 | 195 (7) | 0.1 |
| Ovary | 6820 | 177 (3) | 0.1 |
| Bladder | 9282 | 3403 (37) | 1.1 |
| Kidney | 9061 | 2181 (24) | 0.7 |
| Leukaemia | 7840 | 487 (6) | 0.2 |
| All cancers | 314 251 | 60 837 (19.4) | 19.4 |
See acknowledgements on page Si.
Footnotes
The author declares no conflict of interest.
References
- ASH (2004) Passive smoking: a summary of the evidence. http://www.ash.org.uk/files/documents/ASH_305.pdf
- Boffetta P, Agudo A, Ahrens W, Benhamou E, Benhamou S, Darby SC, Ferro G, Fortes C, Gonzalez CA, Jöckel KH, Krauss M, Kreienbrock L, Kreuzer M, Mendes A, Merletti F, Nyberg F, Pershagen G, Pohlabeln H, Riboli E, Schmid G, Simonato L, Trédaniel J, Whitley E, Wichmann HE, Winck C, Zambon P, Saracci R (1998) Multicenter case-control study of exposure to environmental tobacco smoke and lung cancer in Europe. J Natl Cancer Inst 90: 1440–1450 [DOI] [PubMed] [Google Scholar]
- Burns DM, Garfinkel L, Samet JM (1997) Changes in Cigarette-Related Disease Risks and Their Implication for Prevention and Control. Smoking and Tobacco Control Monograph 8 (97-4213). National Cancer Institute (NIH): Bethesda, MD [Google Scholar]
- Chen R, Tunstall-Pedoe H, Tavendale R (2001) Environmental tobacco smoke and lung function in employees who never smoked: the Scottish MONICA study. Occup Environ Med 58: 563–568 [DOI] [PMC free article] [PubMed] [Google Scholar]
- Doll R, Peto R, Boreham J, Sutherland I (2005) Mortality in relation to smoking: 50 years' observations on male British doctors. Br J Cancer 92: 426–429 [DOI] [PMC free article] [PubMed] [Google Scholar]
- Doll R, Peto R, Wheatley K, Gray R, Sutherland I (1994) Mortality in relation to smoking: 40 years' observations on British doctors. Br Med J 309: 901–911 [DOI] [PMC free article] [PubMed] [Google Scholar]
- Ezzati M, Henley SJ, Lopez AD, Thun MJ (2005) Role of smoking in global and regional cancer epidemiology: current patterns and data needs. Int J Cancer 116: 963–971 [DOI] [PubMed] [Google Scholar]
- Garfinkel L (1980) Cancer mortality in non smokers: prospective study by the American Cancer Society. J Natl Cancer Inst 65: 1169–1173 [PubMed] [Google Scholar]
- General Lifestyle Survey 2008/Office for National Statistics (ONS) 2010 (2010) (http://www.statistics.gov.uk/downloads/theme_compendia/GLF08/GeneraLifestyleSurvey2008.pdf)
- Hannan LM, Jacobs EJ, Thun MJ (2009) The association between cigarette smoking and risk of colorectal cancer in a large prospective cohort from the United States. Cancer Epidemiol Biomarkers Prev 18: 3362–3367 [DOI] [PubMed] [Google Scholar]
- International Agency for Research on Cancer (IARC) (2004) IARC Monographs on the Evaluation of Carcinogenic Risks to Humans. Vol. 83: Tobacco Smoke and Involuntary Smoking. IARC: Lyon [PMC free article] [PubMed] [Google Scholar]
- International Agency for Research on Cancer (IARC) (2007) Attributable Causes of Cancer in France in the Year 2000. IARC Working Group Reports; 3
- Jamrozik K (2005) Estimate of deaths attributable to passive smoking among UK adults: database analysis. Br Med J 330: 812. [DOI] [PMC free article] [PubMed] [Google Scholar]
- Jarvis MJ, Primatesta P, Erens B, Feyerabend C, Bryant A (2003) Measuring nicotine intake in population surveys: comparability of saliva cotinine and plasma cotinine estimates. Nicotine Tob Res 5: 349–355 [DOI] [PubMed] [Google Scholar]
- Jordan SJ, Whiteman DC, Purdie DM, Green AC, Webb PM (2006) Does smoking increase risk of ovarian cancer? A systematic review. Gynecol Oncol 103: 1122–1129 [DOI] [PubMed] [Google Scholar]
- Peto R, Darby S, Deo H, Silcocks P, Whitley E, Doll R (2000) Smoking, smoking cessation, and lung cancer in the UK since 1950: combination of national statistics with two case-control studies. Br Med J 321: 323–329 [DOI] [PMC free article] [PubMed] [Google Scholar]
- Peto R, Lopez AD, Boreham J, Thun M (1992) Mortality from tobacco in developed countries: indirect estimation from national vital statistics. Lancet 339: 1268–1278 [DOI] [PubMed] [Google Scholar]
- Peto R, Lopez AD, Boreham J, Thun M, Heath Jr C (2006) Mortality from Tobacco in Developed Countries 1950–2000, 2nd edn (updated June 2006). http://www.ctsu.ox.ac.uk/%7Etobacco/ [DOI] [PubMed]
- Secretan B, Straif K, Baan R, Grosse Y, El Ghissassi F, Bouvard V, Benbrahim-Tallah L, Guha N, Freeman C, Galichet L, Cogliano V (2009) A review of human carcinogens - part E: tobacco, areca nut, alcohol, coal smoke, and salted fish. Lancet Oncol 10: 1033–1034 [DOI] [PubMed] [Google Scholar]
- Stayner L, Bena J, Sasco A, Smith R, Steenland K, Kreuzer M, Straif K (2007) Lung cancer and workplace exposure to environmental tobacco smoke. Am J Publ Health 97: 545–551 [DOI] [PMC free article] [PubMed] [Google Scholar]
- Thun MJ, Day-Lally C, Myers DG, Calle EE, Flanders WD, Zhu BP, Namboodiri MM, Heath CW (1997) Trends in tobacco smoking and mortality from cigarette use in Cancer prevention Studies I (1959 through 1965) and II (1982 through 1988). In Changes in Cigarette-Related Disease Risks and Their Implication for Prevention and Control, Burns DM, Garfinkel L, Samet JM (eds). Smoking and Tobacco Control Monograph 8, US Department of Health and Human Services, Public Health Service, National Institutes of Health, National Cancer Institute: Bethesda, MD [Google Scholar]
- Thun MJ, Henley SJ, Burns DM, Jemal A, Shanks TG, Calle EE (2006) Lung cancer death rates in lifelong non-smokers. J Natl Cancer Inst 98: 691–699 [DOI] [PubMed] [Google Scholar]
- Trédaniel J, Boffetta P, Saracci R, Hirsch A (1997) Non-smoker lung cancer deaths attributable to exposure to spouse's environmental tobacco smoke. Int J Epidemiol 26: 939–944 [DOI] [PubMed] [Google Scholar]
- Vineis P, Airoldi L, Veglia F, Olgiati L, Pastorelli R, Autrup H, Dunning A, Garte S, Gormally E, Hainaut P, Malaveille C, Matullo G, Peluso M, Overvad K, Tjonneland A, Clavel-Chapelon F, Boeing H, Krogh V, Palli D, Panico S, Tumino R, Bueno-De-Mesquita B, Peeters P, Berglund G, Hallmans G, Saracci R, Riboli E (2005) Environmental tobacco smoke and risk of respiratory cancer and chronic obstructive pulmonary disease in former smokers and never smokers in the EPIC prospective study. Br Med J 330: 277. [DOI] [PMC free article] [PubMed] [Google Scholar]
- US Department of Health and Human Services, Centers for Disease Control and Prevention, National Center for Chronic Disease Prevention and Health Promotion, Office on Smoking and Health (2004) The Health Consequences of Smoking: A Report of the Surgeon General [Atlanta, GA]. Washington, DC (http://www.cdc.gov/tobacco/data_statistics/sgr/sgr_2004/00_pdfs/chapter7.pdf) [Google Scholar]
- Wald NJ, Nanchahal K, Thompson SG, Cuckle HS (1986) Does breathing other people's tobacco smoke cause lung cancer? Br Med J (Clin Res Ed) 293: 1217–1222 [DOI] [PMC free article] [PubMed] [Google Scholar]