Abstract
An evaporative light scattering detection (ELSD) based high-performance liquid chromatography (HPLC) method is developed for the determination of polysorbate 80 (tween 80) in therapeutic protein formulations. The method is simple and overcomes the difficulties associated with specificity and sensitivity. The method is suitable for the quantitation of polysorbate 80 in the usual formulation range (0.01–0.1%) as well as in trace amounts ≥13 µg/mL. The analysis is based on the removal of protein first by solid-phase extraction using Oasis HLB cartridges followed by HPLC analysis using Inertsil ODS-3 C 18 column (4.6×150 mm, 5 µm) using reversed-phase conditions. The detector response changes exponentially with an increase in polysorbate concentration. A very good linear fit of log ELSD response against log polysorbate 80 concentration is observed. The specificity, sensitivity, precision, and accuracy of the method are suitable for the quantitation of polysorbate 80 in protein formulations.
Introduction
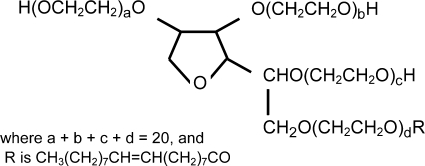
Polysorbate 80, also commonly known as Tween 80, consists of a heterogeneous distribution of polyoxyethylene sorbitan monooleate structures (see Figure 1). The hydrocarbon chains and the ethylene oxide groups provide respectively, the hydrophobic and hydrophilic character to the polysorbate 80 molecule. Polysorbate 80 is used as a non-ionic water soluble surfactant and emulsifier in the food industry. Polysorbate 80 is also used as a good formulation excipient for a number of therapeutic protein solutions as it makes proteins more soluble and, hence, increases the solution stability. Polysorbate is known to inhibit self-association of proteins by competing with the air–water interface. Polysorbate 80 is found to cause no observable adverse effects to humans up to a daily dose of 1.85 mL per kg of body weight (1).
Figure 1.
Structure of polysorbate 80 (tween 80).
In order to evaluate the quality and stability of therapeutic formulations, a reliable analytical method to quantify polysorbate 80 is needed. Since polysorbate 80 does not have sufficient chromophores to absorb UV radiation, UV-based high-performance liquid chromatography methods become unsuitable. The analytical methods based on derivatization followed by colorimetric determination of polysorbate 80 are not only time consuming but also considered less specific (2–5). Indirect methods based on chemical transformation of polysorbate 80, such as the alkali (0.3–1 M) induced hydrolysis into oleic acid are reported (6, 7). These methods are laborious and time consuming, involving 6–18 h of digestion at an elevated temperature of 40–60°C. These methods may also exhibit higher baseline noise due to the very low wavelength of less than 200 nm needed to achieve the required sensitivity for detection. A size exclusion chromatography based method using charged aerosol detection (CAD) has also been reported for the detection of polysorbate 80 (8). The CAD based method requires the analyte polysorbate 80 in the mobile phase so as to keep the eluting analyte above its critical micellar concentration (CMC) in order to be detected as a peak. This method suffers mainly from inadequate selectivity and sensitivity as a result of poor peak shape. The use of HPLC coupled with mass spectrometry (MS) for the determination of polysorbate 80 has also been reported (9, 10). MS-based assays generally work well for a limited number of samples with low concentrations of proteins. Maintaining good precision and stable sensitivity for a prolonged period of time remains as the major challenge for the MS-based methods. Direct analysis of polysorbate 80 using an ELSD-based HPLC method has also been reported (11, 12). Although these direct methods are quick, the presence of protein in the sample makes them less selective and less sensitive. In the direct ELSD-based HPLC methods, the chromatographic separation of proteins from polysorbate 80 is critical. In order to achieve the required separation, often sensitivity is compromised. Additionally, as more and more injections of protein samples are made, more frequent cleaning of the detector becomes essential to keep the noise level low. To overcome the difficulties associated with the reported methods, a new HPLC method using an evaporative light scattering detector has been developed. The new method is based on the separation of protein from polysorbate 80 as well as the concentration of polysorbate 80 using solid-phase extraction (SPE), followed by HPLC analysis. The removal of protein from the sample before HPLC analysis increases the specificity of the chromatographic separation. Therefore, suitable chromatographic conditions can be used to elute the polysorbate 80 peak early and make the peak sharper. The sharpness of the peak (higher signal to noise ratio) and the concentration of the sample involved in the SPE step are expected to increase the overall sensitivity of the method. The suitability of the new method for the determination of polysorbate 80 in therapeutic protein formulations has been evaluated by testing its specificity, linearity, precision, sensitivity, and accuracy.
Experimental
Materials
Polysorbate 80 used in this study was purchased from Sigma Aldrich (St. Louis, MO). The nebulizer gas, nitrogen (≥99.99%, UHP), was purchased from Airgas (West Chicago, IL). Acetonitrile (HPLC grade) was purchased from EM Science (Gibbstown, NJ). Oasis HLB 1 cc cartridges for SPE were obtained from Waters (Milford, MA). Monoclonal antibody (MAb) drug sample and monoclonal antibody drug buffer as available in the lab were used in the method development and evaluation.
SPE
The sample preparation involved the extraction of polysorbate 80 from sample and standard with Oasis HLB SPE cartridges. For this purpose, the SPE cartridge was attached to a vacuum (–5 to –10 mm Hg) manifold and washed with acetonitrile by adding 1 mL acetonitrile at the top of the cartridge and applying vacuum for ∼ 20 s to remove acetonitrile. The acetonitrile washing was repeated twice. After the acetonitrile wash, 1 mL water was added to the SPE cartridge, and the vacuum was turned on to remove the water. With the vacuum turned off, 1 mL of sample or standard was added at the top of the cartridge, and the vacuum was turned on until the solution was drained off completely. The cartridge was then rinsed twice with 1 mL water followed by applying vacuum to remove the water. The elution of polysorbate 80 was achieved by inserting a new collection tube into the SPE cartridge and adding 0.5 mL acetonitrile to the SPE cartridge. The vacuum was turned on again to collect the sample solution as much as possible. The collected sample solution was transferred to an HPLC vial and stored at 4°C for analysis.
HPLC conditions
Polysorbate 80 was analyzed using a Waters 2695 HPLC coupled with a Sedex 75 evaporative light scattering detector. The separation of polysorbate 80 from other analytes was achieved using Inertsil ODS-3 (C18), 100Å, 150×4.6 mm, 5 µm column (GL Sciences) with a mobile phase consisting of acetonitrile and water. Throughout the analysis, the column was kept at room temperature, and the mobile phase flow rate was maintained at 1.0 mL/min. The chromatographic run was started by injecting 50 µL of sample solution. During the first 5 min of the run, the acetonitrile was maintained at 0%. The acetonitrile was increased linearly to reach 60% at 6 min and 80% at 10 min. After maintaining 80% acetonitrile from 10 to 15 min, the mobile phase was changed back to 0% acetonitrile at 15.1 min, and the column was equilibrated until 20 min. The ELSD was maintained at 45°C throughout. The nebulizer (nitrogen) gas pressure was set at 2.8 bar and the detector gain was set at 9.
Results and Discussion
Specificity
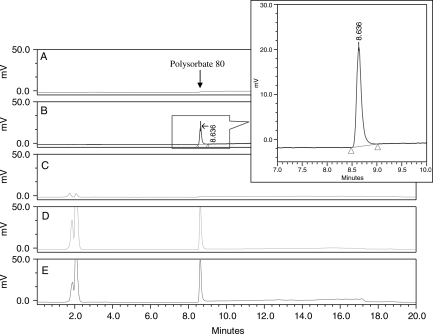
The specificity of the chromatographic separation was first tested by injecting acetonitrile and 0.01% polysorbate 80 in acetonitrile directly into the column (see Figure 2). The overall specificity of the method was also tested by injecting monoclonal antibody drug formulation buffer and monoclonal antibody in the formulation buffer each containing 0.01% polysorbate 80 after SPE with the HLB cartridge. Chromatograms exhibiting the good selectivity of the method are shown in Figure 2. Polysorbate 80 elutes at ∼ 8.6 min. No other peak was found to elute at or near the retention time of polysorbate 80. Occasionally peaks eluting in the void volume (<3 min) corresponding to buffer components were found in some chromatograms. These early eluting peaks were not found to have any effect on the specificity or accuracy of the method.
Figure 2.
Chromatogram of (A) acetonitrile, (B) polysorbate 80 in acetonitrile without SPE, (C) monoclonal antibody drug buffer after SPE, (D) 0.01% polysorbate 80 in monoclonal antibody drug buffer after SPE, and (E) monoclonal antibody formulated bulk drug substance containing 0.01% polysorbate 80 after SPE.
Linearity
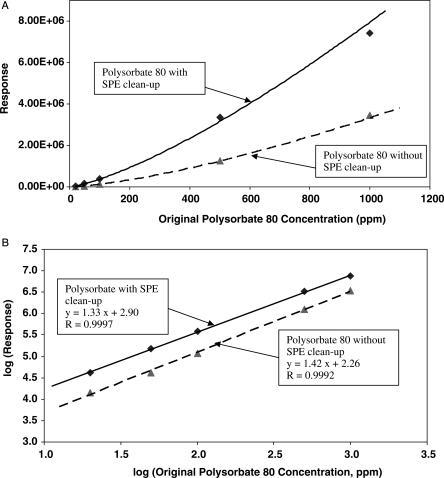
After SPE, Polysorbate 80 standard solutions of 0.002, 0.005, 0.01, 0.05, and 0.1% (v/v) in monoclonal antibody buffer were injected into the HPLC. The ELSD response increased with an increase in polysorbate 80 concentration in a non-linear manner (see Figure 3A). However, the plot of log ELSD response verses log polysorbate 80 concentration showed a linear relationship (Figure 3B), and the data fit well into the equation of the type:
| (Eq.1) |
where: y = log (polysorbate 80 peak area), x = log [concentration of polysorbate 80 (ppm)], b = y-intercept, and m = slope of the line.
Figure 3.
(A) Dependence of ELSD response on polysorbate 80 concentration and (B) log-log linear relationship between ELSD response and polysorbate 80 concentration.
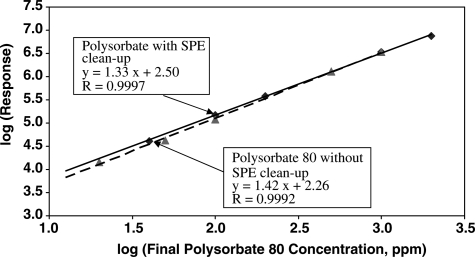
The linearity of the method as well as polysorbate 80 recovery (mass balance) from the SPE clean-up were tested by injecting two sets of polysorbate 80 standards. The first set of standards was prepared in acetonitrile and injected into the HPLC without SPE clean-up (mass balance control set). The second set of standards was prepared in monoclonal antibody drug buffer and subjected to SPE clean-up before injected into the HPLC (mass balance test set). The log-log linearity plots corresponding to the final concentration in the solution for both sets of standards are shown in Figure 4. The data obtained from both sets of standards fit well into the linear equation 1, which gives coefficients of variation (R) ≥ 0.999. If the SPE clean-up step is not efficient and results in the loss of polysorbate 80, the ELSD response for the standard prepared from the SPE clean-up is expected to be considerably lower than for the standard prepared without SPE clean-up. The ELSD responses for the two sets of standards for any given polysorbate concentration in the injected solutions were found to be similar. The closeness of the slope values as well as the intercept values obtained from both sets of standards indicate that the SPE clean-up step does not result in any significant loss of polysorbate 80. The intercept values obtained for both sets of standards correspond to ELSD responses for polysorbate 80 concentration of ≤ 1 ppm. It should be noted that only for the purpose of mass balance evaluation, the log-log linearity plots were obtained with x-axis coordinates corresponding to final polysorbate 80 concentrations in the solutions. In regular analysis, generally the x-axis coordinates correspond to initial concentrations of polysorbate in the solutions as shown in Figure 3B. However, both types of the calibration curves as shown Figures 3B and 4 can be used for the quantitation of polysorbate 80, provided appropriate concentration factors are used in the respective calculations.
Figure 4.
Log-log linearity plot of polysorbate 80 in acetonitrile with no SPE clean-up (dashed line) and in buffer with SPE clean-up (solid line).
Precision
The repeatability of injection, separation, and detector response was evaluated by replicate injections of one 0.01% polysorbate 80 standard after SPE clean up. Using the ELSD detector response for the individual injections, average response, standard deviation, and relative standard deviation were calculated. The relative standard deviation of 1.1% obtained with this test is an indication that the ELSD response is reproducible. In order to evaluate the repeatability of the overall method, six 0.01% polysorbate 80 standards were prepared separately in monoclonal antibody drug buffer, and all were subjected to SPE using HLB cartridges. The resulting six standard solutions were injected into the HPLC for analysis. The chromatograms of six 0.01% polysorbate standards prepared separately in monoclonal antibody drug buffer after SPE clean up were found to be reproducible. Using the ELSD detector responses for all the 0.01% polysorbate 80 standards average response, standard deviation, and relative standard deviation were calculated. The relative standard deviation of 3.9% obtained for the six replicate SPE sample preparations is an indication that the overall method precision (repeatability) is good.
Accuracy
To evaluate the accuracy of the method two sets of calibration curves were generated. One calibration curve (A) was generated using a set of polysorbate standards prepared in acetonitrile, which were injected into the HPLC without SPE clean up (see Figure 4). A second calibration curve (B) was generated using another set of polysorbate standards prepared in monoclonal antibody drug buffer, which were injected into the HPLC after the SPE clean up (see Figure 4). A set of six replicate test standards of 0.01 % polysorbate 80 were prepared and injected in to the HPLC after SPE. The concentrations of polysorbate 80 in each of the six test standards were determined using both the calibration curves generated by two different sets of standards. The accuracy expressed in terms of % recovery was calculated using the equation:
| (Eq.2) |
The recovery values obtained using the two different calibration curves (A and B) for the six test standards are listed in Table I. It is apparent from the good recovery data listed in Table I that the method is suitable for the determination of polysorbate 80 in protein formulations. The accuracy of the method was also evaluated by spiking the monoclonal antibody drug sample with polysorbate 80 at 0.005, 0.01, and 0.015 % (v/v) level. The spiked samples after SPE clean up were injected into the HPLC, and the recovery values were calculated by using a calibration curve (B) obtained by standards prepared by following the similar SPE clean-up are listed in Table II. The recovery values of 92%, 88%, and 93% were obtained for polysorbate 80 spiking concentrations of 50, 100, and 150 ppm, respectively. The recovery of 88% obtained for polysorbate 80 spiking concentration of 100 ppm is considerably lower than the previously obtained average recovery of 102% for the six replicate spikings at the same level. However, considering the complex nature of therapeutic protein matrix and the lower spiking concentration range (50–150 ppm), 88%–93% recovery values indicate the suitability of the method.
Table I.
Recovery Values for Six 0.01% Polysorbate 80 Test Standards After SPE Clean-up Calculated Using Calibration Curves A and B
| SPE | % Recovery | % Recovery |
|---|---|---|
| Preparation # | using curve A* | using curve B† |
| 1 | 97.5 | 102.0 |
| 2 | 97.4 | 102.0 |
| 3 | 95.4 | 100.0 |
| 4 | 92.7 | 97.0 |
| 5 | 100.7 | 105.0 |
| 6 | 99.4 | 104.0 |
| Average | 97.2 | 101.7 |
| Std Dev | 2.9 | 2.9 |
| %RSD | 2.9 | 2.8 |
* Calibration curve A: calibration standards prepared in acetonitrile and injected in to HPLC without SPE clean up (y = 1.42 x + 2.26). As standards did not undergo SPE clean-up, and only samples underwent SPE clean-up, no common blank could be used for blank subtraction in the processing method. Therefore, data were processed without blank subtraction and the results were later corrected for blank contribution. The signal in the blank corresponding to standards preparation (acetonitrile) was below quantitation limit. The signal in the blank corresponding to SPE clean-up procedure was measurable.
† Calibration curve B: calibration standards prepared in monoclonal antibody drug buffer and injected in to HPLC after SPE clean up (y = 1.33 x + 2.50). Spiked samples also underwent SPE clean-up. One common blank was used for blank subtraction in the processing method.
Table II.
Recovery of Polysorbate 80 Spiked in Monoclonal Antibody Drug Substance Sample at Three Levels*
| Spiked Sample | Theoretical Conc. | Experimental Conc. | %Recovery |
|---|---|---|---|
| # | (v/v %) | (v/v %) | |
| 1 | 0.005 | 0.0046 | 92.0 |
| 2 | 0.010 | 0.0088 | 88.0 |
| 3 | 0.015 | 0.0130 | 93.3 |
*Both sample and standard preparations involved SPE clean-up step
The good recovery data indicate that the loss of polysorbate 80 in the SPE clean-up step is minimum. Although the SPE clean-up procedure mentioned in this paper worked well for monoclonal antibody drug formulation, to apply this method to other protein formulations may need adjustments in the SPE clean-up step procedure. This will include SPE cartridge volume/capacity, sample load volume, polysorbate 80 elution volume, etc. The adjustment in the SPE step will depend upon the types and concentrations of proteins and buffer components. For the determination of polysorbate 80, especially at lower concentrations (≥100 ppm), blank subtraction is recommended.
Sensitivity
The sensitivity of the method was evaluated by measuring the heights of signal and noise of the chromatogram of 0.002% polysorbate standard. Using the heights of signal and noise, the limit of detection corresponding to a signal-to-noise ratio of 3 and a limit of quantitation corresponding to a signal-to-noise ratio of 10 were calculated. The calculated limit of detection of 6 ppm and limit of quantitation of 13 ppm are indications that the method is sensitive to determine polysorbate at trace levels in protein solutions. Because the ELSD response increases exponentially with an increase in analyte concentration, to reach the LOQ signal level corresponding to 3.3×LOD signal level, the required concentration becomes much lower than 3.3×LOD concentration. In the case where detector response increases linearly with an increase in analyte concentration, the ratio of the LOQ concentration to LOD concentration is 3.3. In the current method involving the use of ELSD, the ratio of LOQ concentration to LOD concentration is found to be 2.2. Besides enhancing the specificity of the method, the other main advantage of SPE step is that the sensitivity of the method can be increased further if needed as it offers concentration of analyte of interest. Under the described chromatographic separation and detection conditions of this study, the sensitivity of the method is attributed to the ratio of sample load volume to polysorbate elution volume in the SPE step (i.e., 2). Higher sensitivity can be achieved by making adjustments in the SPE step so as to increase the ratio of sample load volume to analyte (polysorbate 80) elution volume.
Conclusion
In this paper, an HPLC method using evaporative light scattering detector for the determination of polysorbate 80 in protein samples is reported. The analysis is based on the removal of protein by SPE using Oasis HLB cartridges followed by HPLC analysis using Inertsil ODS-3 C18 column under reversed-phase conditions. As the sample injected into the HPLC does not contain proteins, resolution between polysorbate 80 and protein is no longer an issue. Hence suitable chromatographic conditions are chosen to elute the peak early and make the peak sharper. The method is suitable for the quantitation of polysorbate 80 in the usual formulation range (0.01–0.1%) as well as in trace amounts ≥ 13 µg/mL. The higher sensitivity of the method is attributed to the sharpness of the peak (higher signal to noise ratio) and the concentration of the sample involved in the SPE step. As the evaporative light scattering detector response increases exponentially with an increase in analyte concentration, both the sharpness of the peak and the sample concentration make the method reliable to quantitate polysorbate 80 even at trace levels. The method has been successfully used for the determination of polysorbate 80 in therapeutic protein formulations. The method is simple and overcomes the difficulties associated with specificity and sensitivity associated with reported methods. A very good linear fit of log ELSD response against log polysorbate 80 concentration is observed. The specificity, sensitivity, precision, and accuracy of the method are found to be suitable for the quantitation of polysorbate 80 in protein formulations.
References
- 1.Ema M., Hara H., Matsumoto M., Hirata-Koizumi M., Hirose A., Kamata E. Evaluation of developmental neurotoxicity of polysorbate 80 in rats. Reprod. Toxicol. 2008;25:89–99. doi: 10.1016/j.reprotox.2007.08.003. [DOI] [PubMed] [Google Scholar]
- 2.Crabb N.T., Persinger H.E. The determination of polyoxyethylene nonionic surfactants in water at the parts per million level. J. Am. Oil Chem. Soc. 1964;41:752–755. [Google Scholar]
- 3.Greff R.A., Setzkorn E.A., Leslie W.D. A colorimetric method for the determination of parts/million of nonionic surfactants. J. Am. Oil Chem. Soc. 1965;42:180–185. [Google Scholar]
- 4.Nozawa A., Ohnuma T., Tatsuya S. Re-examination of the microanalysis of non-ionic surfactants that contain polyoxyethylene chains by the method involving solvent extraction of the thiocyanatocobaltate (II) complex. Analyst. 1976;101:543–548. [Google Scholar]
- 5.Anderson N.H., Girling J. Determination of polyoxyethylene non-ionic surfactants at trace levels. Analyst. 1982;107:836–838. [Google Scholar]
- 6.Hu M., Niculescu M., Zhang X.M., Hui A. High-performance liquid chromatographic determination of polysorbate 8 in pharmaceutical suspensions. J. Chromatogr. A. 2003;984:233–236. doi: 10.1016/s0021-9673(02)01849-6. [DOI] [PubMed] [Google Scholar]
- 7.Adamo M., Dick L.W., Jr., Qiu D. A simple reversed phase high-performance liquid chromatography method polysorbate 80 quantitation in monoclonal antibody drug products. J. Chromatogr. B. 2010;878:1865–1870. doi: 10.1016/j.jchromb.2010.04.039. [DOI] [PubMed] [Google Scholar]
- 8.Fekete S., Ganzler K., Fekete J. Fastand sensitive determination of polysorbate 80 in solution containing proteins. J. Pharm. Biomed. Anal. 2010;52:672–679. doi: 10.1016/j.jpba.2010.02.035. [DOI] [PubMed] [Google Scholar]
- 9.Sparreboom A., Zhao M., Brahmer J.R., Verweij J., Baker S.D. Determination of docetaxel vehicle, polysorbate 80 in patients samples by liquid chromatography-tandem mass spectrometry. J. Chromatogr. B. 2002;773:183–190. doi: 10.1016/s1570-0232(02)00167-8. [DOI] [PubMed] [Google Scholar]
- 10.Baker S.D., Zhao M., He P., Carducci M.A., Verweij J., Sparreboom A. Simultaneous analysis of docetaxel and the formulation vehicle polysorbate 80 in human plasma by liquid chromatography/tandem mass spectrometry. Anal. Biochem. 2004;324:276–284. doi: 10.1016/j.ab.2003.09.038. [DOI] [PubMed] [Google Scholar]
- 11.#424:2000. Alltech Associates Deerfield, IL, ELSD 2000 Product Literature, Bulletin. [Google Scholar]
- 12.Nair L.M., Stephens N.V., Vincent S. Determination of polysorbate 80 in parenteral formulations by high-performance liquid chromatography and evaporative light scattering detection. J. Chromatogr. A. 2003;1012:81–86. doi: 10.1016/s0021-9673(03)01105-1. [DOI] [PubMed] [Google Scholar]


