Abstract
Light quality and quantity affect plant adaptation to changing light conditions. Certain wavelengths in the visible and near-visible spectrum are known to have discrete effects on plant growth and development, and the effects of red, far-red, blue, and ultraviolet light have been well described. In this report, an effect of green light on Arabidopsis (Arabidopsis thaliana) rosette architecture is demonstrated using a narrow-bandwidth light-emitting diode-based lighting system. When green light was added to a background of constant red and blue light, plants exhibited elongation of petioles and upward leaf reorientation, symptoms consistent with those observed in a shaded light environment. The same green light-induced phenotypes were also observed in phytochrome (phy) and cryptochrome (cry) mutant backgrounds. To explore the molecular mechanism underlying the green light-induced response, the accumulation of shade-induced transcripts was measured in response to enriched green light environments. Transcripts that have been demonstrated to increase in abundance under far-red-induced shade avoidance conditions either decrease or exhibit no change when green light is added. However, normal far-red light-associated transcript accumulation patterns are observed in cryptochrome mutants grown with supplemental green light, indicating that the green-absorbing form of cryptochrome is the photoreceptor active in limiting the green light induction of shade-associated transcripts. These results indicate that shade symptoms can be induced by the addition of green light and that cryptochrome receptors and an unknown light sensor participate in acclimation to the enriched green environment.
Plants are anchored organisms, so their survival depends on an exquisite sensitivity to changes in their ambient environment. Incident irradiation constitutes an important package of environmental information, as light quantity, quality, and duration all have important effects on plant growth and development (Chen et al., 2004; Spalding and Folta, 2005; Kami et al., 2010). For instance, the relative ratio of red to far-red light is an important indicator of shade or high plant density, as far-red light is readily transmitted through plant tissues in the canopy while red light is absorbed (Smith and Whitelam, 1997; Ballaré, 1999; Kim et al., 2005; Vandenbussche et al., 2005). Plants grown in enriched far-red or low blue light environments exhibit “shade avoidance syndrome,” a genetic program that alters plant form and gene expression to best suit the spectral shift induced by shade (Stamm and Kumar, 2010; Keuskamp et al., 2011). Like shade-abundant far-red light, green light also passes through plant tissue with greater efficiency than red or blue light (Klein, 1992). In this report, a custom, adjustable light-emitting diode (LED) lighting system was used to test the hypothesis that green light also informs the plant of shade conditions and induces adjustments in morphology characteristic of shade avoidance.
Green light responses can be divided into at least two categories: those that are cryptochrome dependent and those that are cryptochrome independent. Blue light responses have been shown to be opposed by green light acting through the neutral semiquinone flavin of the receptor’s chromophore (Banerjee et al., 2007; Bouly et al., 2007) or autophosphorylation of cryptochromes caused by a photolyase-like cyclic electron shuttle (Liu et al., 2010). This blue-green reversibility has been described for stem elongation and flowering acting through cryptochromes. Sellaro et al. (2010) recently reported that the hypocotyl length of Arabidopsis (Arabidopsis thaliana) seedlings decreased along with the increase of blue-green ratios in a cryptochrome-dependent manner. Other green light effects are independent of known sensory systems. Green light induces transient stem elongation in the etiolated seedling (Folta, 2004) and also drives a decrease in steady-state transcript accumulation of various plastid transcripts (Dhingra et al., 2006). Whether cryptochrome dependent or cryptochrome independent, either mechanism describes the effects of green wavebands that oppose blue light responses.
These studies may be expanded to other biologically relevant contexts where plants may be subjected to an enriched green environment. Such a state exists within a canopy or in plots of high plant density (Ballaré, 1999; Vandenbussche et al., 2005). While red and blue light are efficiently filtered from incident light by photosynthetic pigments, far-red and green light pass through and are scattered (Klein, 1992; Franklin, 2008). Far-red light is abundant in the understory, shifting the red to far-red (R:FR) ratio. Plants grown under a low R:FR ratio exhibit extensive remodeling of the body plan and transcriptome to accommodate growth in photosynthetically challenging conditions (Smith and Whitelam, 1997; Kim et al., 2005; Vandenbussche et al., 2005). The conspicuous changes in morphology include elongation of the petioles and a hyponastic deviation in their orientation, presumably to position photosynthetic surfaces above adjacent foliage (Kozuka et al., 2005). In the past decade, the molecular mechanisms of far-red-induced shade avoidance signaling have been well described. Multiple R:FR ratio-regulated genes, controlled by phytochromes, have been identified. HOMEOBOX FROM ARABIDOPSIS THALIANA (HAT4) and PHYTOCHROME INTERACTING FACTOR 3-LIKE1 (PIL1) are direct targets of the phytochrome signaling system that are induced during shade avoidance responses. The accumulation of these two transcripts is quickly and reversibly regulated by simulated shade (Carabelli et al., 1996; Salter et al., 2003). A description of the behavior of these genes in response to an enriched green light environment may also be informative, especially in delineating similarities and differences between far-red- and green-induced shade responses.
The experiments presented in this report utilize narrow-bandwidth visible LED light mixtures to test the effect of green light on rosette architecture. The study utilizes Arabidopsis plants, chosen for their compact growth, well-characterized shade responses, and availability of photosensory mutants. The molecular mechanism underlying the response to green light was examined using mutants and by an evaluation of changes in gene expression compared with far-red-mediated shade responses. The results indicate that while plants maintained under blue and red light exhibit the normal prone rosette architecture, addition of green light to the mix paradoxically induces a low-light growth habit resembling that found under shaded conditions.
RESULTS
Addition of Green Light Induces a Shaded Appearance
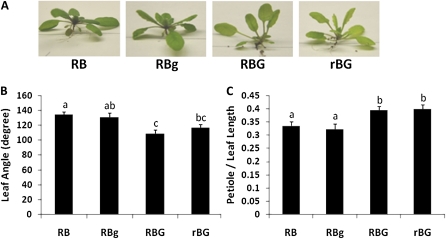
A narrow-bandwidth LED-based light platform was used to test the hypothesis that green light could induce shade effects in plants grown under blue and red light. Arabidopsis seeds were planted on soil, stratified, and then germinated and grown under white light for 3 weeks. Plants were then transferred to experimental conditions. In the first three treatments, red and blue light fluence rates were kept constant and two fluence rates of green light were added. The baseline treatment for comparison is 50 μmol m−2 s−1 red light and 40 μmol m−2 s−1 blue light (RB). Green light was added to the RB background at 10 μmol m−2 s−1 (RBg) and 40 μmol m−2 s−1 (RBG) to test if green-induced effects were fluence rate dependent. A fourth treatment was conducted at 40 μmol m−2 s−1 green light (as in RBG) while decreasing red light (rBG) to keep photosynthetically active radiation identical to other treatments. Examples of representative wild-type Arabidopsis (ecotype Columbia [Col-0]) plants grown under the different light treatments are presented in Figure 1A. The morphological adaptations to an added green light environment were conspicuous in RBG and rBG conditions within 5 d of transfer. Plant morphology was similar to that of plants subjected to low red and high far-red environments, presenting the hallmarks of shade avoidance response while being grown under an enriched green light environment (Fig. 1).
Figure 1.
Supplemental green light induces a shade response in wild-type Arabidopsis Col-0. Wild-type (Col-0) Arabidopsis plants were grown under white light for approximately 3 weeks and then transferred to one of four light treatments: 50 μmol m−2 s−1 red and 40 μmol m−2 s−1 blue LED light (RB); 50 μmol m−2 s−1 red, 40 μmol m−2 s−1 blue, and 10 μmol m−2 s−1 green light (RBg); 50 μmol m−2 s−1 red, 40 μmol m−2 s−1 blue, and 40 μmol m−2 s−1 green light (RBG); or 20 μmol m−2 s−1 red, 40 μmol m−2 s−1 blue, and 40 μmol m−2 s−1 green light (rBG) for 3 to 5 d. Individual plant rosettes were dissected, and conspicuous leaf attributes were quantified. A, Single representative plants harvested from the different light treatments. B, Mean leaf angle of plants grown in the four light conditions. Leaf angle represents the number of degrees between the third pair of leaves. C, Mean petiole length as a percentage of total leaf length of different light-treated plants. The measurements in B and C were derived from the third true leaves from eight to 10 individual plants. Error bars represent se. Different letters represent statistically different means (P < 0.05). [See online article for color version of this figure.]
A series of morphological parameters, including leaf angle, leaf length, leaf blade length, petiole length, and leaf blade area, were measured in the third pair of true leaves. Eight to 10 plants were measured in three independent biological replicates, with similar results observed over many independent trials in different growth chambers. The most conspicuous differences between RB and RBG plants were leaf angle (Fig. 1B) and petiole length as a function of total leaf length (Fig. 1C). Leaf angle is reported as the absolute angle of the third pair of true leaves. Therefore, increasing inclination results in a lower value. The leaf angle in RBg plants decreased only 2% (3.5°) compared with that of control (RB) plants. However, the leaf angles of RBG and rBG plants decreased 19% (25.9°) and 13% (17.8°), respectively (P < 0.05). These results indicate that the addition of green light induced a change in leaf orientation of wild-type Arabidopsis plants.
The ratio of petiole length to total leaf length was also affected by the addition of green light to the constant RB background (Fig. 1C). The data are presented as petiole length as a function of total leaf length, because it is a dependable indicator of the phenomenon among all genotypes studied. The petiole represented about 33% of the total leaf length under RB and RBg conditions. Under RBG and rBG conditions, the petiole increased to 40% of the total leaf length (significant at P < 0.05).
In the analyses presented here, the fluence rate of RB was kept constant and green was added. Thus, increasing the green component yielded a simultaneous increase in total fluence rate. To determine whether the changes seen were due to an increase in the total fluence rate, the fourth light treatment was designed. This treatment maintained blue and green as in the RBG treatment, and the red component was decreased so that rBG approached the fluence rate of RB, keeping photosynthetically active radiation equivalent in both conditions. The effects observed in rBG plants were similar to those observed in RBG plants. To further test the possibility that the shade avoidance responses of rBG plants were due to the reduced red component, plants grown under RB and rB conditions were compared. The results demonstrate that lowering the red component between RB and rB conditions did not affect rosette architecture (Supplemental Fig. S1).
The Green Response Persists in cry and phy Mutants
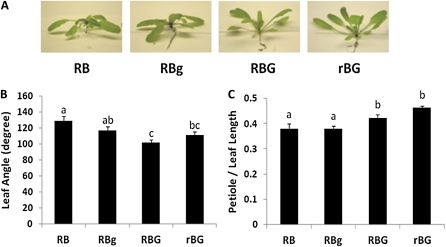
Various light-induced changes in plant morphology have been ascribed to green light. Green light responses are either cryptochrome dependent (Banerjee et al., 2007; Bouly et al., 2007) or persist in all mutant backgrounds tested, suggesting an unknown receptor (Folta, 2004; Dhingra et al., 2006). To test if the morphological changes observed are mediated by a known class of light sensors, the experiments in Figure 1 were repeated using cryptochrome (cry) and phytochrome (phy) mutant plants. The cry1cry2 mutants exhibited a response similar to wild-type plants (Fig. 2A). Compared with the RB condition, the leaf angle decreased 9% in RBg, 14% in RBG, and 21% in rBG (Fig. 2B). Similarly, plants in RB and RBg conditions exhibited petioles that measured 38% of their total leaf length, while under RBG and rBG conditions, the percentages of petiole to total leaf length increased to 42% and 46%, respectively (Fig. 2C).
Figure 2.
Supplemental green light induces a shade response in the Arabidopsis cry1cry2 mutant. Arabidopsis cry1cry2 plants were grown and treated in the same conditions used in Figure 1. A, Representative mutant plants in different light treatments. B, Mean leaf angle of cry1cry2 plants grown in the four light conditions. Leaf angle represents the number of degrees between the third pair of leaves. C, Mean petiole length as a percentage of total leaf length of different light-treated plants. The measurements in B and C were derived from the third true leaves from eight to 10 individual plants. Error bars represent se. Different letters represent statistically different means (P < 0.05). [See online article for color version of this figure.]
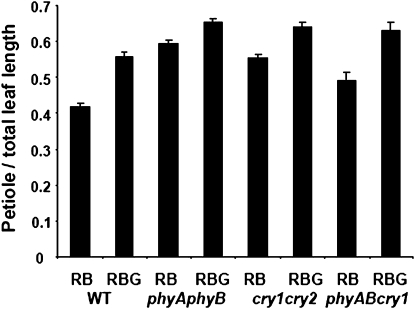
Additional experiments were conducted under conditions that enhanced the effect of the treatment on petiole elongation. In these experiment, plants were grown under 70 μmol m−2 s−1 red light and 20 μmol m−2 s−1 blue light (RB) or identical conditions supplemented with 20 μmol m−2 s−1 green light (RBG). The petiole and leaf length and relative leaf blade area (Fig. 3; Supplemental Fig. S2) were measured for the second true leaves of these mutants. Removal of PHYA and PHYB or CRY1 and CRY2 receptors consistently and significantly amplified the effects of green light, even though the mutation itself resulted in an exaggeration of petiole length compared with wild-type plants. The phyAphyBcry1 triple mutant was also tested and maintained the green light response. The addition of green wavebands resulted in an additional increase in petiole length.
Figure 3.
Supplemental green light effects are maintained in photoreceptor mutants. The effect of green light was tested in photoreceptor mutant backgrounds and compared with wild-type (WT; Col-0) plants. The phyAphyB, cry1cry2, and phyAphyBcry1 (phyABcry1) mutants were grown under RB and RBG conditions, their rosettes were dissected, and leaf attributes were quantified. A, Ratio of the average petiole length compared with total leaf length. B, Relative leaf blade area of photoreceptor mutants compared with wild-type plants. All measurements were obtained from the second true leaves of at least 19 individual plants. Error bars represent se. All differences between RB and RBG were significant within each genotype (P < 0.05).
Analysis of Shade-Induced Transcripts
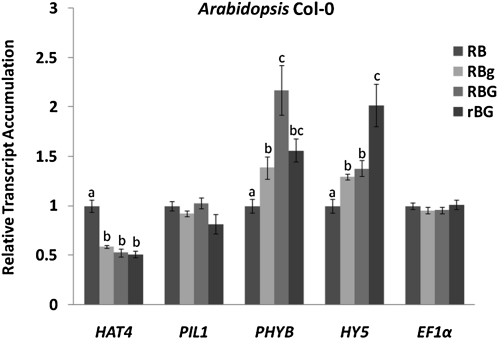
To further explore the mechanism of green-induced shade avoidance and also test the relationship between green and far-red responses mediated by phytochromes, the expression of genes known to be affected by far-red light was quantified using real-time quantitative (q)PCR. The transcripts associated with HAT4, PIL1, and PHYB are strongly induced by phytochrome under low R:FR conditions (Devlin et al., 2003). Plants were treated in the same four light conditions as used in Figure 1, and then total RNA was prepared and analyzed as described in “Materials and Methods.” At least two independent biological replicates were tested, providing consistent gene expression patterns. In wild-type plants, the relative steady-state transcript levels of both HAT4 and PIL1 did not increase in the enriched green light environment. Instead, a marked decrease in HAT4 mRNA was observed. Consistent with shade symptoms, the PHYB transcript increased in abundance in RBg and RBG conditions. ELONGATED HYPOCOTYL5 (HY5), a transcript strongly affected by light, was included for comparisons along with Elongation Factor1α (EF1α), a transcript that is not expected to change between conditions (Fig. 4).
Figure 4.
Shade avoidance-related gene expression levels in wild-type (Col-0) plants grown in various amounts of green light. Plants were grown and treated in the same conditions described in Figure 1. The gene expression levels were quantified using real-time qPCR. Relative transcript values were normalized to RB conditions. Actin2 was used as a reference gene. Different letters represent statistically different means (P < 0.05). FW, Fresh weight.
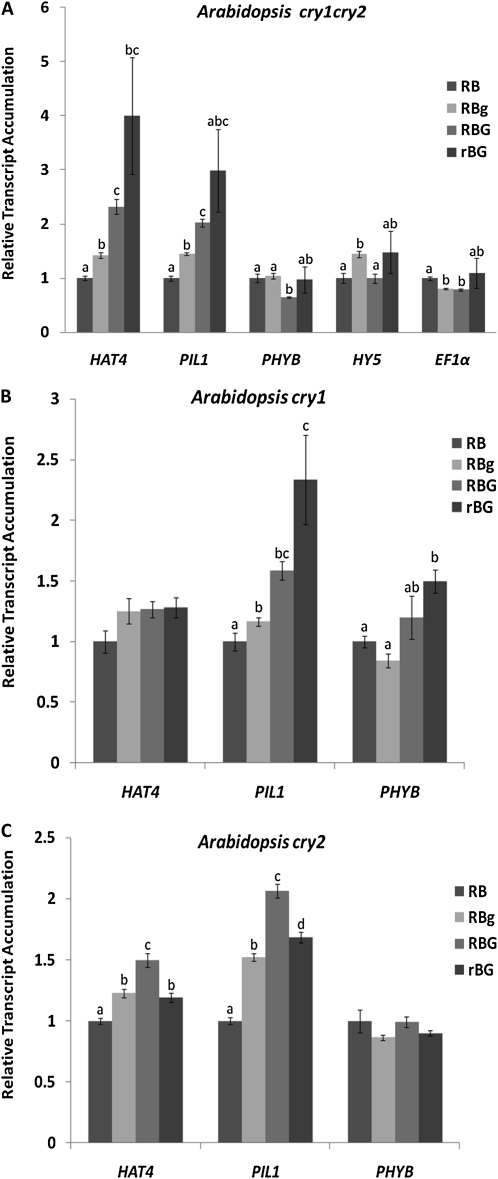
Due to the known influence of green light via cryptochromes, gene expression patterns were also assessed in the cry1cry2 mutant background (Fig. 5A). In cry1cry2 plants, the addition of green light caused an increase in HAT4 and PIL1 transcript levels, a pattern consistent with far-red treatment, even in the absence of far-red light. This trend is the opposite of what was observed for wild-type Arabidopsis seedlings. The strong induction of PHYB and HY5 was also not observed. To further determine whether CRY1, CRY2, or both together contribute to the changes in gene expression, cry1 and cry2 single mutant plants were grown in the same experimental light conditions and analyzed. The single mutants exhibited a HAT4 and PIL1 accumulation pattern similar to the cry1cry2 mutant, indicating that both CRY1 and CRY2 affect the green-specific responses and that their effects are synergistic (Fig. 5, B and C). The effects of the mutations on basal gene expression (RB conditions) were not always identical in the cry mutant backgrounds (Supplemental Fig. S3). While HAT4 levels are similar in cry mutants and wild-type plants, PIL1 levels are significant higher in cry1cry2 and cry1 mutants. These differences should be considered when interpreting the data in Figure 5.
Figure 5.
Shade avoidance-related gene expression levels in cry1cry2 (A), cry1 (B), and cry2 (C) mutants grown in different light treatments. Plants were grown and treated in the same conditions used in Figure 1. Gene expression levels were quantified using real-time qPCR. Transcript levels were normalized to the RB condition. Actin2 was used as a reference gene. Different letters represent statistically different means (P < 0.05).
The Green-Induced Shade Avoidance Response Is Attenuated in Shade-Associated Mutants hat4 and pil1
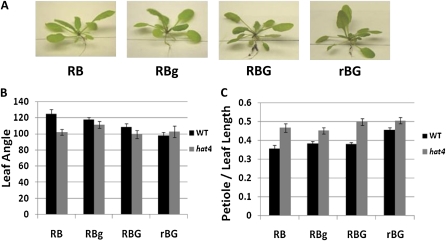
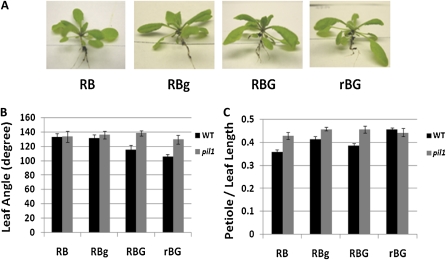
Because transcript accumulation was affected by green light in a cryptochrome-dependent manner, it was important to examine if there were differences in plant shade responses to green light in the associated mutants. The hat4 and pil1 mutants were treated in the same light conditions used in Figure 1. Wild-type plants were used as a positive control of green responses. Neither mutant exhibited shade avoidance responses in green-enriched conditions (Figs. 6 and 7).
Figure 6.
Supplemental green light does not induce a shade response in the Arabidopsis hat4 mutant. Arabidopsis hat4 and wild-type (Col-0) plants were grown and treated in the same conditions as in Figure 1. A, Representative hat4 mutant plants in different light treatments. B, Mean leaf angle of wild-type (Col-0) and hat4 plants grown in the four light conditions. Leaf angle represents the number of degrees between the third pair of leaves. C, Mean petiole length as a part of total leaf length from different light conditions. The measurements in B and C were derived from the third true leaves from at least eight individual plants. Error bars represent se. [See online article for color version of this figure.]
Figure 7.
Supplemental green light does not induce a shade response in the Arabidopsis pil1 mutant. Arabidopsis pil1 plants were grown and treated in the same conditions used in Figure 1. A, Representative pil1 mutant plants responding to different light treatments. B, Mean leaf angle of wild-type (Col-0) and pil1 plants grown in the four light conditions. Leaf angle represents the number of degrees between the third pair of leaves. C, Mean petiole length as a fraction of total leaf length under the different light conditions. The measurements in B and C were derived from the third true leaves from at least eight individual plants. Error bars represent se. [See online article for color version of this figure.]
DISCUSSION
When sunlight is filtered by a foliar canopy, red and blue light are selectively reduced, resulting in an enriched environment of far-red light. Careful examination of the spectrum transmitted through leaves shows that along with the strong decrease in R:FR ratio, there is an overall decrease in the fluence rate and an enrichment of green wavebands relative to blue and red (Folta and Maruhnich, 2007; Franklin, 2008). The goal of this work is to test if the relative enrichment of green light also affects the development of shade symptoms. Previous reports have shown a role for green light in leaf position changes (Mullen et al., 2006). In this work, green light was added to a constant background of red and blue light. The red and blue treatment alone was sufficient to maintain plants presenting little to no leaf inclination, that is, with leaves growing approximately parallel to the soil surface and perpendicular to incident illumination.
The results presented in Figure 1 show that the addition of green wavebands to a constant background of red and blue light causes leaves to lift toward the light source. Petioles become increasingly longer and leaves become pale, a suite of morphological changes consistent with shade avoidance syndrome. Based on the conventional understanding, increasing visible light should not induce a shade response. The test was performed in the absence of far-red light, as the red LED light source produces negligible output above 700 nm. Blue light levels were kept constant, as decreasing blue light also can induce shade avoidance symptoms (Pierik et al., 2004; Keuskamp et al., 2011).
The result is consistent with a growing body of evidence that green light signals oppose responses generated by the activation of blue and red photosensory pathways. The opposition of a normal light response by green light has been observed in other contexts. Green light delivered coincidently with blue light eliminates stomatal opening (Frechilla et al., 2000). The addition of green light to a red and blue background decreases seedling dry mass (Went, 1957). Green light also increases stem growth rate in the developing seedling (Folta, 2004), whereas all other wavebands (including far red) promote growth inhibition (Parks et al., 2001; Shinkle et al., 2004). The addition of green wavebands has been shown to reverse blue light-induced effects on hypocotyl elongation and anthocyanin accumulation in seedlings (Bouly et al., 2007) as well as to affect flowering (Banerjee et al., 2007). The results herein represent another example of how the addition of green light opposes responses induced by other visible wavelengths.
Some of the effects of green light have been attributed to green-induced reversal of blue light effects on the cryptochrome photoreceptors. Green light has been shown to attenuate the cryptochrome response by affecting the properties of the chromophore, switching it from an active semiquinone state to the fully reduced form of FADH− (Banerjee et al., 2007; Bouly et al., 2007). To test if the cryptochrome receptors are mediating the responses observed in these experiments, cryptochrome mutants were examined (Fig. 2). The mutants exhibited changes in morphology that were comparable with those observed in wild-type plants, indicating that the response observed is not the effect of cryptochrome inactivation. Similarly, phyAphyB mutants were tested for some of the responses to green and maintained changes consistent with a shade response (Fig. 3). The phyAphyBcry1 triple mutant also showed the response to enriched green light. It should be noted that all mutants exhibited a basal exaggeration of petiole length due to the lack of light input through these photomorphogenic systems. Even with a predisposition for elongate growth, the results presented in Figure 3 and Supplemental Figure S2 show that the green light effect is additive to the influence of the mutation, consistent with an interpretation that a separate system is mediating the response. The data in this report do not rule out the possibility that phytochromes C to E transduce the green response, yet it remains unlikely, because phytochrome activation would suppress shade symptoms under visible light.
An assessment of gene expression changes that accompany shade symptoms in an enriched green environment is also informative. The gene expression profiles elicited during far-red-induced shade responses have been well described and provide a means to examine the mechanism responsible for the green-induced effects. Several transcripts pivotal to the far-red response were examined. HAT4 and PIL1 are strongly induced during shade avoidance responses to far-red light (Devlin et al., 2003). HAT4 is a member of the homeodomain Leu zipper family of transcription factors, binding DNA via the 9-bp sequence CAATNATTG (Henriksson et al., 2005; Ciarbelli et al., 2008). Analysis of multiple phytochrome-deficient mutants revealed that HAT4 expression is redundantly suppressed by PHYB and PHYE (Franklin et al., 2003). PIL1 encodes a bHLH transcription factor and is a member of the PIF transcription factor family. It has been described to play an important negative role in long-term shade avoidance syndrome in a phyB background, aside from its effect on shade stimulation (Roig-Villanova et al., 2006). The transcript levels of HAT4 and PIL1 are well-described molecular signatures of the shade response. Together, they are excellent candidates to compare and contrast the effects of far-red and green light that have similar effects on morphology.
The accumulation patterns of HAT4 and PIL1 transcripts in an enriched green light environment were the opposite of those induced by far-red light (Fig. 4). With supplemental green light, steady-state levels of HAT4 transcripts actually decreased to approximately 50% of the levels observed under red and blue light alone. On the other hand, PHYB transcripts did accumulate with the addition of green light, consistent with the increases observed by Devlin et al. (2003) in response to far-red light. The HY5 transcript has been well described in photomorphogenic responses, yet it is not required for transducing shade-triggered signals (Roig-Villanova et al., 2006). Here, this transcript serves as an additional non-shade-associated message that is sensitive to changing light environments, and its levels also increase. An EF1α reference remained constant. These results indicate that although green-light-induced morphological changes were reminiscent of far-red-induced alterations, the signature gene expression events that accompany these changes were not observed. These findings support an interpretation that green light signals adjust plant form through a mechanism that is distinct from that which imparts far-red effects. This finding is consistent with the report from Mullen et al. (2006) indicating another signaling pathway involved in the control of leaf position aside from phytochromes. Mullen et al. (2006) demonstrated that leaf inclination in phyB as well as the triple mutants phyAphyBphyD and phyAphyBphyE is lower than that in darkness. They also observed that monochromatic green light induces changes in leaf position, a finding consistent with the results herein.
Examination of HAT4 and PIL1 gene expression changes in the cry1cry2 background implicates the cryptochromes in this shade response, but only at the level of gating shade-associated gene expression. Figure 2 shows that the green-induced shade symptoms are present in the cry1cry2 mutant. It would be expected that HAT4 and PIL1 transcript levels would likely follow the patterns observed in wild-type plants if the green signal followed the far-red mechanism. However, while HAT4 and PIL1 mRNA levels decrease after the addition of supplemental green light in wild-type seedlings, their accumulation in the cry1cry2 double mutant approximates the trends seen during far-red-induced shade avoidance (Fig. 5A). The same trends were observed in cry1 and cry2 single mutants (Fig. 5, B and C). These findings indicate that the cryptochromes actively block the development of shade-driven gene expression profiles in the absence of far-red light. In this case, the wild-type seedling adopts the morphology of a shaded seedling, but the conspicuous alterations in architecture are uncoupled from the usual changes in gene expression by a cryptochrome-dependent mechanism.
These results are exciting because they illustrate a role for the green-absorbing form of cryptochrome to actively drive a change in physiology. While green light responses mediated through cryptochromes have been described to reverse blue light responses, in this case, the green light-absorbing form of both of the cryptochrome receptors is active in blocking the accumulation of two shade-inducible transcripts. This finding is another unique facet of this study. If green light was simply reversing the blue response, then the same phenotype should be observed in cry mutants in the absence of green light (such as in RB conditions). However, this is not observed. The induction of HAT4 and PIL1 in the absence of far-red signals requires green light and the absence of cryptochrome receptors. These data indicate that the green light triggers cryptochrome to actively gate at least facets of the transcriptome response normally induced by far-red light. The attenuated shade responses of hat4 and pil1 mutants grown in green-enriched conditions indicate that the green signaling pathway merges with the far-red signaling pathway upstream of, or at, HAT4 and PIL1 (Figs. 6 and 7).
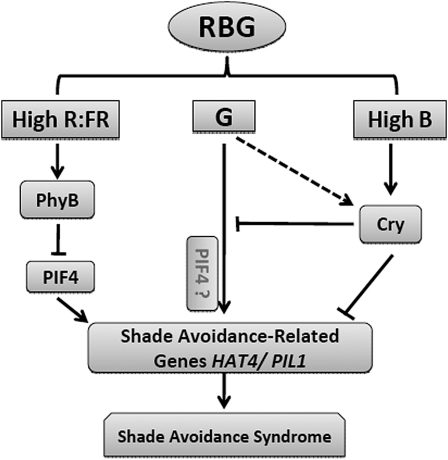
These data may be synthesized into a cogent model (Fig. 8). Blue and red light activate cryptochromes and phytochromes to present normal prone leaf position. The addition of green light induces an upward orientation of leaves and an elongation of petioles. These responses appear to occur independently of phytochromes and cryptochromes for two reasons. First, the responses persist in the mutants tested, and second, visible light transduced through these systems should not generate a shaded morphology. One possible exception is if green light is negating the effect of cryptochromes, but again, analysis of cry mutant plants does not support this interpretation (Fig. 2). The change in inclination and/or petiole elongation in the cry and phy mutant backgrounds indicates that green signals are due to an unknown role of another phytochrome or perhaps a novel light sensor.
Figure 8.
A model depicting green light influence in far-red-independent shade avoidance responses. Green light signals induce a shaded plant morphology that is independent of cryptochromes and phytochromes A and B. Simultaneously, green signals induce gene expression patterns that resemble those induced by far-red light, except that cryptochrome receptors appear to block the changes in gene expression in the presence of green light and the absence of far-red light. The model shows that multiple light receptors coordinate adaptation to a light environment based on input from several portions of the light spectrum.
The findings of this study show that the addition of green wavebands to a background of blue and red light induces the familiar shaded plant architecture. These results are significant in that symptoms develop with increasing fluence rate, a finding that is in opposition to what is known about the generation of shade phenotypes by low-light environments. Gene expression changes distinguish the green response from the far-red response and implicate the green-absorbing form of cryptochromes to connect green control of shade-induced transcripts that are normally induced by low R:FR. While surprising at first, these results show that plants maintain additional means to adapt to a changing light environment and remind us that plants are sensitive to a broad series of inputs to shape plant form and function.
MATERIALS AND METHODS
Plant Materials and Growth Conditions
The genotypes used in this study were Arabidopsis (Arabidopsis thaliana Col-0), cry1cry2 mutant (cry1-304 crossed to cry2-1), phyAphyB mutant (phyB-5 crossed into a homozygous phyA [SALK_121744] background with phenotypic and molecular verification of double mutation), and hat4 (SALK_106790) and pil1 (SALK_043937) homozygous T-DNA mutants (ordered from the Arabidopsis Biological Resource Center). Plants were grown in plastic trays in soilless medium (ProMix BX). Seeds were distributed evenly to receive equal light distribution and stratified at 4°C for 72 h. Seedlings were grown under white fluorescent light (approximately 100 μmol m−2 s−1) until the seedlings presented four pairs of true leaves (typically 21–28 d). At this point, the plants were transferred to LED chambers featuring the experimental light conditions for 3 to 5 d. The temperature in the LED chambers keep constant at room temperature (22°C ± 1.5°C). Plants were watered approximately three times per week under white fluorescent light and every other day under LED arrays with 0.1× Hoagland solution. Plants were grown under constant illumination.
Light Sources and Treatments
Light treatments were generated using LED light. The peak wavelengths of red, blue, and green light are 630, 470, and 525 nm, respectively. The emission spectrum of all light sources is viewable online at http://arabidopsisthaliana.com/lightsources/. Four different combinatorial light treatments were established for these experiments. The first treatment consisted of 50 μmol m−2 s−1 red LED light and 40 μmol m−2 s−1 blue LED light. The second and third treatments consisted of the same red-blue treatment supplemented with 10 and 40 μmol m−2 s−1 green LED light, respectively. The fourth treatment was of comparable fluence rate with the first treatment (20 μmol m−2 s−1 red light, 40 μmol m−2 s−1 blue light, and 40 μmol m−2 s−1 green light).
Morphological Measurements
To observe the effect of green light on rosette architecture, several morphological parameters were measured, including leaf angle, petiole length, leaf length, and leaf blade area. Whole plants were carefully removed from the growing medium, cleaned of particulate matter, and then flattened on the adhesive side of black electrical tape. Samples were imaged at 600-dpi resolution on a standard flatbed scanner and measured using the UTHSCSA Image Tool (version 3.0 for Windows) with comparisons with an adjacent size standard. For experimental repeats, at least two sets of eight to 10 plants were measured for each treatment.
RNA Preparation and Real-Time qPCR
The whole plants were harvested into liquid nitrogen and stored at –80°C prior to RNA isolation. Total RNA was isolated for using the cetyl-trimethyl-ammonium bromide-based method (Chang et al., 1993). The reverse transcription was performed using the TaqMan transcriptase kit (Applied Biosystems). Quantitative real-time PCR was performed with the StepOne Plus system (Applied Biosystems). TaqMan primers and probes were designed by Primer Express 2.x software (Applied Biosystems). The sequences of primers and probes are listed in Table I. PCR mixtures were in the following thermal profile: 2 min at 50°C, 10 min at 95°C, and 40 cycles of 15 s at 95°C and 1 min at 60°C. Actin2 was used as the internal control. The relative mRNA levels were calculated using the 2−DDCT comparative method (Livak and Schmittgen, 2001; Sehringer et al., 2005).
Table I.
TaqMan primer and probe sequences used in real-time qPCR
| Gene | TaqMan Primer/Probe Sequences (5′→3′) | Direction |
| HAT4 | CACATGAGCCCACCCACTACT | Forward |
| GGGACCGACACGTGTTCAC | Reverse | |
| TGACCATGTGCCCTTC | Probe | |
| PIL1 | TGCCTTCGTGTGTTTCTCAGA | Forward |
| AGGCGGACGCAGACTTTG | Reverse | |
| TCAGGCTACTTCTTTTACTCA | Probe | |
| PHYB | GCGATTGGTGGCCAAGATA | Forward |
| AAACTTCCCATTGCGGTCAA | Reverse | |
| ATAAGTTCCCTTTCCCATTC | Probe | |
| HY5 | CAAGCAGCGAGAGGTCATCA | Forward |
| ATCGCTTTCAATTCCTTCTTTGA | Reverse | |
| CTCTGCTCCACATTTG | Probe | |
| EF1α | ACGGTTACGCCCCAGTTCT | Forward |
| CGCCTGTCAATCTTGGTCAA | Reverse | |
| TGCCACACCTCTCACATTGCAGTCAA | Probe | |
| Actin2 | TCGGTGGTTCCATTCTTGCT | Forward |
| GCTTTTTAAGCCTTTGATCTTGAGAG | Reverse | |
| AGCACATTCCAGCAGATGTGGATCTCCAA | Probe |
Sequence data from this article can be found in the GenBank/EMBL data libraries under accession numbers NM_117780 (HAT4), NM_130265 (PIL1), NM_121164 (HY5), NM_127435 (PHYB), NM_125432 (EF1α), and NM_112764 (Actin2).
Supplemental Data
The following materials are available in the online version of this article.
Supplemental Figure S1. Decreasing the red light fluence rate in an RB background does not affect rosette architecture.
Supplemental Figure S2. Supplemental green light effects are maintained in photoreceptor mutants.
Supplemental Figure S3. Shade avoidance-related gene expression levels in wild-type (Col-0), cry1cry2, cry1, and cry2 plants grown in the RB light condition.
Acknowledgments
We thank Dr. Mithu Chatterjee and Lauren Coleman for technical assistance and Drs. Bala Rathinasabapathi and Karen Koch for helpful discussion and guidance. We also thank Maureen Clancy for evaluation of the manuscript.
References
- Ballaré CL. (1999) Keeping up with the neighbours: phytochrome sensing and other signalling mechanisms. Trends Plant Sci 4: 97–102 [DOI] [PubMed] [Google Scholar]
- Banerjee R, Schleicher E, Meier S, Viana RM, Pokorny R, Ahmad M, Bittl R, Batschauer A. (2007) The signaling state of Arabidopsis cryptochrome 2 contains flavin semiquinone. J Biol Chem 282: 14916–14922 [DOI] [PubMed] [Google Scholar]
- Bouly JP, Schleicher E, Dionisio-Sese M, Vandenbussche F, Van Der Straeten D, Bakrim N, Meier S, Batschauer A, Galland P, Bittl R, et al. (2007) Cryptochrome blue light photoreceptors are activated through interconversion of flavin redox states. J Biol Chem 282: 9383–9391 [DOI] [PubMed] [Google Scholar]
- Carabelli M, Morelli G, Whitelam G, Ruberti I. (1996) Twilight-zone and canopy shade induction of the Athb-2 homeobox gene in green plants. Proc Natl Acad Sci USA 93: 3530–3535 [DOI] [PMC free article] [PubMed] [Google Scholar]
- Chang S, Puryear J, Cairney J. (1993) Simple and efficient method for isolating RNA from pine trees. Plant Mol Biol Rep 11: 113–116 [Google Scholar]
- Chen M, Chory J, Fankhauser C. (2004) Light signal transduction in higher plants. Annu Rev Genet 38: 87–117 [DOI] [PubMed] [Google Scholar]
- Ciarbelli AR, Ciolfi A, Salvucci S, Ruzza V, Possenti M, Carabelli M, Fruscalzo A, Sessa G, Morelli G, Ruberti I. (2008) The Arabidopsis homeodomain-leucine zipper II gene family: diversity and redundancy. Plant Mol Biol 68: 465–478 [DOI] [PubMed] [Google Scholar]
- Devlin PF, Yanovsky MJ, Kay SA. (2003) A genomic analysis of the shade avoidance response in Arabidopsis. Plant Physiol 133: 1617–1629 [DOI] [PMC free article] [PubMed] [Google Scholar]
- Dhingra A, Bies DH, Lehner KR, Folta KM. (2006) Green light adjusts the plastid transcriptome during early photomorphogenic development. Plant Physiol 142: 1256–1266 [DOI] [PMC free article] [PubMed] [Google Scholar]
- Folta KM. (2004) Green light stimulates early stem elongation, antagonizing light-mediated growth inhibition. Plant Physiol 135: 1407–1416 [DOI] [PMC free article] [PubMed] [Google Scholar]
- Folta KM, Maruhnich SA. (2007) Green light: a signal to slow down or stop. J Exp Bot 58: 3099–3111 [DOI] [PubMed] [Google Scholar]
- Franklin KA. (2008) Shade avoidance. New Phytol 179: 930–944 [DOI] [PubMed] [Google Scholar]
- Franklin KA, Praekelt U, Stoddart WM, Billingham OE, Halliday KJ, Whitelam GC. (2003) Phytochromes B, D, and E act redundantly to control multiple physiological responses in Arabidopsis. Plant Physiol 131: 1340–1346 [DOI] [PMC free article] [PubMed] [Google Scholar]
- Frechilla S, Talbott LD, Bogomolni RA, Zeiger E. (2000) Reversal of blue light-stimulated stomatal opening by green light. Plant Cell Physiol 41: 171–176 [DOI] [PubMed] [Google Scholar]
- Henriksson E, Olsson AS, Johannesson H, Johansson H, Hanson J, Engström P, Söderman E. (2005) Homeodomain leucine zipper class I genes in Arabidopsis: expression patterns and phylogenetic relationships. Plant Physiol 139: 509–518 [DOI] [PMC free article] [PubMed] [Google Scholar]
- Kami C, Lorrain S, Hornitschek P, Fankhauser C. (2010) Light-regulated plant growth and development. Curr Top Dev Biol 91: 29–66 [DOI] [PubMed] [Google Scholar]
- Keuskamp DH, Sasidharan R, Vos I, Peeters AJ, Voesenek LA, Pierik R. (2011) Blue light-mediated shade avoidance requires combined auxin and brassinosteroid action in Arabidopsis seedlings. Plant J 67: 208–217 [DOI] [PubMed] [Google Scholar]
- Kim GT, Yano S, Kozuka T, Tsukaya H. (2005) Photomorphogenesis of leaves: shade-avoidance and differentiation of sun and shade leaves. Photochem Photobiol Sci 4: 770–774 [DOI] [PubMed] [Google Scholar]
- Klein RM. (1992) Effects of green light on biological systems. Biol Rev Camb Philos Soc 67: 199–284 [DOI] [PubMed] [Google Scholar]
- Kozuka T, Horiguchi G, Kim GT, Ohgishi M, Sakai T, Tsukaya H. (2005) The different growth responses of the Arabidopsis thaliana leaf blade and the petiole during shade avoidance are regulated by photoreceptors and sugar. Plant Cell Physiol 46: 213–223 [DOI] [PubMed] [Google Scholar]
- Liu B, Liu H, Zhong D, Lin C. (2010) Searching for a photocycle of the cryptochrome photoreceptors. Curr Opin Plant Biol 13: 578–586 [DOI] [PMC free article] [PubMed] [Google Scholar]
- Livak KJ, Schmittgen TD. (2001) Analysis of relative gene expression data using real-time quantitative PCR and the 2(-Delta Delta C(T)) method. Methods 25: 402–408 [DOI] [PubMed] [Google Scholar]
- Mullen JL, Weinig C, Hangarter RP. (2006) Shade avoidance and the regulation of leaf inclination in Arabidopsis. Plant Cell Environ 29: 1099–1106 [DOI] [PubMed] [Google Scholar]
- Parks BM, Folta KM, Spalding EP. (2001) Photocontrol of stem growth. Curr Opin Plant Biol 4: 436–440 [DOI] [PubMed] [Google Scholar]
- Pierik R, Whitelam GC, Voesenek LA, de Kroon H, Visser EJ. (2004) Canopy studies on ethylene-insensitive tobacco identify ethylene as a novel element in blue light and plant-plant signalling. Plant J 38: 310–319 [DOI] [PubMed] [Google Scholar]
- Roig-Villanova I, Bou J, Sorin C, Devlin PF, Martínez-García JF. (2006) Identification of primary target genes of phytochrome signaling: early transcriptional control during shade avoidance responses in Arabidopsis. Plant Physiol 141: 85–96 [DOI] [PMC free article] [PubMed] [Google Scholar]
- Salter MG, Franklin KA, Whitelam GC. (2003) Gating of the rapid shade-avoidance response by the circadian clock in plants. Nature 426: 680–683 [DOI] [PubMed] [Google Scholar]
- Sehringer B, Zahradnik HP, Deppert WR, Simon M, Noethling C, Schaefer WR. (2005) Evaluation of different strategies for real-time RT-PCR expression analysis of corticotropin-releasing hormone and related proteins in human gestational tissues. Anal Bioanal Chem 383: 768–775 [DOI] [PubMed] [Google Scholar]
- Sellaro R, Crepy M, Trupkin SA, Karayekov E, Buchovsky AS, Rossi C, Casal JJ. (2010) Cryptochrome as a sensor of the blue/green ratio of natural radiation in Arabidopsis. Plant Physiol 154: 401–409 [DOI] [PMC free article] [PubMed] [Google Scholar]
- Shinkle JR, Atkins AK, Humphrey EE, Rodgers CW, Wheeler SL, Barnes PW. (2004) Growth and morphological responses to different UV wavebands in cucumber (Cucumis sativum) and other dicotyledonous seedlings. Physiol Plant 120: 240–248 [DOI] [PubMed] [Google Scholar]
- Smith H, Whitelam GC. (1997) The shade avoidance syndrome: multiple responses mediated by multiple phytochromes. Plant Cell Environ 20: 840–844 [Google Scholar]
- Spalding EP, Folta KM. (2005) Illuminating topics in plant photobiology. Plant Cell Environ 28: 39–53 [Google Scholar]
- Stamm P, Kumar PP. (2010) The phytohormone signal network regulating elongation growth during shade avoidance. J Exp Bot 61: 2889–2903 [DOI] [PubMed] [Google Scholar]
- Vandenbussche F, Pierik R, Millenaar FF, Voesenek LA, Van Der Straeten D. (2005) Reaching out of the shade. Curr Opin Plant Biol 8: 462–468 [DOI] [PubMed] [Google Scholar]
- Went FW. (1957) The Experimental Control of Plant Growth. Chronica Botanica, Waltham, MA [Google Scholar]


