Abstract
PURPOSE
Because patient-doctor continuity has been measured in its longitudinal rather than its personal dimension, evidence to show that seeing the same doctor leads to better patient care is weak. Existing relational measures of patient-doctor continuity are limited, so we developed a new patient self-completion instrument designed to specifically measure patient-doctor depth of relationship.
METHODS
Draft versions of the questionnaire were tested with patients in face-to-face interviews and 2 rounds of pilot testing. The final instrument was completed by patients attending routine appointments with their general practitioner, and some were sent a follow-up questionnaire. Scale structure, validity, and reliability were assessed.
RESULTS
Face validity of candidate items was confirmed in interviews with 11 patients. Data from the pilot rounds 1 (n = 375) and 2 (n = 154) were used to refine and shorten the questionnaire. The final instrument comprised a single scale of 8 items and had good internal reliability (Cronbach’s α = .93). In the main study (N = 490), seeing the same doctor was associated with deep patient-doctor relationships, but the relationship appeared to be nonlinear (overall adjusted odds ratio = 1.5; 95% CI, 1.2–1.8). Test-retest reliability in a sample of participants (n = 154) was good (intracluster correlation coefficient 0.87; 95% CI, 0.53–0.97).
CONCLUSIONS
The Patient-Doctor Depth-of-Relationship Scale is a novel, conceptually grounded questionnaire that is easy for patients to complete and is psychometrically robust. Future research will further establish its validity and answer whether patient-doctor depth of relationship is associated with improved patient care.
Keywords: Continuity of patient care, patient-physician relationship, family practice, questionnaires, outcome and process assessment (health care)
INTRODUCTION
Continuity of patient care is one of the defining characteristics of general practice.1 It is a multifaceted concept, but in primary care it is “mainly viewed as the relationship between a single practitioner and a patient that extends beyond specific episodes of illness or disease.”2 Research has consistently linked continuity with patient satisfaction,3 but evidence of its impact on patient outcomes is mixed.4
The absence of research showing that continuity improves patient care may be at least in part because of how it has been defined and measured. The continuity literature emphasizes the interpersonal aspects of ongoing patient-doctor relationships (personal continuity), yet most studies of continuity have operationalized it in terms of the number or proportion of patient visits to the same doctor (longitudinal continuity). Seeing the same doctor may promote but does not guarantee the quality or depth of relationship between patient and doctor,5 and patient-doctor relationships are not necessarily disrupted by interruptions in continuity.6
In an earlier systematic review of qualitative studies of patients’ perspectives on patient-doctor relationships,7 we described 3 key elements: longitudinal care (seeing the same doctor), consultation experiences (patients’ encounters with the doctor), and patient-doctor depth of relationship. Most instruments measuring patient-doctor relationships focus on the experience of individual consultations rather than on characteristics specific to the ongoing relationship, such as knowledge or trust. Existing measures that attempt to examine these issues are unsatisfactory because they were either not developed in primary care, focus on a single element of the relationships (most notably trust), or try to quantify them through the use of a single global question, such as, “How well do you know this doctor?”8,9 Single questions should not be relied upon for psychological constructs as complex as patient-doctor depth of relationship, because the concept may be poorly defined in many people’s minds, and the wording of the item may be misunderstood. In these situations, multiple, deliberately chosen items provide a better reflection of underlying views and improve the reliability with which the underlying construct is measured.10
This article describes the development of a new scale designed to specifically measure depth of the patient-doctor relationship in primary care from the patient’s perspective. We present initial data on the scale’s validity and reliability and suggest this instrument might provide a more meaningful way to examine the value of patient-doctor continuity to care processes and patient outcomes.
METHODS
There were 2 main phases to the study. In the first development phase, potential question items were generated and tested in face-to-face interviews and 2 pilot rounds. In the second validation phase (the main study), we confirmed the internal reliability of the scale and examined construct validity and test-retest reliability.
The research was in general practitioners’ practices in Bristol, England, and the surrounding area. Data collection took place between August 2005 and January 2008. All patient participants were aged 16 years or older and able to self-complete a questionnaire. Ethical approval was obtained from Southmead Research Ethics Committee.
Candidate Question Items and Face-to-Face Interviews
Candidate question items were generated around the 43 elements of patient-doctor depth of relationship previously identified7: knowledge, trust, loyalty, and regard. Some were based on previously published doctor-patient relationship questionnaires and others were new.
Several draft versions of the questionnaire were tested in face-to-face interviews with patients recruited from 4 practices. We asked participants to comment on the scope and acceptability of the draft question items11 and to think aloud as they answered questions—prompting them to explain their thinking and choices.12,13 The draft questionnaires were modified in the light of patients’ comments, and further interviews were carried out until no new issues emerged.
Pilot Rounds
The draft questionnaire underwent 2 rounds of pilot testing in 7 practices. Receptionists handed out questionnaires to 100 consecutive patients in each practice.
After considering both qualitative and quantitative data, we modified and shortened the questionnaire after each round of testing. We aimed to achieve parsimony without sacrificing face or content validity. Items were selected according to favorable completion rates, distribution of responses and inter-item correlation, as well as with reference to the conceptual model and factor analysis findings. Most changes were made after the first pilot round, meaning the second pilot round was primarily a confirmatory step.
Main Study
One general practitioner from each of the 31 practices in the main study, which were recruited nonrandomly, volunteered to take part. On the day of attendance, patients who saw this doctor were asked to complete a questionnaire that included the General Practice Assessment Questionnaire (GPAQ) communication scale14 and Patient-Doctor Depth-of-Relationship Scale. At this time, consent for medical record review was requested from the patients. A follow-up questionnaire was posted to a subsample of patients (from practices 1 to 14) approximately 2 weeks later. Construct validity was examined by comparing patient-doctor depth-of-relationship scores with longitudinal care, obtained from patients’ electronic medical records.
Analysis
All analysis was performed using Stata 10.1 (StataCorp, College Station, Texas). Questionnaire data were entered twice and compared to identify any transcription errors.
Patient-Doctor Depth-of-Relationship Scale
Responses to draft question items were inspected for missing data, low discriminatory power, and ceiling effects. To assist in the development of the scale and selection of items, we calculated Cronbach’s α and performed a principal factor analysis. According to convention, we used eigenvalues of greater than 1 and the Cattell scree test to select the number of factors. Interpretation of the initial factor structure was aided by using varimax (orthogonal) rotation. We assessed test-retest reliability using the Bland-Altman method15 and by calculating the intracluster correlation coefficient with exact confidence intervals.
Patient-Doctor Longitudinal Care
Longitudinal care was measured as the number of consultations (NOC) with the study general practitioner, because it was the most appropriate way to explore the hypothesized association between seeing the same doctor and depth of relationship. The continuity-defining period was defined as 12 months or 10 encounters before the index consultation, whichever was the greater number of consultations, to negate the problems that can arise with when the continuity-defining period is specified in terms of time or number of consultations. Because the time spanned by the longitudinal care data varied from patient to patient, the actual amount of time covered by the community-defining period was included as a covariate in all analyses.
Patient-Doctor Longitudinal Care and Depth-of-Relationship Associations
Scores for patient-doctor depth-of-relationship were negatively skewed in the main study and not amenable to transformation to normalize the data. To examine the data for an association between patient-doctor longitudinal care and depth of patient-doctor relationship, we dichotomized patients at a threshold of 31/32 into shallow and deep relationship groups and performed multivariable logistic regression.
Logistic regression models assume that the relationship between the explanatory and the outcome variables is linear, albeit on the logit scale. The same may not be true for longitudinal care and patient-doctor continuity, where after a threshold number of satisfactory encounters, a maximal depth of relationship might be established that cannot be improved with further visits. Such nonlinearity was investigated by adding the relevant polynomial term for NOC. Potential confounders (patient sociodemographic and health characteristics, GPAQ communication score, and consultation length) were included in the main logistic regression models, and robust standard errors were used to account for clustering by physician. Robust standard errors are estimated using the variability in the data (measured by the residuals) and adjust the widths of the confidence intervals to allow for clustering but without altering the odds ratios.16
Sample Size
There is no general agreement about the size of sample required for factor analysis. Some authors recommend rules of thumb regarding the minimum ratio of participants to variables (2:1) or extracted factors (20:1).17 Accordingly, the number of questionnaires administered during the pilot rounds was a pragmatic decision, whereas the main study was powered on a related study hypothesis.18
RESULTS
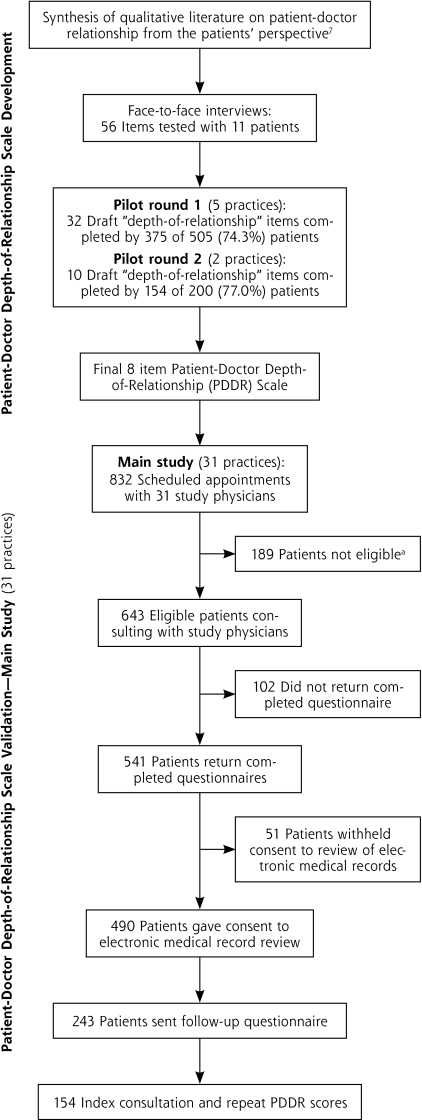
Figure 1 shows the number of practices and patients involved in the developmental work and the main study. Of 34 practices approached, 31 agreed to support at least the main study. The characteristics of the patients at each stage are shown in Table 1.
Figure 1.
Overview of Patient-Doctor Depth-of-Relationship Scale development and validation.
a Of 189 patients, 93 were younger than 16 years; 45 did not attend/did not wait; 30 unable to complete questionnaire; 14 nonqualifying consultations; 7 other reasons.
Table 1.
Characteristics of Patients That Took Part in Patient-Doctor Depth-of-Relationship Scale Development and Validation
| Employment, No. (%)a | Education, No. (%) | ||||||||||
|---|---|---|---|---|---|---|---|---|---|---|---|
| Stage No. of Patients | Female No. (%) | Mean Age, y (SD, Range) | White (%) | Employed | Unemployed | Retired | Other | None | Primary | Secondary | Graduate |
| Interviews (n=11) | 5 (45.5) | 61.5 (15.1, 33–79) | 11 (100) | 2 (18.2) | 1 (9.1) | 6 (54.5) | 2 (18.2) | 3 27.3) | 7 (63.6) | 1 (9.1) | 0 (0) |
| Pilot round 1 (n=375) | 240 (65.2) | 47.9 (19.1, 16–89) | 351 (94.9) | 196 (53.9) | 10 (2.8) | 83 (22.8) | 75 (20.6) | 92 (26.2) | 163 (46.4) | 49 (14.0) | 47 (13.4) |
| Pilot round 2 (n=154) | 87 (56.9) | 45.8 (16.7, 17–82) | 147 (96.1) | 78 (50.7) | 3 (2.0) | 26 (16.9) | 47 (30.5) | 47 (32.6) | 76 (52.8) | 14 (9.7) | 7 (4.9) |
| Main study (n=490) | 285 (58.2) | 52.6 (19.8, 16–93) | 461 (96.2) | 202 (42.0) | 18 (3.7) | 167 (34.7) | 94 (19.5) | 157 (33.3) | 165 (35.0) | 73 (15.5) | 77 (16.3) |
| Follow-up questionnaire (n=154) | 90 (58.4) | 55.2 (17.8, 17–87) | 148 (96.7) | 68 (44.4) | 3 (2.0) | 54 (35.3) | 28 (18.3) | 44 (29.5) | 50 (33.6) | 33 (22.2) | 22 (14.8) |
Employed = full or part-time, including self-employed; Other = looking after home or family, long-term career, unable to work due to long-term sickness or “other.”
Candidate Question Items and Face-to-face Interviews
The senior author (M.R.), in discussion with 2 additional authors (C.S. and G.L.), selected questions from an initial pool of 124 items for testing in different draft versions of the questionnaire. Based on findings from a synthesis of data on the depth of relationship,7 56 items were selected according to their topic importance, uniqueness, and readability.
Twenty-one patients replied to their doctor’s invitation to take part, and 11 people participated in 10 interviews (1 was a joint interview with a married couple). Interviews lasted between 20 and 75 minutes. Of the various questionnaire formats tried, participants preferred positively worded statements with 5 Likert-type response options. Some items were reworded or reordered, and questions that were found to be ambiguous, indistinct, or open to misinterpretation were rejected. At the end of this process the draft questionnaire contained 32 items.
Pilot Round 1
Five practices handed out 505 questionnaires, of which 375 (74.3%) were returned completed. Cronbach’s α was very high (.98). Most of the variance in the data (82.0%) could be explained by just 1 factor, with a second factor accounting for 8.2%. Adopting a 2-factor solution (Supplemental Table 1, available at http://www.annfammed.org/content/9/6/538/suppl/DC1), the 18 items that grouped under factor 1 appeared to relate to feelings of connectedness between patient and doctor, whereas the 8 items that loaded on factor 2 seemed to be more factual or knowledge based. Six items did not definitely fall into either factor.
We shortened and modified the questionnaire because of apparent redundancy and in response to participant feedback. As a result, the number of items was reduced to 10 (6 items from factor 1 and 4 items from factor 2, with some minor changes to wording) and a single scale ranging from disagree to totally agree was adopted. We added a preface item so that respondents could qualify whether they had seen the doctor before.
Pilot Round 2
Two practices handed out 200 questionnaires, of which 154 (77.0%) were returned completed. Cronbach’s α was .93, which was slightly lower than for round 1 but still high. Once again, most (85.3%) of the variance in the data was explained by a single factor (factor 1), with a second factor accounting for a further 13.9%.
Adopting a 2-factor solution, 4 knowledge items (1 to 4) grouped under factor 1, and 4 connection items (5 to 8) had higher loadings on the second factor (Supplemental Table 2, available at http://www.annfammed.org/content/9/6/538/suppl/DC1). Questions 9 and 10 appeared to perform differently (possibly because they were different in nature from the other items) and were discarded.
Patient-Doctor Depth-of-Relationship Scale
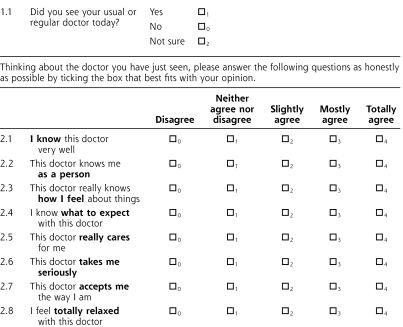
It was decided that the final 8-item version (Figure 2) should be regarded as unidimensional. Using the below formula, a single overall depth-of-relationship score can be calculated, which ranges from 0 (no relationship) to 32 (very strong relationship), as long as 6 or more items are completed:
Figure 2.
Patient-Doctor Depth-of-Relationship Scale.
Main Study
We invited 643 patients seeing 31 general practitioners to take part in the study, and 541 (84.1%) completed and returned their questionnaire. Patient-doctor longitudinal care data were available on the 490 (75.1%) patients who consented to their medical records being reviewed.
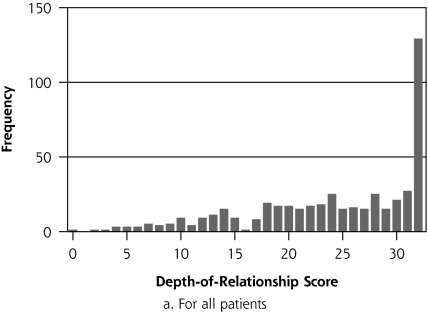
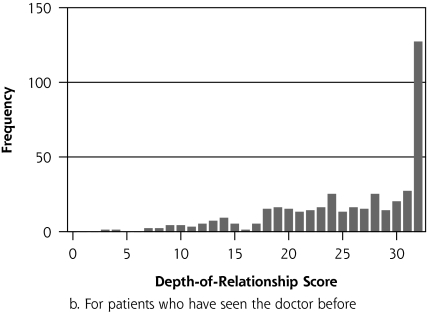
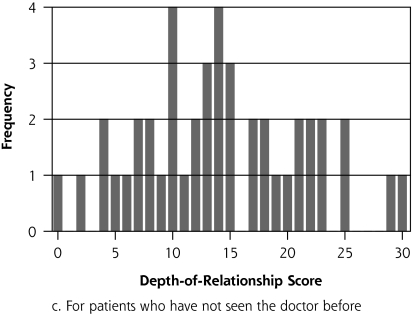
The psychometric properties of the patient-doctor depth-of-relationship scale were checked. Cronbach’s α was .93, and repeat factor analysis confirmed a single factor accounting for 92.0% of the variance in the data. The median depth-of-relationship score was 26 (interquartile range, 19–32, Figure 3a), and 129 (26.7%) patients had a deep relationship (n = 483). Of the 420 (90.5%) patients who reported having seen the doctor before (Figure 3b), 127 (30.2%) had deep relationships, compared with no deep relationships among the 44 (9.5%) of patients who had never seen the doctor before (Figure 3c). The distribution of the depth-of-relationship scores among patients who had seen the doctor before (Figure 3c) also has a more normal appearance.
Figure 3.
Distribution of patient-doctor depth-of-relationship scores.
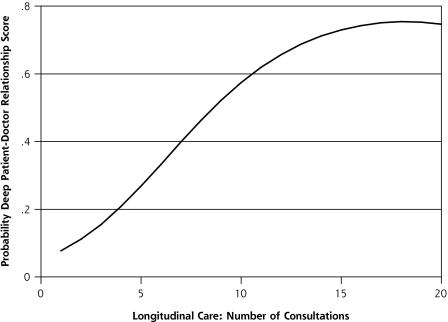
The crude odds ratio of deep patient-doctor relationship for every additional consultation with the study doctor was 1.3 (95% CI, 1.2–1.4). When a quadratic term was introduced into the unadjusted logistic regression model, the nonlinear model appeared to fit better (P <.001): the overall odds ratio of deep patient-doctor relationship for every additional consultation was 1.6 (95% CI, 1.3–1.8; NOC-squared, OR = 0.99; 95% CI, 0.98–0.99). Figure 4 depicts graphically how, in the quadratic model, the probability of a deep patient-doctor relationship increases with number of consultations. There was little evidence of confounding of this association. Adjusted for all potential confounding variables, the overall odds ratio of deep patient-doctor relationship with increasing consultation number of consultations was 1.5 (95% CI, 1.2–1.8; NOC-squared, OR = 0.99; 95% CI, 0.98–1.00).
Figure 4.
Predicted probability (unadjusted quadratic logistic regression model) of deep patient-doctor relationship with number of consultations.
Follow-up questionnaires were sent to 243 patients. Paired patient-doctor depth-of-relationship scores were obtained on 154 (63.4%). Three further patients whose depth-of-relationship scores changed by more than 3 standard deviations (mean change in depth-of-relationship score for all patients −2.2, SD = 4.9) were excluded. Most (69.9%) had not seen the same doctor between the first and second questionnaires, and the mean change in depth scores did not vary with the interval between them. The Bland-Altman plot (Supplemental Figure 1, available at http://www.annfammed.org/content/9/6/538/suppl/DC1) shows that the change scores varied uniformly across the range of scores. The intracluster correlation coefficient was 0.87 (95% CI, 0.53–0.97).
DISCUSSION
Summary of Main Findings
The Patient-Doctor Depth-of-Relationship Scale is a novel, conceptually grounded patient self-completion questionnaire. The face and content validity of questions were checked in face-to-face interviews, and the 8 items included in the final version of the questionnaire were selected after psychometric analysis of data from 2 pilot rounds. The association between patient-doctor longitudinal care and deep relationships represents evidence of construct validity, and the data from the follow-up questionnaire showed good test-retest reliability.
Strengths and Limitations
The patient-doctor relationship is a complex concept, but care was taken to produce an instrument feasible for use in primary care. High internal reliability was shown at all stages of the scale’s development. Although one might have expected several subscales to reflect the 4 elements that might comprise patient-doctor depth of relationship,7 it seems that patients do not discern relationships at this level of detail when asked to complete a questionnaire. Factor analysis initially suggested 2 possible subscales (knowledge and connection), but there was a noteworthy amount of cross-loading between the factors for most of the items, and most of the variance in the data could be explained by a single factor. That is, the qualitative concepts of loyalty and regard may be subsumed within knowledge and trust; and from a psychometric point of view, even these 2 dimensions can be measured on a single scale, as vindicated by the identification of a single factor in repeat factor analysis in the main study.
Even though a 5-point response scale biased toward positive statements was purposefully chosen to try to obtain a spread of opinion,19 the depth scores were negatively skewed. This finding may reflect a limitation in the scale’s ability to discriminate between different depths of relationship, particularly at the deeper end. Patient-doctor communication scores as measured using the validated GPAQ instrument, however, were also high: the mean score was 87.6 (SD = 13.7, range, 37.5–100.0) with 154 (32.1%) of patients in this study giving the maximum score. These figures are higher than for previously reported national data (mean score 82.5, SD = 17.6, 28.3% maximum score).14 Furthermore, the distribution of depth-of-relationship scores in our study among patients who had not seen the doctor before were more normally distributed. Combined, these findings suggest that the patients in our study enjoyed unusually good relationships with their doctors. The adoption of a shallow/deep relationship threshold of 31/32 gave the most conservative estimate possible of an association between patient-doctor longitudinal care and deep relationships. Of course, cross-sectional data can only show associations, and the study has not established a causal link between seeing the same doctor and building a depth of relationship.
The instrument was developed and used in practices nonrandomly recruited in and around one major city, Bristol, England. Certain patient groups are underrepresented in the present study, such as people of nonwhite ethnicity and the young. Further research is therefore required to assess how the Patient-Doctor Depth-of-Relationship Scale performs in these populations. Although considerable effort was made to evaluate the scale, the validity of a questionnaire can be established only through repeated testing.10,20 There is no reference standard against which the Patient-Doctor Depth-of-Relationship Scale can be compared for the purposes of establishing criterion validity, but divergent validity (how distinct it is from other measures of patient-doctor relationships) could yet be determined. Preliminary work suggests that patient-doctor communication and depth of relationship are distinct constructs.18,21
Comparison With Existing Literature
This instrument fills a gap in existing measures of patient-doctor relationships. As far as the authors are aware, no questionnaire designed to specifically measure patient-doctor depth of relationship has been developed and published. Notable attempts in this field include the Patient-Doctor Relationship Questionnaire (PDRQ),22 the depth-of-relationship subscale of Baker’s Consultation Satisfaction Questionnaire (CSQ),23 and the Perception of Continuity (PC) scale.24 None, however, was based on a conceptual model that distinguished between patient-doctor longitudinal care, patient experiences in individual consultations, and depth of relationship; and the PDRQ was developed in secondary care. Patient-clinician relationships have been of long-standing interest to mental health workers and researchers in this field, but studies of relationship measures have mainly been limited to examining their therapeutic value in severe mental illness.25
Similarly, no published studies have been identified that explore the association between number of consultations and patient-doctor depth of relationship. Related research in the field, however, has previously associated longitudinal care with patient-doctor knowledge8,26,27 and trust.26,28,29
Implications for Future Practice and Research
The Patient-Doctor Depth-of-Relationship Scale represents a new tool that can be used to evaluate the value of personal continuity. Further evidence of its validity will come with its use in future research, most notably longitudinal studies where the causal relationship between patient-doctor longitudinal care and depth of relationship can be explored more fully. For example, of interest is how each patient-doctor encounter, from the initial meeting onward, influences patient preference for seeing that physician again; one would expect longitudinal care and depth of relationship to promote one another.
The finding of an association between seeing the same doctor and the presence of deep patient-doctor relationships supports what many practicing general practitioners already think. Clinicians might be encouraged to promote patient-doctor continuity on this basis, but it has not been established that depth of relationship is beneficial; and even if it were, practices still have to balance continuity with the issues of patient choice and speed of access to a doctor. How to strike the best balance between these factors and the role of patient-practice team continuity are important unanswered questions.
Acknowledgements
We thank all the patients and general practitioners who took part in this study; and our collaborators George Freeman, Sir David Goldberg, and Debbie Sharp.
Footnotes
Conflicts of interest: authors report none.
Previous presentations: Oral: Longitudinal care and patient-doctor depth of relationship: development and validation of a new questionnaire. Society for Academic Primary Care Annual Scientific Meeting, St Andrews, 2009; Patient-doctor depth of relationship: development of a new questionnaire. South-West regional meeting of Society for Academic Primary Care, Winchester 2009. Poster: Longitudinal care is associated with depth of patient-doctor relationship. South-West regional meeting of the Society for Academic Primary Care, Winchester 2009.
Funding support: This study was supported by funding from a Medical Research Council Clinical Research Training Fellowship (G84/6588) and Royal College of General Practitioners Scientific Foundation Board (SFB/2004/09).
References
- 1.Hjortdahl P. Ideology and reality of continuity of care. Fam Med. 1990;22(5):361–364 [PubMed] [Google Scholar]
- 2.Haggerty JL, Reid RJ, Freeman GK, Starfield BH, Adair CE, McKendry R. Continuity of care: a multidisciplinary review. BMJ. 2003; 327(7425):1219–1221 [DOI] [PMC free article] [PubMed] [Google Scholar]
- 3.Saultz JW, Albedaiwi W. Interpersonal continuity of care and patient satisfaction: a critical review. Ann Fam Med. 2004;2(5):445–451 [DOI] [PMC free article] [PubMed] [Google Scholar]
- 4.Saultz JW, Lochner J. Interpersonal continuity of care and care outcomes: a critical review. Ann Fam Med. 2005;3(2):159–166 [DOI] [PMC free article] [PubMed] [Google Scholar]
- 5.Freeman G, Hjortdahl P. What future for continuity of care in general practice? BMJ. 1997;314(7098):1870–1873 [DOI] [PMC free article] [PubMed] [Google Scholar]
- 6.Starfield B. Primary Care: Balancing Health Needs, Services and Technology. New York, NY: Oxford University Press; 1998 [Google Scholar]
- 7.Ridd M, Shaw A, Lewis G, Salisbury C. The patient-doctor relationship: a synthesis of the qualitative literature on patients’ perspectives. Br J Gen Pract. 2009;59(561):268–275 [DOI] [PMC free article] [PubMed] [Google Scholar]
- 8.Freeman GK, Richards SC. Personal continuity and the care of patients with epilepsy in general practice. Br J Gen Pract. 1994; 44(386):395–399 [PMC free article] [PubMed] [Google Scholar]
- 9.Howie JG, Heaney DJ, Maxwell M, Walker JJ, Freeman GK, Rai H. Quality at general practice consultations: cross sectional survey. BMJ. 1999;319(7212):738–743 [DOI] [PMC free article] [PubMed] [Google Scholar]
- 10.Fayers PM, Machin D. Quality of Life. Assessment, Analysis and Interpretation. Chichester: John Wiley & Sons Ltd; 2000 [Google Scholar]
- 11.Fitzpatrick R, Davey C, Buxton MJ, Jones DR. Evaluating patient-based outcome measures for use in clinical trials. Health Technol Assess. 1998;2(14):i-iv, 1–74 [PubMed] [Google Scholar]
- 12.Tourangeau R, Rips LJ, Rasinski K. The Psychology of Survey Response. Cambridge: Cambridge University Press; 2000 [Google Scholar]
- 13.Schwarz N. Cognitive aspects of survey methodology. Appl Cogn Psychol. 2007;21(2):277–287 [Google Scholar]
- 14.Mead N, Bower P, Roland M. The General Practice Assessment Questionnaire (GPAQ)—development and psychometric characteristics. BMC Fam Pract. 2008;9:13. [DOI] [PMC free article] [PubMed] [Google Scholar]
- 15.Bland JM, Altman DG. Statistical methods for assessing agreement between two methods of clinical measurement. [see comment]. Lancet. 1986;1(8476):307–310 [PubMed] [Google Scholar]
- 16.Peters TJ, Richards SH, Bankhead CR, Ades AE, Sterne JAC. Comparison of methods for analysing cluster randomized trials: an example involving a factorial design. Int J Epidemiol. 2003;32(5):840–846 [DOI] [PubMed] [Google Scholar]
- 17.Kline P. An Easy Guide to Factor Analysis. London: Routledge; 1994 [Google Scholar]
- 18.Ridd MJ. Patient-doctor longitudinal care, depth of relationship and detection of patient psychological distress by general practitioners [PhD thesis]. University of Bristol; 2009 [Google Scholar]
- 19.Cohen G, Forbes J, Garraway M. Can different patient satisfaction survey methods yield consistent results? Comparison of three surveys. BMJ. 1996;313(7061):841–844 [DOI] [PMC free article] [PubMed] [Google Scholar]
- 20.Cronbach LG, Meehl PE. Construct validity in psychological tests. In: Brynner J, Stribley MK, eds. Social Research: Principles and Procedures. London: Longman; 1979 [Google Scholar]
- 21.Ridd M, Lewis G, Salisbury C. Evidence from psychometric development of the Doctor-Patient Relationship Questionnaire (DPRQ) that communication skills and “depth” of relationship are different constructs. Fam Pract. 2006;23(Suppl 1):30–32 [Google Scholar]
- 22.Van der Feltz-Cornelis CM, Van Oppen P, Van Marwijk HWJ, De Beurs E, Van Dyck R. A patient-doctor relationship questionnaire (PDRQ-9) in primary care: development and psychometric evaluation. Gen Hosp Psychiatry. 2004;26(2):115–120 [DOI] [PubMed] [Google Scholar]
- 23.Baker R. Development of a questionnaire to assess patients’ satisfaction with consultations in general practice. Br J Gen Pract. 1990;40(341):487–490 [PMC free article] [PubMed] [Google Scholar]
- 24.Chao J. Continuity of care: incorporating patient perceptions. Fam Med. 1988;20(5):333–337 [PubMed] [Google Scholar]
- 25.McCabe R, Priebe S. The therapeutic relationship in the treatment of severe mental illness: a review of methods and findings. Int J Soc Psychiatry. 2004;50(2):115–128 [DOI] [PubMed] [Google Scholar]
- 26.Parchman ML, Burge SK. The patient-physician relationship, primary care attributes, and preventive services. Fam Med. 2004;36(1):22–27 [PubMed] [Google Scholar]
- 27.Rodriguez HP, Rogers WH, Marshall RE, Safran DG. The effects of primary care physician visit continuity on patients’ experiences with care. J Gen Intern Med. 2007;22(6):787–793 [DOI] [PMC free article] [PubMed] [Google Scholar]
- 28.Schers H, van den Hoogen H, Bor H, Grol R, van den Bosch W. Familiarity with a GP and patients’ evaluations of care. A cross-sectional study. Fam Pract. 2005;22(1):15–19 [DOI] [PubMed] [Google Scholar]
- 29.Mainous AG, III, Baker R, Love MM, Gray DP, Gill JM. Continuity of care and trust in one’s physician: evidence from primary care in the United States and the United Kingdom. Fam Med. 2001;33(1):22–27 [PubMed] [Google Scholar]


