

Abstract
Human Epidermal growth factor receptor (HER1) plays an important role in the pathogenesis of colorectal cancer (CRC). Panitumumab is an anti-HER1 monoclonal antibody approved for use in CRC. However, little data exists regarding HER1 status in the corresponding distant metastases and corresponding little information is available regarding the localization of panitumumab at primary and metastatic lesions. The utility of PET and MRI using 89Zr-panitumumab to assess the status of HER1 in distant metastases using different metastases models is presented in this study.
Methods
In vivo biodistribution and PET studies were performed in HER1-expressing LS-174T and HER1-negative A375 tumor xenografts. Additionally, studies were performed in different models of intraperitoneal and pulmonary metastases. MRI studies were performed for metastatic models to characterize the targeting potential of 89Zr-panitumumab at different lesion sites.
Results
HER1-mediated targeting was achieved in all HER1-expressing models. The LS-174T tumor area under the curve (AUC)was 3.7-fold greater than the AUC for A375. The LS-174T tumor AUC of 204.13 ± 9.67 was significantly greater ( p < 0.001) than LS-174T tumor AUC of 36.45 ± 1.39 obtained from mice coinjected with 0.1 mg panitumumab for blocking the target. Differences were observed in two models of intraperitoneal models; tumor uptake in mice with 3 d tumor burden group was more than 2-fold greater than the mice with 7 d tumor burden. PET and MRI studies revealed HER1-mediated tumor targeting in all metastatic models. However, significant differences were observed between different LS174T tumor models. Peak tumor uptake of approximately 40 % ID/g was observed at 3–4 d after injection for the subcutaneous tumor model in contrast to approximately 75 % ID/g at 2 d after injection for the thoracic tumors and approximately 95 % ID/g at 1–2 d after injection for the intraperitoneal tumors.
Conclusion
The potential utility of 89Zr-panitumumab in assessing HER1 status in distant metastases and understanding the variations in antibody uptake at different lesion sites is demonstrated in this study. 89Zr-panitumumab can play a vital role in patient stratification and immunotherapy and therefore warrants further investigation for clinical translation.
Keywords: ImmunoPET, PET, MRI, HER1, metastatic colorectal cancer, panitumumab, 89Zr
Introduction
Colorectal cancer (CRC) is one of the three most frequent malignancies in humans and is the third and fourth leading cancer in women and men, respectively (1). More than 30% of the colorectal cancer patients develop peritoneal metastases carcinomatosis with medial survival of less than 6–8 months (2). Pulmonary metastasis is known to be the most common extra-abdominal site of metastases from CRC and surgical intervention remains the proposed choice of treatment for metastatic sites (3).
Panitumumab (Vectibix®, Amgen) is a fully human IgG2 monoclonal antibody (mAb) that targets the extracellular domain of the epidermal growth factor receptor (HER1). HER1 is a transmembrane cell surface glycoprotein belonging to the subfamily of type I tyrosine kinase receptors. Approximately 60–70% human colorectal cancers express HER1 (4, 5). The expression of HER1 is often associated with an aggressive form of disease and poor prognosis (6, 7).
A critical factor in screening patients for targeted therapy is evaluating the presence and amount of the specific target in the tumor and its relevance to the disease state. Initial clinical experience with both cetuximab and panitumumab therapy revealed that HER1 levels detected by immunohistochemistry did not correlate with response to anti-HER1 immunotherapy (8, 9). Besides factors such as v-kis-ras2 Kirsten rat sarcoma viral (KRAS) mutations, another possible reason might be possible differences in the HER1 status between the primary and the metastatic tumor sites and the accessibility of the antibody to different lesion sites. Unfortunately, there is limited data describing the HER1 status in the primary colorectal tumor and the corresponding distant metastases. Imaging techniques like positron emission tomography (PET) and magnetic resonance imaging (MRI) provide insights into the tumor biology and are often clinically useful for establishing patient prognosis and decide the best therapeutic option. Radiolabeled antibodies have been used to confirm target expression and binding sites and as imaging agents to obtain a better insight in the in vivo behavior and efficacy of the mAbs in individual patients (10–12). Preclinical PET studies with 64Cu (half-life: 12.7 h) and 86Y (half-life: 14.7 h) labeled panitumumab have been reported (13–15). Al though the preclinical studies demonstrated adequate tumor targeting, the half-lives of the 64 Cu and 86Y may limit quantitative imaging beyond 3 days after injection. Therefore, 89Zr with a longer half-life of 78.4 h may be a better choice for clinical applications. Recently, 89Zr-trastuzumab was evaluated for imaging HER2 expression in HER2-positive metastatic breast cancer patients. PET images revealed a high spatial resolution and a good signal-to-noise ratio, which resulted in better image quality than 111In-trastuzumab SPECT scans (16). Excellent tumor uptake and visualization of metastatic liver, lung, bone, and even brain HER2-positive lesions were obtained 4–5 days after injection.
Considering the success of 89Zr-trastuzumab in quantitative visualization of HER2-positive lesions in metastatic breast cancer, in this study we aimed to develop 89Zr-panitumumab as a potential PET imaging agent for potential use in risk stratification and quantitative non-invasive imaging of HER1, and assessment of panitumumab uptake in primary tumor and distant metastases.
Methods and Materials
Cell lines and tissue culture
All cell lines were purchased from American Type Culture Collection (Manassas, VA). HER1-expressing human colorectal adenocarcinoma LS-174T (ATCC number: CL-188™), human epidermoid carcinoma A431 cells (ATCC number: CL-1555™) and HER-1 negative human malignant melanoma A375 cells (ATCC number: CL-1619™) were grown as a monolayer at 37°C, in a humidified atmosphere of 5% CO2 and 95% air. LS-174T and A431 cells were cultured in Dulbecco’s minimal essential medium (DMEM) containing 10% FetaPLEX (Gemini Bio-Products, Woodland, CA) and 10 mM glutamine solution. A375 cells were cultured in DMEM containing 10% FetaPLEX supplemented with 1 mM sodium pyruvate and 10 μg/mL insulin. Media and supplements were obtained from Quality Biologicals, (Gaithersburg, MD), Invitrogen (Carlsbad, CA), or Lonza (Walkersville, MD).
Production and preparation of 89Zr labeled panitumumab
89Zr was produced and purified at the National Institutes of Health, Bethesda, (details provided in supplementary information). The bifunctional chelator, p-isothiocyanatobenzyl-desferrioxamine B (Df-Bz-NCS) (Macrocylics, Dallas, TX, USA) was conjugated to panitumumab for radiolabeling with 89Zr (details provided in supplementary information). The chelate to protein product ratio was determined by the isotope dilution method as previously described using high purity non-radioactive ZrCl4 solution (17, 18). For radiolabeling, 37–370 MBq of the 89Zr oxalate solution (pH≤1) was neutralized to pH 7–7.5 by slow addition of 2 M Na2CO3 followed by 0.5 M HEPES buffer. Alternatively 5 M ammonium acetate was used instead of 0.5 M HEPES buffer to neutralize the solution after slow addition of 2 M Na2CO3. A freshly prepared solution of gentisic acid (50 μL, 220 μg/μL) was then added to the solution to prevent radiolysis of the mAb followed by 0.1 mg of panitumumab in 0.15 M ammonium acetate buffer. The reaction mixture was gently stirred and incubated at room temperature for 1 h. The reaction was quenched by the addition of ethylenediaminetetraacetic acid solution (4 μL, 0.1 M). The radiolabeled product was purified using a PD-10 desalting column (GE Healthcare, Piscataway, NJ). Size-exclusion high-performance liquid chromatography (SE-HPLC) and cell based immunoreactivity assays were performed to ascertain the purity and biological integrity of the radioimmunoconjugate using previously described methods (14, 19, 20).
Animal models
All animal studies were performed in accordance with the NIH guidelines for the humane use of animals and all procedures were reviewed and approved by the National Cancer Institute Animal Care and Use Committee. For subcutaneous (s.c.) tumor xenograft models, female athymic nu/nu mice (Charles River Laboratory) were injected subcutaneously with 2 × 10⁶ HER1-expressing human colorectal adenocarcinoma LS-174T or 4 × 10⁶ HER1-negative human melanoma A375 cells in 200 μL of corresponding medium containing 20% Matrigel (BD Biosciences, San Jose, CA). The aggressive metastatic disseminated peritoneal colorectal carcinoma model was developed by intraperitoneal (i.p.) injection of 1 × 10⁸ HER1-expressing human colorectal carcinoma LS-174T in 1 mL of the media as previously described (21). For pulmonary metastatic colorectal carcinoma model, 2 × 10⁶ HER1-expressing human colorectal carcinoma LS-174T cells in 50 μL of corresponding medium were directly injected in the thoracic cavity by advancing the needle approximately 5 mm through the fourth intercostal space into the right lateral thorax.
Biodistribution studies
HER1-expressing human colorectal LS-174T (n = 5) and HER1-negative human melanoma A375 (n = 5) subcutaneous tumor xenograft bearing female athymic mice were intravenously (i.v.) injected with 0.4–0.6 MBq (< 5 μg) of 89Zr labeled panitumumab. Female athymic mice (n = 5) bearing disseminated peritoneal LS-174T carcinoma were administered 0.4–0.6 MBq (< 5 μg) of 89Zr labeled panitumumab by i.p. injection 3 d after the inoculation of LS-174T cells in peritoneal cavity. Female athymic mice (n = 5) bearing pulmonary metastatic LS-174T carcinoma were administered 0.4–0.6 MBq (< 5 μg) of 89Zr labeled panitumumab by i.v. injection 5 d after the inoculation of LS-174T cells in the thoracic cavity. To demonstrate HER1-specificity, excess mAb (0.1 mg) was co-injected with the radioimmunoconjugate (RIC) into an additional set of mice (n = 5) bearing corresponding tumors. At the desired time points, the animals were sacrificed by CO2 inhalation. Tumor, blood and selected organs were harvested, wet-weighed, and the radioactivity measured in a Wizard 1480 gamma counter (PerkinElmer, Shelton, CT). The tissue percent injected dose per gram (% ID/g) was calculated by comparison using standards representing 10% of the injected dose per animal. Non-compartmental pharmacokinetics was performed to determine area under the curve (AUC) using trapezoidal integration analysis (22).
PET imaging
Small animal PET studies were performed using the Siemens Focus 120 scanner at the National Institutes of Health, Bethesda, MD, USA. Whole body imaging studies (singe bed positions, total acquisition time of 1 h per mouse) were carried out on mice anesthetized with 1.5–1.7% isoflurane on a temperature-controlled bed as previously described (14). Subcutaneous and pulmonary tumors bearing female athymic mice were injected i.v. with 1.7–1.9 MBq (< 5 μg) of 89Zr labeled panitumumab. While for mice bearing intraperitoneal tumors, 1.7–1.9 MBq (< 5 μg) of 89Zr labeled panitumumab was injected (i.p.). The RIC was injected in two set of mice, one set comprised mice bearing intraperitoneal tumors with 3 d tumor burden and another set comprised of 7 d tumor burden, therefore representing relatively early stage and late stage disease. Additionally, non-tumor bearing mice were injected (i.v. or i.p.) with the equivalent RIC as controls. To determine HER1-specificity in mice bearing subcutaneous tumor xenografts, excess unmodified mAb (0.1 mg) was co-injected with the 89Zr labeled panitumumab. A 10 min transmission scan was performed with precalibrated 57Co sealed source for attenuation correction for mice bearing pulmonary or intraperitoneal tumors. 89Zr-filled cylinder phantoms were imaged during each imaging session for normalization and quantitative analysis. Further details regarding image acquisition, processing and analysis are provided in the supplementary information.
MRI imaging
Following PET imaging session, MRI was performed on those mice bearing peritoneal and pulmonary LS-174T tumors. MRI imaging was performed on a 3 Tesla MRI clinical scanner (Intera, Philips Medical System, Best, Netherlands) using a dedicated 40 mm inner diameter solenoid coil (Philips, Best, Netherlands). Mice were euthanized immediately after PET imaging and sealed in plastic tubes. MRI was performed within 6 h of euthanasia. T2-weighted acquisition was performed with the following parameters: field of view 8.0 × 8.0 × 2.0 cm3, data matrix 512 × 512, 40 slices, TE/TR 65/4500 ms, flip angle 90°, slice thickness 0.5 mm, 0.156 × 0.156 mm2 in-plane resolution and a scan time of approximately 10–15 min.
Statistical Analysis
All numerical data were expressed as the mean of the values ± the standard error of mean (SEM). Graphpad Prism version 5 (San Diego, CA, USA) was used for statistical analysis. A P value less than 0.05 was considered statistically significant.
Results
Radiochemistry and in vitro evaluations
Panitumumab was modified with the acyclic bifunctional chelator Df-Bz-NCS at a 5:1 molar excess of chelate to protein, yielding a final chelate-to-protein ratio of 1.7 ± 0.3 chelate molecules per protein molecule. The 89Zr labeled panitumumab conjugate was successfully prepared, with the radiochemical yields ranging from 80% to 95% with the highest specific activity in the range of 2.0–2.5 GBq/mg. Greater radiochemical yields were achieved when 0.5 M HEPES buffer was used instead of 5 M ammonium acetate buffer for neutralizing the pH to 7–7.5 ( 90–95% vs. 80–85%). The 89Zr labeled panitumumab conjugate demonstrated acceptable in vitro receptor specificity, as exhibited by a specific binding (%) of 72.39 ± 5.23 and non-specific binding (%) of 5.03 ± 2.33 (n = 3) on fixed cells. The in vitro binding characteristics were comparable to previously reported 111In and 86Y labeled panitumumab (14, 19).
In vivo evaluations
Biodistribution studies
Subcutaneous tumor xenograft models
In mice bearing LS-174T tumor subcutaneous xenografts, a 3.5-fold decrease in the blood-pool activity was observed over a 9 d period (11.47 ± 1.37 %ID/g at 1 d to 3.25 ± 0.34 %ID/g at 9 d) (Fig. 1A). Similarly, a 4.2-fold decrease in liver uptake was also observed (9.02 ± 0.29 %ID/g at 1 d to 2.18 ± 0.20 %ID/g at 9 d) (Fig. 1A). In contrast, tumor uptake of 27.92 ± 3.47 %ID/g at 1 d was similar to the tumor uptake of 25.65 ± 1.73 %ID/g observed at 9 d with peak tumor uptake of 42.89 ± 4.49 %ID/g at 3 d after injection, demonstrating retention of the RIC in the tumor over the 9 d study period (Fig. 1A). The tumor-to-blood ratio increased 3.3-fold, 2.4 at 1 d to 7.9 at 9 d after injection. Significant increase in femur uptake was observed over 9 d (1.58 ± 0.17 %ID/g at 1 d to 6.94 ± 0.17 %ID/g at 9 d) indicative of possible metabolism and localization of 89Zr species into the bone. The 89Zr labeled panitumumab uptake in HER1-expressing LS-174T tumor subcutaneous xenograft was HER1-mediated, as demonstrated by the receptor-blocking experiments performed by co-injecting 0.1 mg of panitumumab (Fig. 1B). The tumor uptake of 32.14 ± 1.41 %ID/g at 6 d was significantly greater than tumor uptake of 6.98 ± 0.52 %ID/g at 6 d in mice co-injected with 0.1 mg panitumumab, thus demonstrating specificity of the RIC (Fig. 1B). In contrast, no significant difference in tumor uptake was observed in HER1-negative A375 tumor xenograft bearing mice co-injected with 0.1 mg panitumumab (Fig. 1B).
Figure 1.

Biodistribution of 89Zr labeled panitumumab in selected organs of female athymic (NCr) nu/nu mice bearing HER1-positive s.c. LS-174T tumors xenografts (A) and Receptor blocking in HER1-positive s.c. LS-174T tumors xenografts and HER1-negative s.c. A375 tumor xenografts (B). All values are expressed as %ID/g. Data represent mean value ± SEM from at least 4 determinations.
* Receptor blocking studies were performed by co-injecting 0.1 mg of panitumumab with radiolabeled antibody.
Metastatic intraperitoneal colorectal carcinoma model
A significant decrease in blood pool activity was observed over a 7 d period (12.85 ± 1.22 %ID/g at 1 d to 0.42 ± 0.06 %ID/g at 7 d) (Table 1). The tumor uptake decreased from 96.58 ± 8.97 %ID/g at 1 d to 17.71 ± 3.09 %ID/g at 7 d. Interestingly, a linear correlation (r2 = 0.85) was observed between the tumor expressed as % ID/g and log [tumor weight] (Fig. 2). The tumor-to-blood ratio increased more than 5-fold from 7.5 at 1 d to 41.6 at 7 d after injection (Table 1). Similar to the s.c. LS-174T tumor xenograft model, a 2-fold increase in femur uptake was observed (3.00 ± 0.37 %ID/g at 1 d to 7.00 ± 1.32 %ID/g at 7 d) indicative of possible metabolism and localization of 89Zr species into the bone.
Table 1.
Biodistribution of 89Zr labeled panitumumab in selected organs of female athymic (NCr) nu/nu mice bearing intraperitoneal human LS-174T tumors (3 d burden). Biodistribution data were obtained at 1, 2, 3, 5, and 7 d after i.p. injection of 89Zr labeled panitumumab. All values are expressed as %ID/g (except ratios). Data represent mean value ± SEM from at least 5 determinations.
| Tissue | 1 d | 2 d | 3 d | 5 d | 7 d |
|---|---|---|---|---|---|
| Blood | 12.85 ± 1.22 | 8.31 ± 1.63 | 3.63 ± 1.08 | 0.78 ± 0.11 | 0.42 ± 0.06 |
| Tumor | 96.58 ± 8.97 | 98.50 ± 15.65 | 53.48 ± 8.41 | 24.23 ± 3.25 | 17.71 ± 3.09 |
| Liver | 5.64 ± 0.91 | 6.13 ± 0.80 | 4.85 ± 0.39 | 3.90 ± 0.21 | 4.41 ± 0.37 |
| Spleen | 4.98 ± 0.92 | 7.03 ± 1.22 | 3.97 ± 0.47 | 4.85 ± 1.02 | 3.84 ± 0.56 |
| Kidney | 4.15 ± 0.28 | 4.49 ± 0.82 | 4.15 ± 0.64 | 3.56 ± 0.21 | 3.70 ± 0.36 |
| Lung | 6.07 ± 0.61 | 4.57 ± 0.65 | 2.47 ± 0.62 | 1.14 ± 0.40 | 1.02 ± 0.12 |
| Heart | 4.32 ± 0.53 | 2.78 ± 0.46 | 1.40 ± 0.31 | 0.54 ± 0.04 | 0.54 ± 0.06 |
| Femur | 3.00 ± 0.37 | 4.76 ± 0.68 | 5.50 ± 0.33 | 6.51 ± 0.72 | 7.00 ± 1.32 |
| Tumor/blood | 7.54 ± 0.19 | 12.28 ± 0.62 | 16.76 ± 1.97 | 31.96 ± 2.45 | 41.59 ± 3.87 |
Figure 2.

(A) Representative reconstructed and processed maximum-intensity projections of female athymic (NCr) nu/nu mouse bearing s.c LS-174T tumor xenograft intravenously injected via tail vein with 1.7–1.9 MBq of 89Zr labeled panitumumab or (B) 1.7–1.9 MBq of 89Zr labeled panitumumab co-injected with 0.1 mg panitumumab for receptor blocking. Scale represents percentage of maximum and minimum threshold intensity. Tumors are indicated with white arrows.
Metastatic pulmonary colorectal carcinoma model
Tumor uptake was similar throughout the observation period of 5 d, with the peak uptake of 78.05 ± 7.15 %ID/g at 2 d after injection (Table 2). The tumor-to-blood ratio increased 5.8-fold from 3.0 at 1 d to 17.3 at 5 d after injection. The tumor uptake of 61.97 ± 6.02 %ID/g at 5 d was significantly greater than tumor uptake of 11.61 ± 1.26 %ID/g at 5 d in mice co-injected with 0.1 mg panitumumab, demonstrating specificity of the RIC.
Table 2.
Biodistribution of 89Zr labeled panitumumab in selected organs of female athymic (NCr) nu/nu mice bearing pulmonary metastatic human LS-174T tumors. Biodistribution data were obtained at 1, 2, 3 and 5 d after i.v. injection of 89Zr labeled panitumumab. All values are expressed as %ID/g (except ratios). Data represent mean value ± SEM from at least 4 determinations.
| Tissue | 1 d | 2 d | 3 d | 5 d | 5 d (block)* |
|---|---|---|---|---|---|
| Blood | 19.77 ± 0.06 | 11.11 ± 0.73 | 6.32 ± 1.41 | 3.70 ± 0.42 | 14.11 ± 3.44 |
| Tumor | 59.95 ± 3.15 | 78.05 ± 7.15 | 60.12 ± 6.94 | 61.97 ± 6.02 | 11.61 ± 1.26 |
| Liver | 7.64 ± 0.53 | 6.13 ± 0.88 | 13.64 ±6.73 | 8.67 ± 0.81 | 6.81 ± 0.72 |
| Spleen | 5.71 ±0.20 | 4.63 ± 0.45 | 5.68 ± 0.45 | 5.91 ± 1.43 | 5.39 ± 1.28 |
| Kidney | 4.27 ± 0.32 | 3.46 ± 0.13 | 2.97 ± 0.60 | 3.00 ± 0.22 | 3.57 ± 0.41 |
| Lung | 13.86 ± 1.14 | 9.60 ± 1.36 | 7.69 ± 1.42 | 8.56 ± 2.31 | 5.07 ± 1.14 |
| Heart | 4.92 ± 0.31 | 3.56 ± 0.29 | 2.67 ± 0.55 | 1.64 ± 0.08 | 4.50 ± 0.53 |
| Femur | 3.60 ± 0.18 | 4.04 ± 0.14 | 5.07 ± 0.57 | 6.40 ± 0.96 | 3.51 ±1.03 |
| Tumor/blood | 3.03 ± 0.15 | 7.09 ± 0.64 | 11.07 ± 1.79 | 17.26 ± 2.05 | 0.91 ± 0.17 |
Receptor blocking studies were performed by co-injecting 0.1 mg of panitumumab with radiolabeled antibody.
Imaging studies
PET imaging in subcutaneous tumor xenograft models
PET imaging studies in female athymic mice bearing HER1-expressing LS-174T and HER1-negative A375 s.c. tumor xenografts were performed after i.v. injection of 1.7–1.9 MBq (< 5 μg) of 89Zr labeled panitumumab. To determine HER1-specificity, another set of tumor bearing mice were co-injected with 0.1 mg panitumumab to block the target. LS-174T tumor xenografts were clearly visible throughout the study period (1–6 d) with minimal background activity (Figure 3A and Suppl. Fig.1). In mice co-injected with 0.1 mg panitumumab, tumors were poorly visualized (Figure 3B and Suppl. Fig. 1) demonstrating HER1-specificity. The PET images for all time points are provided in the supplementary information. Time activity curves were generated to calculate the area under curve (AUC) as a measure of cumulative activity. The calculated AUC[0→6 d] values were expressed as % ID·d·g−1 (assuming 1 g = 1 cm3). The HER1-expressing LS-174T tumor AUC[0→6 d] of 204.13 ± 9.67 was 3.7-fold greater than the HER1-negative A375 tumor AUC[0→6 d] of 54.45 ± 6.60 (Suppl. Fig. 2). The LS-174T tumor AUC[0→6 d] of 204.13 ± 9.67 was significantly greater (p < 0.001) than LS-174T tumor AUC[0→6 d] of 36.45 ± 1.39 obtained from mice co-injected with 0.1 mg panitumumab for blocking the target. However for HER1-negative A375 tumors, there was no significant difference (p = 0.166) between AUC values obtained from mice injected with or without 0.1 mg panitumumab (Suppl. Fig. 2). Liver and tumor uptake quantified by PET was closely related (r2 = 0.95, p = 0.97, n = 12) to values determined by in vivo biodistribution studies.
Figure 3.
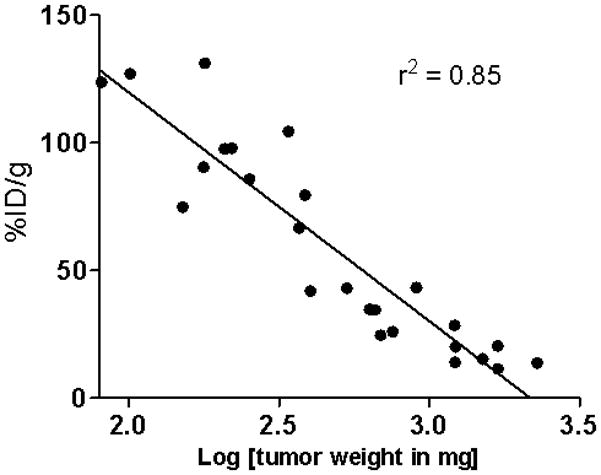
Correlation of tumor uptake expressed at %ID/g and tumor weight in female athymic (NCr) nu/nu mouse bearing intraperitoneal LS-174T tumors injected with 89Zr-panitumumab.
PET and MRI in metastatic intraperitoneal colorectal carcinoma model
PET imaging was performed in non-tumor bearing mice and mice bearing intraperitoneal LS-174T tumors (3 and 7 d tumor burden representing early and late stage disease). All mice were injected i.p. with 1.7–1.9 MBq (< 5 μg) of 89Zr labeled panitumumab. After the completion of the PET imaging at 5 d, T2-weighed MRI was performed to localize tumors and correlate the localization of the radioactivity as observed by PET imaging and therefore determine the tumor targeting characteristics of the RIC. In mice with 3 d tumor burden, at 1 d, radioactivity was visualized along the peritoneal walls, liver lobes (expected localization of tumors), and heart and lung (blood pool) (Figure 4A). Over a period of 5 d, the radioactivity was primarily localized around the peritoneal walls and liver lobes and cleared from the blood pool. The areas of radioactivity localization correlated with the tumor nodules found in the liver lobes and peritoneal walls as observed by MRI and postmortem dissection. MRI also revealed minor ascites along the peritoneal cavity (area with high contrast). The tumor nodules were removed post-mortem and radioactivity measured to confirm the observation from PET and MRI. A similar pattern was observed in mice with 7 d tumor burden; however more aggressive growth and spread of the tumor was visualized over 1, 3 and 5 d after injection by significant increase in area of radioactivity localization (Fig. 4B and Suppl. Fig. 3). MRI revealed significant ascites around the tumors in the peritoneal cavity and the liver lobes, significant accumulation of ascites was also observed along the diaphragm wall. The largest cancerous mass (over 1 cm3) was observed along peritoneal walls of mice with 7-d tumor burden group at day 5 of imaging. In non-tumor bearing mice, most of the radioactivity was localized in the organs such as heart and lung representing blood pool activity (Fig. 4C). No significant accumulation of radioactivity was observed in the peritoneal area. Similar to the biodistribution data, counts/cm3 decreased with increasing tumor burden and growth. At 5 d, the counts/cm3 in the tumor region with highest intensity from mice with 3 d tumor burden group were more than 2-fold greater than the corresponding group of mice with 7 d tumor burden.
Figure 4.

(A) Representative reconstructed and processed maximum-intensity PET projections and corresponding T2-weighed coronal MRI slice of female athymic (NCr) nu/nu mouse bearing intraperitoneal LS-174T tumors (3 d burden), (B) mouse bearing intraperitoneal LS-174T tumors (7 d burden) and (C) non-tumor bearing mouse. Scale represents percentage of maximum and minimum threshold intensity. Tumors are indicated with white arrows.
PET and MRI in metastatic pulmonary colorectal carcinoma model
PET imaging was performed in non-tumor bearing mice and mice bearing pulmonary LS-174T tumors (5 d tumor burden). All mice were injected i.v. with 1.7–1.9 MBq (< 5 μg) of 89Zr labeled panitumumab (Fig. 5 and Suppl. Fig.4). After completion of PET imaging at 5 d, T2-weighed MRI was performed to localize tumors and correlate localization of the radioactivity as observed by PET imaging and therefore determine the tumor targeting characteristics of the RIC. In tumor bearing mice, 1 d after injection, most of the radioactivity accumulated in the thoracic region, with significant accumulation of radioactivity on the left side (seen as a bright spot from the dorsal view) (Fig. 5A). Over a period of 3 and 5 d, the blood pool activity decreased significantly, while the activity increased in thoracic region (bright spots), indicative of possible tumor locations (Fig. 5A and Suppl.Fig.4). The accumulation of radioactivity in the thoracic region was significantly lower in non-tumor bearing mice (Fig. 5B). MRI performed at 5 d after injection, confirmed the tumor in left corner of the thoracic cavity where the radioactivity had accumulated. The tumor nodules were in the range of 70–150 cm3. Additionally, significant effusion (high contrast) was observed above the diaphragm and thoracic region and pleural lining. However, a significant tumor mass was not detected in the upper thoracic region where two other bright spots from PET were located. On further observation the two bright spots were symmetrical and possibly mediastinal lymph nodes (Suppl. fig. 5). Based on comparison with non-tumor bearing mice, the accumulation of the radioactivity in mediastinal nodes was most likely due to tumor metastasis (Suppl. fig.5). However, due to logistical reasons, no histopathology was performed to confirm the status of these lymph nodes.
Figure 5.
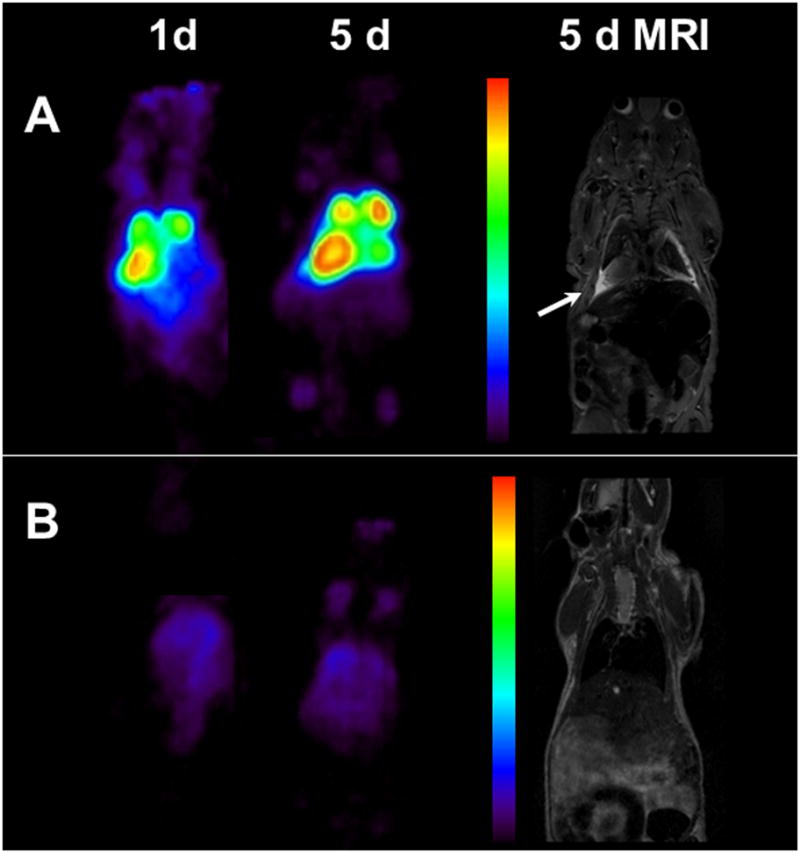
(A) Representative reconstructed and processed maximum-intensity PET projections and corresponding T2-weighed coronal MRI slice of female athymic (NCr) nu/nu mouse bearing pulmonary metastatic LS-174T tumors and (B) non-tumor bearing mouse. Scale represents percentage of maximum and minimum threshold intensity. Tumors are indicated with white arrows.
Discussion
Imaging plays an important role in the management of patients of mCRC. Anatomical and functional imaging techniques have led to significant improvements in therapeutic interventions and management of mCRC. However, detection of colorectal peritoneal carcinomatosis and pulmonary metastases with imaging remains a challenge, and performance of different diagnostic methods commonly utilized is inadequate. In this study, a multimodal approach of T2-weighed MRI with HER1-targeted immunoPET was utilized to successfully detect and image sites of metastases and spread of tumor mass in the peritoneal and thoracic cavity. MRI combined with 89Zr-panitumumab immunoPET revealed HER1 status and accessibility of mAb to different sites in three different models of metastases. Significant differences were observed in the tumor uptake in HER1-positive s.c LS-174T and HER1-negative s.c A375 tumor models. The cumulative activity in LS-174T tumors was at least 4 times greater than that of A375 tumors (Suppl. fig. 2). Furthermore, injection of the tumor bearing mice with 0.1 mg panitumumab successfully blocked the uptake of 89Zr labeled panitumumab (Fig. 1B and 3). No differences were observed in HER1-negative A375 model (Fig. 1B and suppl. fig. 2) and therefore demonstrating the HER1-specificity and targeting of the 89Zr-panitumumab.
In addition to changes observed between HER1-positive and HER1-negative tumor models, 89Zr-panitumumab biodistribution differed in mice bearing LS-174T s.c, i.p (3 and 7 d tumor burden) and thoracic tumors. Peak tumor uptake of 40 % ID/g was observed at 3–4 d after injection for the s.c. model in contrast to 75 % ID/g at 2 d after injection for the thoracic tumors and 95 % ID/g at 1–2 d after injection for the intraperitoneal tumors (Fig 1, Tables 1 & 2). Tumor uptake in mice bearing intraperitoneal tumors (3 d tumor burden) was almost twice that of mice bearing intraperitoneal tumors (7 d tumor burden); positive correlation was observed with tumor uptake and tumor weight (Fig. 2). These observations may be due to multiple factors including interstitial fluid pressure, tumor vasculature and target expression in tumors at different locations and sites, which are currently under investigation. Additionally, the role of ascites as a barrier in antibody tumor targeting and disposition also needs to be investigated to better understand the dynamics of utilizing monoclonal antibodies as targeting vehicles. In addition to tumor uptake, blood clearance was significantly different among the models studied with the fastest clearance observed in mice bearing intraperitoneal tumors as compared to the s.c and thoracic tumor models. At 5 d, the levels of radioactivity in the blood of mice bearing intraperitoneal tumors was at least 4.5 times lower than corresponding levels of mice bearing thoracic tumors (0.78 ± 0.11 v.s. 3.70 ± 0.42, respectively). Similarly, tumor to blood ratio for mice bearing intraperitoneal tumors was more than 2.5 times greater than mice bearing thoracic tumors at 5 d after injection. Difference in blood clearance may be related to target-mediated drug disposition and may provide some valuable insights into the role of lesion locations and tumor burden on the pharmacokinetics of the radiolabeled antibody. The differential uptake in lesions at different locations has also been observed in patients (11, 16). In breast cancer patients imaged with 89Zr-trastuzumab, metastatic lesion in the liver had significantly higher uptake than those in the bone and brain (16). In squamous cell lung carcinoma patients imaged with 111In labeled 225 (murine version of cetuximab targeting HER1), at least 40 mg of excess 225 co-injection was required to visualize metastatic sites as compared 20 mg for primary tumors (11). The same study also reported very high liver uptake in patients, presumably due to expression of HER1 in liver hepatocytes which may pose challenges for imaging of liver metastases. In our opinion, the biodistribution of radiolabeled panitumumab may differ from radiolabeled cetuximab due to differences in binding sites and epitope. With successful clinical translation, 89Zr labeled panitumumab can potentially be used an imaging tool to provide quantitative information of molecular interactions of panitumumab with HER1 expressed on primary tumor and metastatic lesions of mCRC. 89Zr labeled panitumumab can also enable the confirmation of tumor targeting and the quantification of panitumumab accumulation at different target sites and normal organs particularly when the antibody uptake in the tumor is independent of HER1 expression measured by IHC and western blot (14, 23). Imaging with 89Zr labeled panitumumab may also provide information determine target saturation of therapeutic doses at the primary tumor, metastatic lesions and normal organ. Such information would be beneficial in the design of treatment schedules and adapted to improve treatment efficacy and/or reduce toxicity and therefore facilitating better management of mCRC patients. However, 89Zr labeled panitumumab by itself may not predict efficacy or therapeutic outcomes as other factors such KRAS and V-raf murine sarcoma viral oncogene homolog B1 (BRAF) oncogene mutations are critical for response to panitumumab immunotherapy (24–26). Thus, the role of panitumumab imaging may be complementary and best used together with assays to determine v-kis-ras2 Kirsten rat sarcoma viral oncogene mutations and HER1 gene amplification and polymorphism.
Conclusion
In conclusion, as a prelude to clinical translation a pre-clinical study with 89Zr labeled panitumumab was performed. This study demonstrates the potential utility of 89Zr labeled panitumumab in assessment of HER1 status in distant metastases and understanding the differences in antibody uptake at different lesion sites. Eventually, 89Zr labeled panitumumab can play a role in the personalized healthcare of mCRC to assess target expression and panitumumab accumulation in all tumor lesions and normal tissues, non-invasively and quantitatively.
Supplementary Material
Acknowledgments
Financial support: The Intramural Research Program of the NIH, NCI, Center for Cancer Research and the United States Department of Health and Human Services.
We are thankful to Lawrence Szajek (Clinical Center, NIH) for his assistance in irradiating the yttrium target. This research was supported by the Intramural Research Program of the National Institutes of Health, National Cancer Institute, and Center for Cancer Research, and the U.S. Department of Health and Human Services.
Footnotes
Authors declare no conflict of interests.
References
- 1.Jemal A, Bray F, Center MM, Ferlay J, Ward E, Forman D. Global cancer statistics. CA: a cancer journal for clinicians. 2011;61(2):69–90. doi: 10.3322/caac.20107. [DOI] [PubMed] [Google Scholar]
- 2.Maggiori L, Elias D. Curative treatment of colorectal peritoneal carcinomatosis: current status and future trends. Eur J Surg Oncol. 2010;36(7):599–603. doi: 10.1016/j.ejso.2010.05.007. [DOI] [PubMed] [Google Scholar]
- 3.Mitry E, Guiu B, Cosconea S, Jooste V, Faivre J, Bouvier AM. Epidemiology, management and prognosis of colorectal cancer with lung metastases: a 30-year population-based study. Gut. 2010;59(10):1383–1388. doi: 10.1136/gut.2010.211557. [DOI] [PubMed] [Google Scholar]
- 4.Normanno N, De Luca A, Salomon DS, Ciardiello F. Epidermal growth factor-related peptides as targets for experimental therapy of human colon carcinoma. Cancer detection and prevention. 1998;22(1):62–67. [PubMed] [Google Scholar]
- 5.Ciardiello F, Kim N, Saeki T, et al. Differential expression of epidermal growth factor-related proteins in human colorectal tumors. Proceedings of the National Academy of Sciences of the United States of America. 1991;88(17):7792–7796. doi: 10.1073/pnas.88.17.7792. [DOI] [PMC free article] [PubMed] [Google Scholar]
- 6.Mayer A, Takimoto M, Fritz E, Schellander G, Kofler K, Ludwig H. The prognostic significance of proliferating cell nuclear antigen, epidermal growth factor receptor, and mdr gene expression in colorectal cancer. Cancer. 1993;71(8):2454–2460. doi: 10.1002/1097-0142(19930415)71:8<2454::aid-cncr2820710805>3.0.co;2-2. [DOI] [PubMed] [Google Scholar]
- 7.Amador ML, Hidalgo M. Epidermal growth factor receptor as a therapeutic target for the treatment of colorectal cancer. Clinical colorectal cancer. 2004;4(1):51–62. doi: 10.3816/ccc.2004.n.010. [DOI] [PubMed] [Google Scholar]
- 8.Chung KY, Shia J, Kemeny NE, et al. Cetuximab shows activity in colorectal cancer patients with tumors that do not express the epidermal growth factor receptor by immunohistochemistry. J Clin Oncol. 2005;23(9):1803–1810. doi: 10.1200/JCO.2005.08.037. [DOI] [PubMed] [Google Scholar]
- 9.Hebbar M, Wacrenier A, Desauw C, et al. Lack of usefulness of epidermal growth factor receptor expression determination for cetuximab therapy in patients with colorectal cancer. Anti-cancer drugs. 2006;17(7):855–857. doi: 10.1097/01.cad.0000217425.44584.9f. [DOI] [PubMed] [Google Scholar]
- 10.Van Dongen GA, Vosjan MJ. Immuno-positron emission tomography: shedding light on clinical antibody therapy. Cancer biotherapy & radiopharmaceuticals. 2010;25(4):375–385. doi: 10.1089/cbr.2010.0812. [DOI] [PubMed] [Google Scholar]
- 11.Divgi CR, Welt S, Kris M, et al. Phase I and imaging trial of indium 111-labeled anti-epidermal growth factor receptor monoclonal antibody 225 in patients with squamous cell lung carcinoma. Journal of the National Cancer Institute. 1991;83(2):97–104. doi: 10.1093/jnci/83.2.97. [DOI] [PubMed] [Google Scholar]
- 12.Nayak TK, Brechbiel MW. Radioimmunoimaging with longer-lived positron-emitting radionuclides: potentials and challenges. Bioconjugate chemistry. 2009;20(5):825–841. doi: 10.1021/bc800299f. [DOI] [PMC free article] [PubMed] [Google Scholar]
- 13.Niu G, Li Z, Xie J, Le QT, Chen X. PET of EGFR antibody distribution in head and neck squamous cell carcinoma models. J Nucl Med. 2009;50(7):1116–1123. doi: 10.2967/jnumed.109.061820. [DOI] [PMC free article] [PubMed] [Google Scholar]
- 14.Nayak TK, Garmestani K, Baidoo KE, Milenic DE, Brechbiel MW. Preparation, biological evaluation, and pharmacokinetics of the human anti-HER1 monoclonal antibody panitumumab labeled with 86Y for quantitative PET of carcinoma. J Nucl Med. 2010;51(6):942–950. doi: 10.2967/jnumed.109.071290. [DOI] [PMC free article] [PubMed] [Google Scholar]
- 15.Nayak TK, Garmestani K, Milenic DE, Baidoo KE, Brechbiel MW. HER1-Targeted 86Y-Panitumumab Possesses Superior Targeting Characteristics than 86Y-Cetuximab for PET Imaging of Human Malignant Mesothelioma Tumors Xenografts. PLoS ONE. 2011;6(3):e18198. doi: 10.1371/journal.pone.0018198. [DOI] [PMC free article] [PubMed] [Google Scholar]
- 16.Dijkers EC, Oude Munnink TH, Kosterink JG, et al. Biodistribution of 89Zr-trastuzumab and PET imaging of HER2-positive lesions in patients with metastatic breast cancer. Clinical pharmacology and therapeutics. 2010;87(5):586–592. doi: 10.1038/clpt.2010.12. [DOI] [PubMed] [Google Scholar]
- 17.Dadachova E, Chappell LL, Brechbiel MW. Spectrophotometric method for determination of bifunctional macrocyclic ligands in macrocyclic ligand-protein conjugates. Nuclear medicine and biology. 1999;26(8):977–982. doi: 10.1016/s0969-8051(99)00054-2. [DOI] [PubMed] [Google Scholar]
- 18.Meares CF, McCall MJ, Reardan DT, Goodwin DA, Diamanti CI, McTigue M. Conjugation of antibodies with bifunctional chelating agents: isothiocyanate and bromoacetamide reagents, methods of analysis, and subsequent addition of metal ions. Analytical biochemistry. 1984;142(1):68–78. doi: 10.1016/0003-2697(84)90517-7. [DOI] [PubMed] [Google Scholar]
- 19.Ray GL, Baidoo KE, Wong KJ, et al. Preclinical evaluation of a monoclonal antibody targeting the epidermal growth factor receptor as a radioimmunodiagnostic and radioimmunotherapeutic agent. British journal of pharmacology. 2009;157(8):1541–1548. doi: 10.1111/j.1476-5381.2009.00327.x. [DOI] [PMC free article] [PubMed] [Google Scholar]
- 20.Nayak TK, Regino CA, Wong KJ, et al. PET imaging of HER1-expressing xenografts in mice with 86Y-CHX-A″-DTPA-cetuximab. European journal of nuclear medicine and molecular imaging. 2010;37(7):1368–1376. doi: 10.1007/s00259-009-1370-z. [DOI] [PMC free article] [PubMed] [Google Scholar]
- 21.Milenic DE, Garmestani K, Brady ED, et al. Multimodality therapy: potentiation of high linear energy transfer radiation with paclitaxel for the treatment of disseminated peritoneal disease. Clin Cancer Res. 2008;14(16):5108–5115. doi: 10.1158/1078-0432.CCR-08-0256. [DOI] [PMC free article] [PubMed] [Google Scholar]
- 22.Gibaldi M, Perrier D. Pharmacokinetics. 2. New York: Dekker; 1982. [Google Scholar]
- 23.Aerts HJ, Dubois L, Perk L, et al. Disparity between in vivo EGFR expression and 89Zr-labeled cetuximab uptake assessed with PET. J Nucl Med. 2009;50(1):123–131. doi: 10.2967/jnumed.108.054312. [DOI] [PubMed] [Google Scholar]
- 24.Peeters M, Siena S, Van Cutsem E, et al. Association of progression-free survival, overall survival, and patient-reported outcomes by skin toxicity and KRAS status in patients receiving panitumumab monotherapy. Cancer. 2009;115(7):1544–1554. doi: 10.1002/cncr.24088. [DOI] [PubMed] [Google Scholar]
- 25.Amado RG, Wolf M, Peeters M, et al. Wild-type KRAS is required for panitumumab efficacy in patients with metastatic colorectal cancer. J Clin Oncol. 2008 Apr 1;26(10):1626–1634. doi: 10.1200/JCO.2007.14.7116. [DOI] [PubMed] [Google Scholar]
- 26.Bardelli A, Siena S. Molecular mechanisms of resistance to cetuximab and panitumumab in colorectal cancer. J Clin Oncol. 2010;28(7):1254–1261. doi: 10.1200/JCO.2009.24.6116. [DOI] [PubMed] [Google Scholar]
Associated Data
This section collects any data citations, data availability statements, or supplementary materials included in this article.