

Abstract
Nanoparticle biological activity, biocompatibility and fate can be directly affected by layers of readily adsorbed host proteins in biofluids. Here, we report a study on the interactions between human blood plasma proteins and nanoparticles with a controlled systematic variation of properties using 18O-labeling and LC-MS-based quantitative proteomics. We developed a novel protocol to both simplify isolation of nanoparticle bound proteins and improve reproducibility. LC-MS analysis identified and quantified 88 human plasma proteins associated with polystyrene nanoparticles consisting of three different surface chemistries and two sizes, as well as, for four different exposure times (for a total of 24 different samples). Quantitative comparison of relative protein abundances was achieved by spiking an 18O-labeled “universal” reference into each individually processed unlabeled sample as an internal standard, enabling simultaneous application of both label-free and isotopic labeling quantification across the entire sample set. Clustering analysis of the quantitative proteomics data resulted in distinctive patterns that classified the nanoparticles based on their surface properties and size. In addition, temporal data indicated that the formation of the stable protein corona was at equilibrium within 5 min. The comprehensive quantitative proteomics results obtained in this study provide rich data for computational modeling and have potential implications towards predicting nanoparticle biocompatibility.
Keywords: Corona, Human plasma, LC-MS, Nanoparticle, Quantitative proteomics
1 Introduction
Nanomaterials with dimensions ranging from 1–100 nm offer many exciting developments in biomedicine and technology, due to their unique properties that give them unusual catalytic or chemical reactivity. However, relatively little is known about the potential biological risks from nanomaterials and concerns have been raised that the unique properties of nanomaterials may produce unexpected toxicity in biological systems [1]. When suspended in human blood plasma, nanoparticles are readily coated with plasma proteins [2–4]. This protein “corona”, which can be envisaged as consisting of a “shell” whose constituent proteins have high affinity for the nanoparticle surface and a loose peripheral layer that is much less stable, is constantly exchanging with the “free” proteins in the plasma. In particular, the greater stability and persistence of the corona proteins is likely to have substantial biological implications in the transport, disposition and clearance processes. For example, in terms of the biological response, the more abundant proteins in the biofluids do not necessarily have the most marked binding; a less abundant protein with high affinity and specificity may instead be a key player. It is thus essential to develop methods to identify and quantify both major and minor particle-associated proteins, and to study the competition amongst the bound proteins when the system is under kinetic or thermodynamic control. This information can then be used to develop mathematical models to quantify and predict the protein-nanoparticle interactions.
Dawson and his co-workers have pioneered the investigation of nanoparticle-protein interaction using various approaches [5–10]. For example, they identified plasma proteins adsorbed on different nanoparticles using SDS-PAGE, in-gel digestion and MS [6, 9]; Cedervall et al. determined exchange rates and affinities of proteins for nanoparticles using isothermal titration calorimetry, surface plasmon resonance, and gel filtration and SDS-PAGE [7]; and multiple of their studies indicated that particle size and hydrophobicity played important roles in protein adsorption to nanoparticles [7–9]. However, many of these studies were carried out using individual proteins and in general a quantitative and “identity-based” global protein profile representing the adsorption to nanoparticle is not available. Recently, the serum proteins bound to nanoparticles were studied quantitatively using the ICAT approach [11], however only three different nanoparticles were examined without consideration of other defined factors, e.g., size and surface charge.
In this study, we report a temporal quantitative proteomics analysis of human plasma proteins that are associated with nanoparticles with different size and surface properties using the accurate mass and time (AMT) tag strategy [12] and the 18O-labeled “universal” reference based quantification [13]. The AMT tag strategy provides high throughput, large dynamic range of detection, and high sensitivity for peptide/protein identification and quantification without the need for MS/MS (hence mitigating the limitations in coverage due to “shotgun” selection of species for attempted identification [14]). More recently, isotopic labeling coupled with the AMT tag strategy has been applied to large-scale proteome analysis in human blood serum to achieve accurate quantification of protein expression [13, 15, 16]. The universal 18O labeling approach, as one step that goes beyond the conventional pair wise comparison, now allows for direct comparison of many samples across multiple conditions by spiking an 18O-labeled universal reference as internal standard into each individually processed unlabeled sample, enabling direct application of label-free quantification across the sample set simultaneously along with the labeling approach [13]. In addition, novel protocols for isolating and preparing the nanoparticle bound proteins for MS analysis were developed to optimize and simplify the experimental procedure for improved reproducibility in large-scale quantitative analysis. The results obtained herein by employing the aforementioned approaches provide us not only the most comprehensive catalogs of nanoparticle bound blood plasma proteins, but also the important capability to classify these different nanoparticles through global quantitative analysis of their binding proteins, which forms a basis for future efforts to establish mathematical models for predicting nanoparticle surface chemistry interactions.
2 Materials and Methods
2.1 Materials
50 nm and 100 nm amine-modified polystyrene latex particles labeled with blue and orange fluorophores, respectively, were purchased from Sigma (St. Louis, MO, USA). 50 nm and 100 nm unmodified and carboxylate-modified polystyrene latex particles (all labeled with yellow-green fluorophores) were purchased from Polysciences (Warrington, PA, USA). All nanoparticles were used as received, and their size, zeta potential, and other properties were characterized in the relevant experimental conditions [9]. Both mouse blood plasma and human blood plasma were purchased from Equitech-Bio, Inc. (Kerrville, TX, USA). All other chemicals were purchased from Sigma unless otherwise noted.
2.2 Protocol optimization
To optimize the isolation of nanoparticle bound protein, two different procedures were performed in parallel using mouse plasma and the 50 nm amine-modified nanoparticles. Briefly, 100 μL of mouse plasma (~50 μg/μL) was mixed with 100 μL of the 50 nm aminemodified nanoparticle suspension solution (2.5% w/w in PBS) and incubated at 37 °C for 1 h with shaking at 500 rpm. The nanoparticles were pelleted at 4000 × g for 10 min, and washed three times in 0.5 mL PBS, after which the bound proteins were eluted and digested in two different ways.
1. SDS buffer elution
After the last wash, the nanoparticles were suspended in 200 μL of 1% SDS and 100 mM Tris buffer (pH 7.5) for 1 h at room temperature to elute the bound proteins from the nanoparticles. The nanoparticles were then removed from the elution buffer via centrifugation at 16,000 × g at 4 °C for 60 min. 1 mL of cold acetone was added to the eluent and kept at −20 °C overnight to precipitate the proteins. After centrifugation, the protein pellet was washed three times with 0.5 mL of cold acetone. After drying the acetone from the tube, the protein pellet was dissolved in 50 mM NH4HCO3 (pH 7.8) by vortexing and brief sonication. The dissolved proteins were reduced by 5 mM DTT in 50% trifluoroethanol (TFE) at room temperature for 0.5 h and then diluted 10 times using 50 mM NH4HCO3. 10 μg sequencing grade modified porcine trypsin (Promega, Madison, WI, USA) was added to digest proteins overnight at 37 °C.
2. On-nanoparticle digestion
After last wash, the nanoparticles were suspended in 100 μL of 5 mM DTT in 50% TFE and incubated at room temperature for 0.5 h, and diluted 10 times using 50 mM NH4HCO3. 10 μg trypsin was then added to digest the bound proteins overnight at 37 °C. The tryptic peptides were recovered from the supernatant after centrifugation of the sample at 16,000 × g at 4 °C for 60 min.
To serve as a reference (without nanomaterials), proteins from another aliquot of 100 μL mouse plasma were directly precipitated using cold acetone and digested following the same procedure described in the SDS buffer elution protocol. The experimental strategy is illustrated in Figure 1. All peptide concentrations were accessed using the BCA protein assay (Pierce, Rockford, IL, USA).
Figure 1.

Experimental scheme of protocol optimization using mouse blood plasma and the 50 nm amine-modified nanoparticles.
2.3 Nanoparticle interaction with human blood plasma protein
100 μL of suspension solutions of each of the 6 types of nanoparticles were incubated separately with 100 μL of human plasma for 5 min, 15 min, 1 h, and 5 h. After washing three times, the bound proteins were reduced and digested using the “on-nanoparticle digestion” procedure.
2.4 Trypsin-catalyzed 18O-labeling
Trypsin-catalyzed 18O-labeling was performed as previously described [17]. Briefly, equal amount of peptides from each of the 24 samples (6 different nanoparticles 4 time points each) were pooled to create a “universal” reference peptide sample. The reference peptide sample was lyophilized to dryness and reconstituted in 200 μL of 50 mM NH4HCO3 and 1 mM CaCl2 in 18O-enriched water (95%, ISOTEC, Miamisburg, OH, USA). Trypsin was then added in a 1:50 trypsin:peptide ratio to the pooled reference sample and allowed to mix continuously for 5 h at 37 °C. After labeling, the sample was boiled for 10 min, acidified by adding 10 μL of formic acid and lyophilized, after which it was reconstituted in 25 mM NH4HCO3. The peptide concentration of the 18O-labeled reference sample was measured and adjusted to 0.5 μg/μL, mixed with equal amount of the 24 original experimental samples that were adjusted to the same concentration of 0.5 μg/μL, and subjected to LCMS analysis.
2.5 LC-MS/MS and LC-MS analyses
A fully automated in-house built 4-column HPLC system [18] equipped with in-house packed capillary columns (3-μm C18, 60 cm long, 360 μm od, and 75 μm id) was used. The HPLC was operated under 10 kpsi constant pressure (~500 nL/min flow rate) using mobile phase consisted of 0.1% formic acid in water (A) and acetonitrile (B). 5 μL of each sample was injected for analysis. MS data were acquired for 100 min, corresponding to an exponential gradient of 0–63% of acetonitrile. Peptides obtained from mouse plasma nanoparticle bound proteins were analyzed by an LTQ mass spectrometer (Thermo Scientific, San Jose, CA, USA) and the eight most intensive peaks in the previous MS spectrum were selected for MS/MS in the linear ion trap. All 16O/18O mixed sample were analyzed by a LTQ-Orbitrap mass spectrometer (Thermo Scientific) with data collected from 400–2000 m/z at a resolution of 60,000 (automatic gain control (AGC) target: 1×10⁶) followed by data dependent ion trap MS/MS spectra (AGC target: 1×10⁴) of the six most abundant ions using a collision energy setting of 35%. A dynamic exclusion time of 60 s was used to discriminate against previously analyzed ions on both instruments.
2.6 Data Analysis
Mouse blood plasma protocol development LC-MS/MS data were generated on a LTQ mass spectrometer and subsequently searched by SEQUEST (Thermo Scientific) against the mouse International Protein Index database (version 3.52; consisting of 55,216 protein entries; available on line at www.ebi.ac.uk/IPI) using a parameter file consisting of a dynamic modification of oxidation (mass shift 15.995 Da) on methionine. The peptide identifications were filtered by stringent criteria established by using a decoy database search to limit the false positive rate to <1% at the peptide level [19–21].
Quantitative analysis of human blood plasma proteins bound to nanoparticles utilized the AMT tag approach [22]. A suite of in-house informatics tools were used to process LC-LTQ-Orbitrap data and correlate the resulting LC-MS features to a previously established AMT tag database containing the characteristic accurate mass and LC separation elution time for human plasma proteins [15, 23]. The initial analysis of raw LC-MS data involved a deisotoping step using Decon2LS [24]. Further downstream data analysis incorporated all of the possible detected peptides into a feature matching and visualization program VIPER [25] to correlate the LC-MS features to the peptide identifications in the AMT tag database and identify and quantify isotopically labeled 18O/16O peptide pairs. The Viper results were matched with a refined mass tolerance of ±2ppm and a refined normalized elution time (NET) tolerance of ±2%. These results were further filtered by keeping only those LC-MS identifications which met the following peak matching criteria, mass error <0.5 ppm and NET <1% in at least one LC-MS analysis. The ‘ProteinProphet’ program [26] was used to define non-redundant protein groups as previously described [23]. In DAnTE [27], label-free and 18O-labeling quantification were performed by converting peptide peak intensity and 16O/18O ratio values to a logarithmic scale (Log2), respectively, followed by normalization with a Central Tendency algorithm, and roll-up to the protein level. R-rollup parameters included a 2 dataset minimum presence of at least one peptide for a protein. Each reported protein identification has at least 2 unique peptides. DAnTE was also used for visualization of the resulting protein abundances as heatmaps, unsupervised hierarchical clustering analysis, and statistical comparison of protein abundances in each sample (ANOVA).
3 Results
3.1 Protocol optimization for isolation and tryptic digestion of nanoparticle bound proteins
Previously published studies have utilized SDS detergent (e.g., SDS-sample buffer) to elute the bound proteins from nanoparticles [7, 9, 11]. However, in these protocols subsequent clean-up steps, such as acetone precipitation or SDS-PAGE followed by in-gel digestion are needed to isolate the eluted proteins from detergents prior to LC-MS analysis. These clean-up steps are not only laborious, but also affect the overall reproducibility and quantification accuracy. To simplify the isolation procedure of nanoparticle bound proteins, we developed and compared an “on-nanoparticle digestion” protocol in parallel with the conventional SDS buffer elution protocol using the 50 nm amine-modified nanoparticles and mouse plasma as outlined in Figure 1. Our results showed that the “on-nanoparticle digestion” protocol provided similar proteome coverage as the “SDS buffer elution” protocol (Figure 2a; details of the protein and peptide identifications are available in Supplementary Tables 1 and 2a-c). However, the yield of the “on-nanoparticle digestion” protocol was substantially higher and more reproducible than that of the “SDS buffer elution” protocol (193 μg with a RSD of 3.6% versus 109 μg with a RSD of 8.4%). The “on-nanoparticle digestion” protocol also showed high reproducibility in protein identifications (92.9%; see Figure 2b) when comparing three process replicates using mouse plasma and 50 nm carboxylate modified nanoparticles (details of the protein and peptide identifications are available in Supplementary Tables 3 and 4a-c). The trypsin cleavage behavior in the “on-nanoparticle digestion” protocol appeared to be normal, e.g., no obvious change was observed in the miscleavage and fully/partially tryptic peptide ratio when compared to that of in-solution trypsin digestion in the acetone-precipitated reference sample (data not shown).
Figure 2.
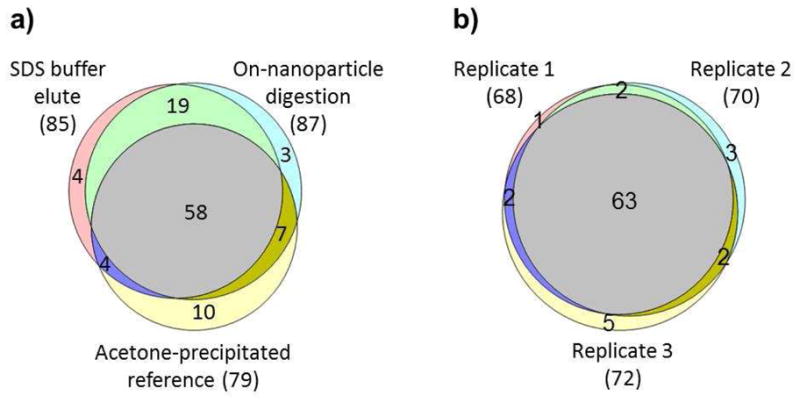
Evaluation of the performance of the “SDS buffer elution” protocol and the “on-nanoparticle” digestion protocol. Numbers of identified mouse plasma proteins are shown for acetone-precipitated reference (without nanoparticle), and 50 nm amine-modified nanoparticle bound protein using “SDS buffer elution” and “on-nanoparticle digestion” protocol, respectively (a). The overlap of mouse plasma proteins identified from three process replicates using 50 nm carboxylate-modified nanoparticles was shown for “on-nanoparticle digestion” protocol (b).
The identified nanoparticle bound proteins were also compared with the protein list in the previous report [9], which presents a set of similar protein identifications to this study. Interestingly, when compared to the acetone-precipitated reference sample, many nanoparticle bound proteins (e.g., apolipoproteins, α-2-HS-glycoprotein) showed significant increases in their relative abundances (spectral counts; see Supplementary Table 1) or were simply not detected in the acetone-precipitated reference sample. In contrast, many abundant proteins in blood plasma, e.g., transferrin, were detected at much lower relative abundance in the nanoparticle bound protein samples, indicating the protein binding on the nanoparticle was not simply proportional to the original protein abundance in the plasma. These findings are consistent with previous reports [9, 11].
3.2 Quantitative analysis of nanoparticle bound proteins
In this study we systematically looked at factors including nanoparticle size (50 nm and 100 nm), nanoparticle surface characteristics (amine, carboxylate and unmodified) and protein exposure time (5 min, 15 min, 1 h, and 5 h) to investigate what factors dictate the interaction between nanoparticles and human plasma proteins.
The quantification analysis of nanoparticle bound proteins from human plasma was performed using enzymatic catalyzed 18O-labeling. An 18O-labeled reference sample prepared from a pool of all digested peptides was spiked into each individual sample to allow simultaneous comparison of the 24 different samples. Nanoparticle bound protein abundances under different conditions were quantified based on 16O/18O isotopic peptide pair abundance ratios (a schematic illustration of the quantitation strategy is shown in Supplementary Figure 1). A total of 829 unique peptides from 153 non-redundant proteins were identified using the AMT tag approach (Supplementary Table 5), with an estimated peptide false positive identification rate of 3.5% by using a decoy AMT tag database with 11-Dalton mass shifts [28]. A total of 88 proteins with at least two unique peptide identifications (from a total of 764 unique peptides) were quantified (Supplementary Table 6), and the relative abundances of these proteins are illustrated as a heat map in Figure 3. Unsupervised hierarchical clustering analysis showed a high correlation between protein binding and nanoparticle surface modification and size, indicating they were significant influential factors of nanoparticle bound protein abundance. On the other hand, the incubation time within the time range used in this study (5 min-5 h) did not identify time-dependent changes in protein binding (Figure 3). Bound Protein abundances of different nanoparticles and time points were also quantified using the label-free peak intensity method, which demonstrated similar clustering analysis results as the 18O-labeling method (Supplementary Figure 2) except for the fact that the orders of the clustering of the 50 nm and 100 nm particles of amine surface with other particles were switched, presumably due to: 1) particle size plays a much smaller role than does the surface chemical properties in determining protein binding; and 2) 18O labeling is less sensitive to relatively smaller changes.
Figure 3.

Unsupervised hierarchical clustering analysis of the relative abundance of human blood plasma proteins bound to nanoparticles with two different sizes (50 nm and 100 nm), three types of surface modifications (amine, carboxylate, and unmodified), and 4 different incubation time periods (5 min, 15 min, 1 h, and 5 h). Color scheme is based on Log2 values of the 16O/18O ratios.
Detailed information, such as biological process and known post-translational modifications (PTMs) on the 88 nanoparticle bound human plasma proteins are contained in Supplemental Table 7. On average these 88 proteins were detected in 87.8% of the datasets and the following immunoglobulin, lipoproteins and complement proteins were detected in 100% of the datasets: Ig alpha-1 chain C region, Ig mu chain C region, Apolipoproteins A-I, A-II, A-IV, B-100, E and L1, and Complement C1r, C1 s, C3, C4-A and factor B (Supplemental Table 6).
3.3 ANOVA analysis of protein-binding factors
Many different physical-chemical properties of nanoparticles, such as size, net charge, hydrophobicity, and surface functional groups, are influential factors for interactions between plasma proteins and nanoparticles. For practical reasons, only three factors, size, surface modification, and incubation time, were implemented in the current study of protein-nanoparticle interactions. ANOVA analysis was performed for each individual factor in terms of protein abundance, and as a result, surface modification and size factors generate 42 and 41 human plasma proteins with significant abundance changes, respectively, while reaction time did not demonstrate any significant influence on the nanoparticle bound protein abundance changes (see Supplementary Table 6). In addition, the 42 and 41 plasma proteins found significantly changed by using factors of surface modification and size, respectively, have only 17 proteins in common, suggesting that these two factors may play independent roles in the interaction between human plasma proteins and nanoparticles. Figure 4 provides two examples (apolipoprotein E and haptoglobin related protein) where nanoparticle bound protein abundances were significantly influenced by surface modifications and nanoparticle sizes (detailed information on all the 88 proteins including p-values, hydrophobicity and pI is available in Supplementary Table 6).
Figure 4.

Nanoparticle-bound protein abundances are significantly influenced by a) surface modifications (Apolipoprotein E) and b) nanoparticle size (haptoglobin related protein).
4 Discussion
Identification and quantification of the proteins that bind to nanomaterials in biological environments, i.e., the protein corona, can provide insights into their biocompatibility and potential clinical applications [29, 30]. The overall objective of this study was to characterize the role of nanoparticle size, surface, and incubation time on plasma protein binding by accurately measuring and comparing protein relative abundances in the protein coronas. Our quantitative strategy that incorporates an 18O-labeled “universal” reference overcomes the limit of applying stable isotope labeling approaches to large sets of biological samples, and is able to provide accurate and reproducible quantitative measurements of relative protein abundances. This strategy can be readily applied to any other biological systems for characterizing protein-nanoparticle interactions.
In previous reports, using the ICAT method Wasdo et al. quantified 25, 33, and 43 human serum proteins that bound to aluminum, diamond and nickel nanoparticles, respectively (requiring at least two unique peptides per protein) [11]; Lundqvist et al. have identified a total of 108 human plasma proteins that bind to 6 different polystyrene nanoparticles (including proteins that have only one unique peptide) [9]. Our new “on-nanoparticle digestion” protocol developed in this study, comparing to the SDS elution [11] and the SDS-PAGE and in-gel digestion methods [9], is simpler, more reproducible, and offers higher yield. As a result of applying the novel sample preparation protocol and quantitative proteomics strategy, we have generated the most comprehensive quantitative dataset to date for the characterization of protein-nanoparticle interactions. A total of 153 human plasma proteins that bind to the same set of 6 polystyrene nanoparticles (88 containing two or more unique peptides) were confidently identified and quantified with high confidence in our study. Moreover for each experimental condition our method only required a single LC-MS analysis instead of multiple LC-MS/MS analyses when the SDS-PAGE and in-gel digestion approaches were used [9]. A direct benefit from our sensitive, reproducible and quantitative measurements is much less “missing” data for comparative studies. For example, Lundqvist et al. observed Ig alpha-1 chain C region in 4 of the 6 nanoparticle conditions (4/6), Ig mu chain C region (4/6), Apolipoproteins A-I (6/6), A-II (2/6), A-IV(5/6), B-100 (4/6), E (4/6) and L1 (2/6), and Complement C1r (1/6), C1 s (3/6), C3 (4/6), C4-A (4/6) and factor B (3/6); we observed all these proteins in 100% of our datasets/nanoparticle conditions (i.e. 24/24), and on average the 88 proteins were detected in 87.8% of the datasets. Over 60% of the proteins reported by Lundqvist et al. [9] overlapped with our data; those did not overlap may due to a number of reasons including differences in sample preparation, LC-MS analysis and data analysis (e.g., different FASTA protein sequence database, different software for removing redundancy in protein identifications).
Considering the highly complicated process of blood plasma protein and nanoparticle interactions, a limited set of nanoparticles and experimental conditions were selected in this study to characterize the dynamic protein binding to nanoparticles with a controlled systematic variation of these properties. The nanoparticles investigated in this study are commercially available polystyrene particles with two different size (50 nm and 100 nm) and three different surface chemical modifications, and their size, zeta potential, and other properties were reported previously in the relevant experimental buffering conditions [9]. The size of nanoparticles defines the relative surface area and topological space for the binding of plasma proteins, while different chemical modifications on the nanoparticle surface present significant surface property changes of charge and/or hydrophobicity. It is therefore not surprising that nanoparticles with different sizes and surface modifications resulted in significant changes in the relative abundances of the nanoparticle bound proteins. As shown in the clustering analyses, it appeared that under the experimental conditions of this study the surface chemical properties and particle size together played a significant role in the protein-nanoparticle interaction, and the surface property appeared to be more impactful on the protein absorption than did the particle size (Figure 3 and Supplementary Figure 2). Note that in our experimental design (the human plasma proteins are in excess amounts in all experiments) the same amount of tryptic peptides from the nanoparticle bound proteins were used for the comparative study, hence the absolute protein abundance are functionally normalized to surface. However, it is the protein relative abundances within each nanoparticle type (i.e., stoichiometry, rather than absolute protein abundance), which is the most important outcome of the protein-nanoparticle binding, that are compared in this study.
Different surface modifications of nanoparticles resulted in 42 plasma proteins that presented significant protein abundance changes based on ANOVA analysis (p<0.05). These 42 proteins were further clustered into 3 subgroups, which have different protein binding patterns for the three different surface modifications (Figure 5a). However, no clear evidence was observed to indicate correlation between the protein abundance change pattern and hydrophobicity or pI of these proteins, except that Cluster 2 proteins have a narrower range of hydrophobicity than the other two (Supplementary Figure 3 and Supplemental Table 6). The same challenges in the exploration of the correlation between protein adsorption and certain protein properties have been reported since the protein binding on the nanoparticles was determined by a combination of many individual protein properties [11].
Figure 5.


Blood plasma proteins that showed differential binding to nanoparticles based on nanoparticle surface properties and size. a) ANOVA analysis generated 42 nanoparticle-bound proteins with significant abundance changes resulting from surface modification factors (p<0.05), which were clustered into three groups with different abundance change patterns. b) Similarly, 41 nanoparticle-bound proteins with significant abundance changes were resulting from nanoparticle size factors (p<0.05), which were clustered into two groups with different abundance change patterns. Color scheme is based on Log2 values of the 16O/18O ratios.
The clustering analysis was also performed on 41 plasma proteins that demonstrated significant protein abundance changes that resulted from nanoparticle size differences based on ANOVA analysis (p<0.05). Two clusters of proteins presented opposite patterns of relative abundance changes between 50 and 100 nm sized particles (Figure 5b). No clear correlation was observed among these two subgroups of protein abundance change pattern and corresponding protein hydrophobicity and pI values, however, most of Cluster 1 proteins appeared to have higher pI values than Cluster 2 proteins (Supplementary Figure 4). 50 nm sized nanoparticles have higher surface curvatures than their 100 nm counterparts, which may result in differential binding of proteins with different geometry or conformations. However, it is still unknown how the surface topology influences the binding of plasma proteins with different properties. It has been pointed out previously [9] that the 100 nm amine-modified polystyrene particles disperse poorly and are more agglomerated in PBS than the other nanoparticles used in our study. This agglomeration may explain, in part, the larger difference observed between the 50- and 100-nm amine-modified nanoparticles.
Recently, a study by Hellstrand et al. identified that the lipid and protein binding patterns correspond closely to the composition of high-density lipoprotein; given the fact that apolipoproteins were identified as binding to a variety of nanoparticles (including all nanoparticles used in our study), it suggests that lipid and lipoprotein binding is a general feature of nanoparticles under physiological conditions [31]. In addition, we note that many of the identified plasma proteins are heavily modified with PTMs (see Supplemental Table 7 for details), e.g., glycosylation. Besides concordant lipid binding, the PTMs may also be affecting the protein-nanoparticle interactions thereby explaining why protein characteristics such as hydrophobicity and pI (theoretical calculations using only the protein amino acid sequence information) have no direct link to the differential binding.
When incubated in human blood plasma, exchange of the protein corona on the nanoparticle surface with the “free” plasma proteins occurs until the components reach equilibrium. Apparently, the four time points in this study ranging from 5 min to 5 h did not appear to be a significant influential factor on this equilibrium, suggesting that protein exchange between the protein corona and blood plasma is a very fast process and the equilibrium may be reached in less than 5 min. This conclusion is consistent with a recent report modeling the time evolution of the nanoparticle-protein corona in blood plasma [10]. Since the isolation of the nanoparticle bound proteins requires at least 5 min centrifugation, the use of even shorter incubation times becomes less feasible (e.g., the four time point samples generated in this study in a sense are actually “process replicates”). However, this observation serves as a precautionary note for future studies for characterizing the dynamic exchange of protein content between nanoparticles and bio-fluids. Novel experimental setups with increased speed in the isolation process, e.g., using nanoparticles with magnetic cores, should be considered.
In summary, our results highlight the complicated nature of the protein binding process onto the nanoparticles; however, it is apparent that this process was largely influenced by nanoparticle surface properties and size as well as the protein properties. The temporal quantitative analysis conducted in this study also suggested that the protein binding onto nanoparticle surface and development of the equilibrium are relatively fast processes. Alternative isolation methods need to be employed to study protein binding and exchange dynamics; adding replicates for each time point would further strengthen the validity of similar study. Nevertheless, through this study, LC-MS-based quantitative proteomics was shown to systematically and comprehensively investigate protein-nanoparticle interactions. In combination with the domain knowledge on opsonins and receptors that are responsible for potential subsequent biological consequences such as phagocytosis, inflammatory and immune response, large-scale quantitative measurements of abundances of the nanoparticle bound proteins will help to feed existing computational models [10, 32] or establish new models for prediction of protein binding behaviors and corresponding biological responses for the nanomaterials.
Supplementary Material
Acknowledgments
Portions of this research were supported by the Pacific Northwest National Laboratory (PNNL) Directed Research Development program (to T.L.), NIH grant ES016212 (to B.D.T.), and the NIH National Center for Research Resources for Integrative Biology RR018522 (to R.D.S.). The experimental work was performed in the Environmental Molecular Sciences Laboratory, a U.S. Department of Energy (DOE) Office of Biological and Environmental Research national scientific user facility on the PNNL campus. PNNL is multiprogram national laboratory operated by Battelle for the DOE under Contract DE-AC05- 76RLO 1830.
Abbreviations
- AMT
accurate mass and time tag
- TFE
trifluoroethanol
- AGC
automatic gain control
Footnotes
The authors have declared no conflict of interest.
References
- 1.Nel A, Xia T, Madler L, Li N. Toxic potential of materials at the nanolevel. Science. 2006;311:622–627. doi: 10.1126/science.1114397. [DOI] [PubMed] [Google Scholar]
- 2.Blunk T, Hochstrasser DF, Sanchez JC, Muller BW, Muller RH. Colloidal carriers for intravenous drug targeting: plasma protein adsorption patterns on surface-modified latex particles evaluated by two-dimensional polyacrylamide gel electrophoresis. Electrophoresis. 1993;14:1382–1387. doi: 10.1002/elps.11501401214. [DOI] [PubMed] [Google Scholar]
- 3.Gessner A, Waicz R, Lieske A, Paulke B, et al. Nanoparticles with decreasing surface hydrophobicities: influence on plasma protein adsorption. Int J Pharm. 2000;196:245–249. doi: 10.1016/s0378-5173(99)00432-9. [DOI] [PubMed] [Google Scholar]
- 4.Labarre D, Vauthier C, Chauvierre C, Petri B, et al. Interactions of blood proteins with poly(isobutylcyanoacrylate) nanoparticles decorated with a polysaccharidic brush. Biomaterials. 2005;26:5075–5084. doi: 10.1016/j.biomaterials.2005.01.019. [DOI] [PubMed] [Google Scholar]
- 5.Linse S, Cabaleiro-Lago C, Xue WF, Lynch I, et al. Nucleation of protein fibrillation by nanoparticles. Proc Natl Acad Sci U S A. 2007;104:8691–8696. doi: 10.1073/pnas.0701250104. [DOI] [PMC free article] [PubMed] [Google Scholar]
- 6.Cedervall T, Lynch I, Foy M, Berggard T, et al. Detailed identification of plasma proteins adsorbed on copolymer nanoparticles. Angew Chem Int Ed Engl. 2007;46:5754–5756. doi: 10.1002/anie.200700465. [DOI] [PubMed] [Google Scholar]
- 7.Cedervall T, Lynch I, Lindman S, Berggard T, et al. Understanding the nanoparticle-protein corona using methods to quantify exchange rates and affinities of proteins for nanoparticles. Proc Natl Acad Sci US A. 2007;104:2050–2055. doi: 10.1073/pnas.0608582104. [DOI] [PMC free article] [PubMed] [Google Scholar]
- 8.Lindman S, Lynch I, Thulin E, Nilsson H, et al. Systematic investigation of the thermodynamics of HSA adsorption to N-iso-propylacrylamide/N-tert-butylacrylamide copolymer nanoparticles. Effects of particle size and hydrophobicity. Nano Lett. 2007;7:914–920. doi: 10.1021/nl062743+. [DOI] [PubMed] [Google Scholar]
- 9.Lundqvist M, Stigler J, Elia G, Lynch I, et al. Nanoparticle size and surface properties determine the protein corona with possible implications for biological impacts. Proc Natl Acad Sci US A. 2008;105:14265–14270. doi: 10.1073/pnas.0805135105. [DOI] [PMC free article] [PubMed] [Google Scholar]
- 10.Dell’Orco D, Lundqvist M, Oslakovic C, Cedervall T, Linse S. Modeling the Time Evolution of the Nanoparticle-Protein Corona in a Body Fluid. PLoS One. 2010;5:e10949. doi: 10.1371/journal.pone.0010949. [DOI] [PMC free article] [PubMed] [Google Scholar]
- 11.Wasdo SC, Barber DS, Denslow ND, Powers KW, et al. Differential binding of serum proteins to nanoparticles. Int J Nanotechnol. 2008;5:92–115. [Google Scholar]
- 12.Smith RD, Anderson GA, Lipton MS, Pasa-Tolic L, et al. An accurate mass tag strategy for quantitative and high-throughput proteome measurements. Proteomics. 2002;2:513–523. doi: 10.1002/1615-9861(200205)2:5<513::AID-PROT513>3.0.CO;2-W. [DOI] [PubMed] [Google Scholar]
- 13.Qian WJ, Liu T, Petyuk VA, Gritsenko MA, et al. Large-scale multiplexed quantitative discovery proteomics enabled by the use of an (18)O-labeled “universal” reference sample. J Proteome Res. 2009;8:290–299. doi: 10.1021/pr800467r. [DOI] [PMC free article] [PubMed] [Google Scholar]
- 14.Qian WJ, Camp DG, 2nd, Smith RD. High-throughput proteomics using Fourier transform ion cyclotron resonance mass spectrometry. Expert Rev Proteomics. 2004;1:87–95. doi: 10.1586/14789450.1.1.87. [DOI] [PubMed] [Google Scholar]
- 15.Qian WJ, Monroe ME, Liu T, Jacobs JM, et al. Quantitative proteome analysis of human plasma following in vivo lipopolysaccharide administration using 16O/18O labeling and the accurate mass and time tag approach. Mol Cell Proteomics. 2005;4:700–709. doi: 10.1074/mcp.M500045-MCP200. [DOI] [PMC free article] [PubMed] [Google Scholar]
- 16.Liu T, Qian WJ, Strittmatter EF, Camp DG, 2nd, et al. High-throughput comparative proteome analysis using a quantitative cysteinyl-peptide enrichment technology. Anal Chem. 2004;76:5345–5353. doi: 10.1021/ac049485q. [DOI] [PubMed] [Google Scholar]
- 17.Petritis BO, Qian WJ, Camp DG, 2nd, Smith RD. A simple procedure for effective quenching of trypsin activity prevention of 18O-labeling back-exchange. J Proteome Res. 2009;8:2157–2163. doi: 10.1021/pr800971w. [DOI] [PMC free article] [PubMed] [Google Scholar]
- 18.Livesay EA, Tang K, Taylor BK, Buschbach MA, et al. Fully automated four-column capillary LC-MS system for maximizing throughput in proteomic analyses. Anal Chem. 2008;80:294–302. doi: 10.1021/ac701727r. [DOI] [PMC free article] [PubMed] [Google Scholar]
- 19.Peng JM, Elias JE, Thoreen CC, Licklider LJ, Gygi SP. Evaluation of multidimensional chromatography coupled with tandem mass spectrometry (LC/LC-MS/MS) for large-scale protein analysis: The yeast proteome. J Proteome Res. 2003;2:43–50. doi: 10.1021/pr025556v. [DOI] [PubMed] [Google Scholar]
- 20.Elias JE, Gygi SP. Target-decoy search strategy for increased confidence in large-scale protein identifications by mass spectrometry. Nat Methods. 2007;4:207–214. doi: 10.1038/nmeth1019. [DOI] [PubMed] [Google Scholar]
- 21.Qian WJ, Liu T, Monroe ME, Strittmatter EF, et al. Probability-based evaluation of peptide and protein identifications from tandem mass spectrometry and SEQUEST analysis: The human proteome. J Proteome Res. 2005;4:53–62. doi: 10.1021/pr0498638. [DOI] [PubMed] [Google Scholar]
- 22.Zimmer JSD, Monroe ME, Qian WJ, Smith RD. Advances in proteomics data analysis and display using an accurate mass and time tag approach. Mass Spectrom Rev. 2006;25:450–482. doi: 10.1002/mas.20071. [DOI] [PMC free article] [PubMed] [Google Scholar]
- 23.Liu T, Qian WJ, Gritsenko MA, Xiao W, et al. High dynamic range characterization of the trauma patient plasma proteome. Mol Cell Proteomics. 2006;5:1899–1913. doi: 10.1074/mcp.M600068-MCP200. [DOI] [PMC free article] [PubMed] [Google Scholar]
- 24.Jaitly N, Mayampurath A, Littlefield K, Adkins JN, et al. Decon2LS: An open-source software package for automated processing and visualization of high resolution mass spectrometry data. BMC Bioinformatics. 2009;10:87. doi: 10.1186/1471-2105-10-87. [DOI] [PMC free article] [PubMed] [Google Scholar]
- 25.Monroe ME, Tolic N, Jaitly N, Shaw JL, et al. VIPER: an advanced software package to support high-throughput LC-MS peptide identification. Bioinformatics. 2007;23:2021–2023. doi: 10.1093/bioinformatics/btm281. [DOI] [PubMed] [Google Scholar]
- 26.Nesvizhskii AI, Keller A, Kolker E, Aebersold R. A statistical model for identifying proteins by tandem mass spectrometry. Anal Chem. 2003;75:4646–4658. doi: 10.1021/ac0341261. [DOI] [PubMed] [Google Scholar]
- 27.Polpitiya AD, Qian WJ, Jaitly N, Petyuk VA, et al. DAnTE: a statistical tool for quantitative analysis of -omics data. Bioinformatics. 2008;24:1556–1558. doi: 10.1093/bioinformatics/btn217. [DOI] [PMC free article] [PubMed] [Google Scholar]
- 28.Petyuk VA, Qian WJ, Chin MH, Wang H, et al. Spatial mapping of protein abundances in the mouse brain by voxelation integrated with high-throughput liquid chromatography-mass spectrometry. Genome Res. 2007;17:328–336. doi: 10.1101/gr.5799207. [DOI] [PMC free article] [PubMed] [Google Scholar]
- 29.Monopoli MP, Bombelli FB, Dawson KA. Nanobiotechnology: nanoparticle coronas take shape. Nat Nanotechnol. 2011;6:11–12. doi: 10.1038/nnano.2011.267. [DOI] [PubMed] [Google Scholar]
- 30.Deng ZJ, Liang M, Monteiro M, Toth I, Minchin RF. Nanoparticle-induced unfolding of fibrinogen promotes Mac-1 receptor activation and inflammation. Nat Nanotechnol. 2011;6:39–44. doi: 10.1038/nnano.2010.250. [DOI] [PubMed] [Google Scholar]
- 31.Hellstrand E, Lynch I, Andersson A, Drakenberg T, et al. Complete high-density lipoproteins in nanoparticle corona. Febs J. 2009;276:3372–3381. doi: 10.1111/j.1742-4658.2009.07062.x. [DOI] [PubMed] [Google Scholar]
- 32.Xia XR, Monteiro-Riviere NA, Riviere JE. An index for characterization of nanomaterials in biological systems. Nat Nanotechnol. 2010;5:671–675. doi: 10.1038/nnano.2010.164. [DOI] [PubMed] [Google Scholar]
Associated Data
This section collects any data citations, data availability statements, or supplementary materials included in this article.