Abstract
Reliability is one important issue in using PEDOT: PSS as a strain gauge for large strain measurements. In our research, PEDOT: PSS strain gauge is fabricated on the polyurethane and porous substrate, which enhances the mechanical property when large strain and cyclic loads are applied to it. Our result shows that with the polyurethane as the substrate adhesion layer, the strain of PEDOT: PSS can go up to 17.7% and stabilize without reference resistance drifting.
Keywords: PEDOT-PSS, Polymer strain gauge
INTRODUCTION
Soft electronics steady becoming popular especially in electric interconnect, flexible display, electric label and organic energy harvesting devices applications [1–3]. One of the important materials among soft electronics is the electric conductive polymer which has been successfully used in place of metal in the soft electronic design [3].
Aside from flexibility and conductivity, conducting polymer also possesses a unique piezoresistive property. One of the common applications for piezoresistive material is strain gauges. However, current metal or semiconductor based strain gages have a limited measurement range of micro-strains [1]. The conductive polymer based strain gages on the other hand due to its flexblity can withstand a much larger tensile strain (>3%) [2] while maintaining the desired conductivity[4].
Among all the conducting polymers, poly (3,4 - ethylenedioxythiophene) : polystyrenesulfonate (PEDOT:PSS) is known for its high conductivity and processability. The conducting part of PEDOT: PSS comes from PEDOT. PSS is basically an insulator. However, it plays an important role in connecting PEDOT to water, which makes PEDOT soluble. Mateiu used intrinsic conducting polymer PEDOT as a strain gauge patterned on the silicon substrate by a conventional photolithography method [5]. PEDOT strain gauge is proven to be comparable to the commercially available strain gauge. However the processability is still a problem if fabrication still relying on traditional photolithography and polymerization. These processes require a higher fabrication cost and more processing time. Lang et al. patterned PEDOT:PSS on polyimide (PI) membranes by a lift-off process and its piezoresistive effect was proven to be effective [6]. On the other hand, due to the solubility of PEDOT:PSS in water, PEDOT:PSS strain gages can be processed by inkjet printing or non-traditional lithography techniques. To fully utilized the piezoresistive nature of PEDOT:PSS in large strain measurement, the critical issue is the reliability of PEDOT:PSS. One of the processing parameter in determining the outcome of its Young’s modulus is humidity [2].
In this paper, we will present the study of PEDOT:PSS for a patterned strain gage on a elastic patch. The eventual goal of this research is create a conductive polymer based strain gage for monitoring large strain measurement. The strain gage is made by depositing PEDOT: PSS on a polymer based matrices. PEDOT:PSS is used here for its high conductivity and solubility in water which is needed for the fabrication technique we are using for this strain gage.
We will present our preliminary results from the load tests and discuss some of the interesting observation from the result. In addition, the sensor’s material and mechanical properties will be investigated using a specially designed load stage which can provide accurate displacement, force and resistance measurement of the strain gauge.
The key advantage of this strain gauge design is in its simple rapid prototyping process, its wide range in electrical resistance (from a tenth of an ohm to kilo ohms), its compatibility to the mechanical properties of embedded material and its flexibility for large strain measurement, with which existing metal and semiconductor strain gauges cannot compete.
Material
The sensor area is made of PEDOT:PSS purchased from H.C. Starck (CLEVIOS-P, Germany). Since the deformation of PEDOT:PSS causes internal structure change, the resistance will change accordingly. The resistance can be calculated from
| (1) |
Where
ℓ is the length of the conductor
A is the cross-sectional area
ρ is the electrical resistivity
PEDOT: PSS is first diluted 50% by deionized water followed by a 30min ultrasonic bath until it is properly mixed. Then 5% Dimethyl sulfoxide (Sigma Aldrich, USA) is added to the diluted PEDOT: PSS and water mixture followed by a 5min ultrasonic bath.
A form based tape is used as the ultra flexible substrate. The foam based substrate is designed for human skin which can be stretched up to 20% of its original length without damage the form. The purpose of using foam based substrate is to prevent the PEDOT:PSS from breaking due to large strain while maintaining the flexibility of the strain gauge.
Fabrication
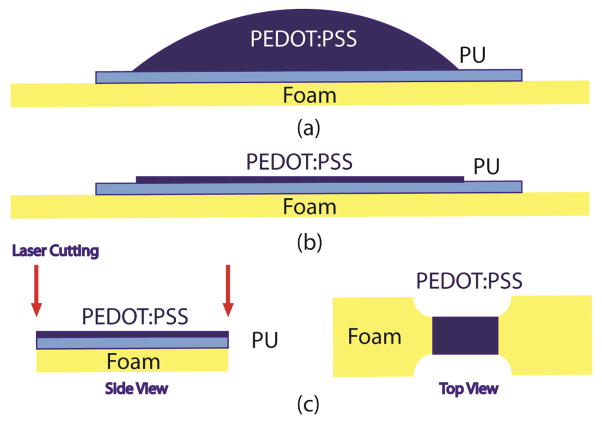
PEDOT: PSS is poured onto the foam substrate separated by an adhesive layer made with Polyurethane (PU). The PU is coated by a spin coater with 500 rpm and lasts for 3 minutes. Without the adhesive layer, the porous foam structure becomes a hydrophobic substrate due to surface tension. This creates a problem in coating the PEDOT: PSS on the foam. The coated PEDOT: PSS is dried at room temperature for 1 day and then the test specimen is cut by a CO2 Laser (Jinan XYZ Tech, China). The power of CO2 laser is set to 10mW, with corner power to 2mW and moving speed to 10mm/second. The dimension of the specimen is shown in figure 1.
Figure 1.
Specimen Dimension
After pouring the PU adhesion layer, the structure is placed at room temperature for 2 hours without additional heating. Then, the PEDOT: PSS is poured onto the layered structure as illustrated in Figure 2(a). The PEDOT: PSS is dried at room temperature for 24 hours with approximately 63% relative humidity leaving the PEDOT: PSS sticking on top of the PU as shown in figure 2(b). The CO2 laser then cuts the layered structure to form the final specimen pattern.
Figure 2.
(a) The PEDOT: PSS solution is poured onto Foam tape with PU adhesion layer in between (b) After 24 hours, the PEDOT: PSS is dried on the foam (c) The dried PEDOT: PSS is further processed by laser cutting and pattern is standard bone shape.
Copper tape is used to connect PEDOT: PSS to the wire as shown Figure 3. The large connecting area from copper to PEDOT: PSS is designed to reduce the contact resistance between PEDOT: PSS and copper. The wire is pre soldered into the copper so that heat from molten solder will not damage the conducting polymer.
Figure 3.
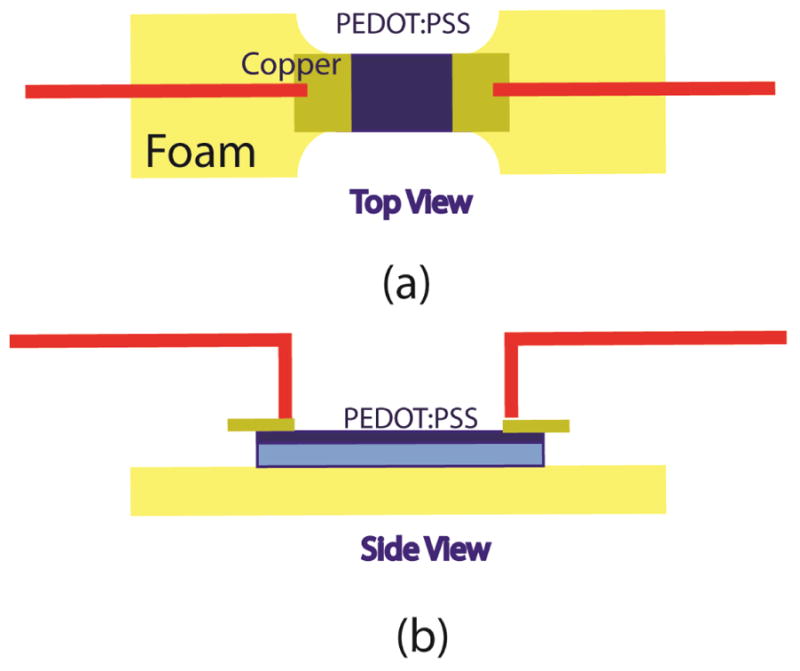
Top view and front view of the PEDOT: PSS strain gauge. The sensor is connected by copper tape to magnetic wire and resistance is measured by 4 points resistance measurement method.
Experimental
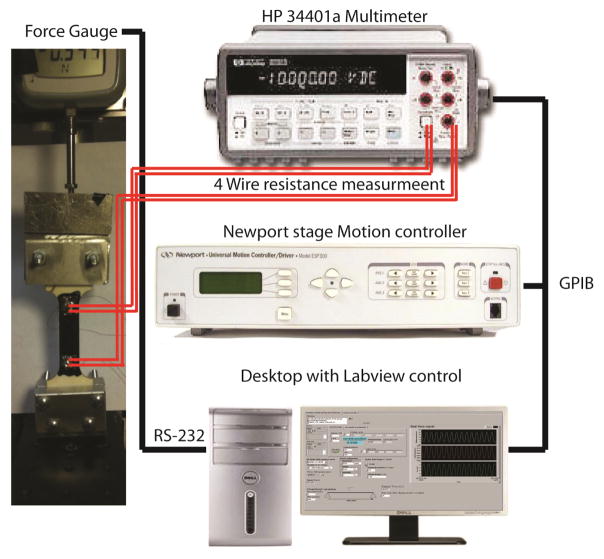
When studying the mechanical properties of polymer, generally one observes the stress strain curve in which axial component of strain is controlled. We use a force gauge (Shimpo FGV-1X, Japan) and multimeter (HP-34401A, USA) for load measurement. A Linear stage (Newport UTM50CC1HL, France) provides the displacement and the position of the displacement. The linear stage is controlled by a motion controller (Newport ESP 300, France). The system is controlled by a RS232 interface, GPIB card and a NI LabView program (National Instrument, USA) for the displacement control, force measurement, and resistance recording. Tensile force is applied to the polymer strain gage by stretching the polymer as shown in Figure 4. The polymer strain is affixed by a pair of specially designed clamps to the vertical stage. The force gage is connected to the top of the clamp and transmits force data to the Labview program via RS-232 Interface. The stage has a step resolution of 1μm, which ensures the accuracy of our experiment. 4wire resistance measurement is setup from the program to remove electrical noise from temperature change and contact resistance. The displacement and resistance data are acquired through GPIB interface from the linear stage controller and multimeter. Then the signal is processed in real time to calculate strain and stress by using a Labview program.
Figure 4.
Experiment configuration and four points resistance measurement set up for reliability test. The resistance is simultaneously measured and synchronized with the linear stage movement. Wires from conducting polymer are attached by copper tape to reduce the contact resistance. Signal from force gauge and multi-meter are transferred through Rs-232 and GPIB interface and processed by Labview program.
The displacement is set in a cyclic motion with the displacement amplitude of 4mm. 60 cycles are applied to each set of the experiment. The maximum corresponding strain created based on the above displacement is 17.7%. Furthermore, the strain rate is kept constant for all sets of experiment at 1 (4.42%/second).
Result
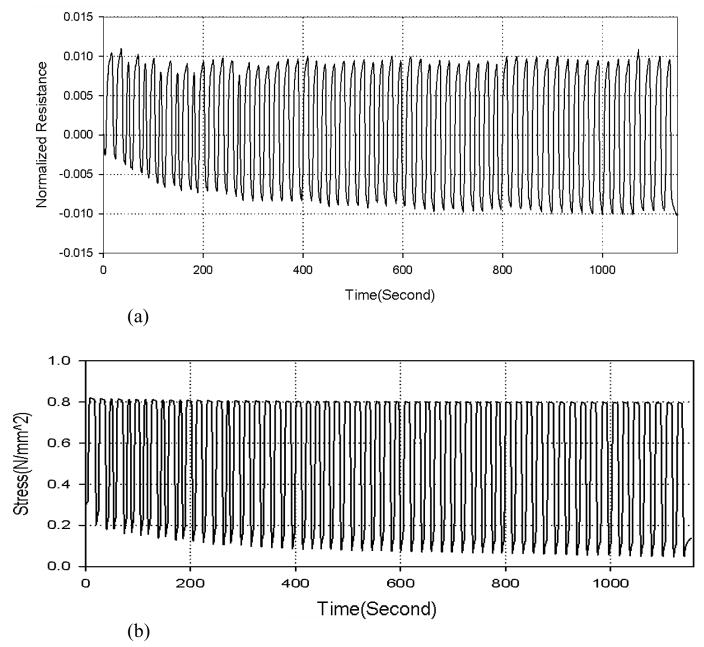
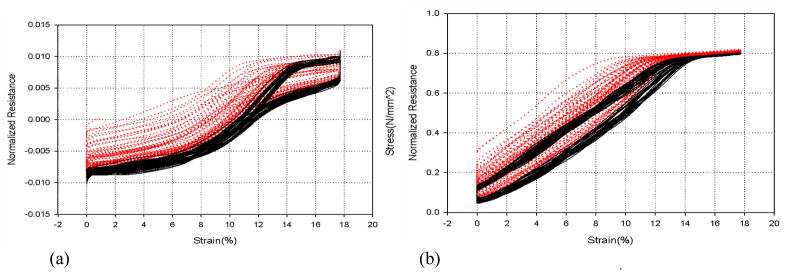
The PEDOT: PSS strain gauge underwent 60 cyclic loads. Figure 5 shows the result of the time history of the cyclic loads. We did not know how much we can actually apply to this specimen. So decision was made to go up to 18% strain based on our previous experiments. Based on the results, we observed a degradation of lower resistance value at the zero strain until it reached its 30th cycle. After the 30th cycle, the lower resistance values became stable. Figure 6 shows the stress-strain and resistance-strain curves of PEDOT: PSS generated from Figure 5. The result show that the load-off curves were drifting significantly before the 30th cycle. However it stabilized after the 30th cycle. Furthermore, after the 30th cycle, the resistance versus strain curve shows much less hysteresis if strain is less than 12% (Figure 5(a)). Regardless the drift, the results show that by having PEDOT: PSS bonded to the PU substrate, the sensor can be operated in a large strain region. In other words, one can use a substrate to grab the PEDOT: PSS to prevent the plastic deformation of the structure during large strain.
Figure 5.
17.7% strain for 60 cycles (a) The time histroy of resistance variation. The reference of the resistance decreases before 30th cycle and start to stablize after 30th cycle (b)The time histroy of stress variation, the reference stress also derease before 30th cycle and start to stablize after 30th cycle. The pattern of decreasing reference valvue at both curves shows that the resistance drift is actually caused by the mechanical peoperty change which exclude the possilbe source of the drifting resistance from temperature change and contact resistance change.
Figure 6.
(a) Resistance and strain curve of the PEDOT: PSS strain gauge before 30th cycle (Red dotted line) and after 30th cycle (Black solid line). The black curve shows typical polymer hysterysis. Furthermore, the results indicate that with the stablized hysterysis curve, the sensor can be feasibly operated withing this strain range. (b) Stress and strain curve also confirm that the mechanical structure starts to stablized after the 30 th cylcle without drifting of the reference stress.
Initially, we suspect the source of the drifting might be coming from temperature fluctuation or contact resistance. However we quickly realize both should have been compensated by the four wired measurement and temperature in the room never varies more than 0.2°C. Further inspection we identify the source of drifting resistance is likely due to the mechanical properties change due to excessive loading to the sample. This can be shown by the fact that the stress-strain curves and the normalized resistance change with strain follows the same drifting pattern. Both curves show the bottom limits of resistance and force gradually decrease and settle to a constant value after the 30th cycle (Figure 5). This shows that the resistance change is likely caused by a mechanical property change due to a permanent internal structure change by the repeated load that went beyond the linear region as shown by the stress saturation of the curves.
Another thing should be noted is that when strain is below 12% (Figure 6a), the hystersis appears to be less in the resistance-strain curve. If we take acloser look at the stress-strain curve shown in Figure 6(b), we notice that If strain reaches beyond the 12% (close to the yield point), the stress stop increasing and stayed at 0.8(N/mm2). This is plastic-like behavior of a material. However, below 12%, the stress-strain shows a typical hysterysis of polymer. This phonamenon explains why there is less hysterysis in the the resistacne-strain curve below 12%-the polymer is operated at linear region.
It is worth noting that the drift of normalized resistance change is drift toward negative values. A good explaination may come from the internal structure reoganization of the PEDOT:PSS. Based on the model presented in [2], PEDOT:PSS is a form between solid and liquid depending on relative humidity because PSS is water soluble. PSS will absorb water into the structure and make the interface of the PEDOT to become softer. Our cyclic load epsecially pushing it to the plastic region may act as an agitation to the structure to cause the PEDOT:PSS structure to reorganize itself everytime the strain goes back to the starting point. The strain may be considered as an agitation.
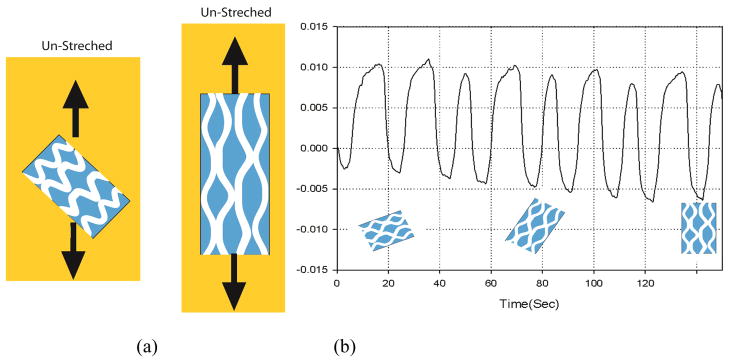
Furthermore, PEDOT:PSS may exist as a network of polymer chains. Upon stretching the PEDOT:PSS, the PEDOT rich area and PSS rich area tend to aligned along the direction of the applied force. Based on the anisotropic morphology model in reference [7], the conductivity in the force direction could be increased after the PEDOT:PSS has been stretched for several tims. The model can explain the decreasing resistance as shown in Figure 7. Another explanation is that after cyclic load is apllied to the PEDOT:PSS strucutre, the direction of the grain could be modfied due to the substrate plastic deformation. The resulting grain direction change may align itself to the direction of the force resulting in a resistance reduction. Other reports has also shown the increasing conductivity of PEDOT-PU composite after cyclic loads [4]
Figure 7.
The model for the drifting reference resistance based on the anisotropic conductivity model of PEDOT:PSS [7]. (a) The grain direction of PEDOT:PSS strucutre is not aligned to the direction of the force initialliy. After tensile force is applied, the grain direction is streched and aligned to tensile direction (b) the possilbe explianation of the decreasing resistance comes from the direction of PEDOT:PSS grain change which is caused by cyclic load.
Conclusion
In our research, a PEDOT:PSS strain gauge is created to measure the large strain and the reliability test is performed up to 17.7%. Compared to the strain tested on PEDOT: PSS in [2, 8], the strain applied to PEDOT: PSS coated on the PU polymer is larger than the regular PEDOT: PSS and the PEDOT:PSS with PU layer still shows good performance under cyclic load. The strain gauge can potentially be applied to large deformation measurments like human skin motion and input system of flexible OLED[1]. The strain gauge also shows a stablized hysterisis relationship between the applied strain and normalized resistance change which can be used to find the gauge factor. In general, the PEDOT:PSS strain gauge shows good preformance and can be used in detecting large strain, which a metal based strain gauge cannot compete with.
Acknowledgments
This work was supported in part by the NIH grant R01 EB007636
References
- 1.Muraki M, et al. Organic semiconductor based strain sensors for input system on flexible oleds. presented at the Micro Electro Mechanical Systems, 2008. MEMS 2008. IEEE 21st International Conference; Tucson, AZ, USA. January 13–17, 2008. [Google Scholar]
- 2.Lang U, et al. Mechanical characterization of PEDOT:PSS thin films. Synthetic Metals. 2009;159:473–479. [Google Scholar]
- 3.Tsutsui T, Fujita K. The Shift from "Hard" to "Soft" Electronics. Advanced Materials. 2002;14:949–952. [Google Scholar]
- 4.Steen HT, et al. Highly stretchable and conductive polymer material made from poly(3,4-ethylenedioxythiophene) and polyurethane elastomers. Advanced functional materials. 2007;17:3069–3073. [Google Scholar]
- 5.Ramona Mateiu ML, Hansen Thomas Steen, Boisen Anja, Geschke Oliver. Reliability of poly 3,4-ethylenedioxythiophene strain gauge. Microelectronic Engineering. 2007;84:1270–1273. [Google Scholar]
- 6.Udo Lang* PR, Dual Jurg. Towards fully polymeric MEMS: Fabrication and testing of PEDOT/PSS strain gauges. Microelectronic Engineering. 2008;85:1050–1053. [Google Scholar]
- 7.Nardes AM, et al. Microscopic Understanding of the Anisotropic Conductivity of PEDOT:PSS Thin Films. Advanced Materials. 2007;19:1196–1200. [Google Scholar]
- 8.Udo L, Jurg D. Mechanical properties of BAYTRON P. presented at the IEEE international conference on polymers and adhesives in microelectronics and photonics; Portland OR USA. 2004. [Google Scholar]


