Abstract
Purpose
To determine if fasting would affect the intestinal expression and in vivo functional activity of PEPT1 as determined after oral dosing of the dipeptide glycylsarcosine (GlySar).
Methods
Systemic exposure and tissue distribution studies were performed in wild-type and Pept1 knockout mice, under fed and fasted conditions, following both intravenous and oral doses of [14C]GlySar at 5 nmol/g body weight. Intestinal PEPT1 expression was evaluated by real-time PCR and immunoblot analyses.
Results
We found that expression of PEPT1 protein in the small intestine was increased ~2-fold in wild-type mice during fasted as compared to fed conditions. In agreement, systemic exposure and peak plasma concentrations of orally administered GlySar were 40 and 65% greater, respectively, in wild-type mice during fasted vs. fed state. No significant differences were observed between fed and fasted animals during PEPT1 ablation. Tissue distribution of GlySar was unchanged after oral dosing for all four treatment groups.
Conclusions
As little as 16 hr of fasting can cause significant upregulation of PEPT1 protein expression in the small intestine, which then translates into a significant increase in in vivo oral absorption of GlySar.
Keywords: fed-fasted state, glycylsarcosine, intestinal PEPT1, knockout mice, oral absorption
INTRODUCTION
Cloning of the proton-coupled oligopeptide transporter (POT) from rabbit, designated as PEPT1 (SLC15A1), provided the first molecular evidence for the functional activity of intestinal peptide transport (1). The protein contains 12 putative transmembrane domains with both the C- and N-termini localized inside the cell. The first four transmembrane regions from the amino terminus, and domains 7 to 9, are responsible for PEPT1's substrate affinity and unique features (2). PEPT1 is classified as a low-affinity, high-capacity transporter and demonstrates a broad specificity for substrates of different molecular size, polarity, charge and conformation (3, 4). It is expressed abundantly in all regions of the small intestine with little or no expression in the large intestine (5); it is also expressed at much lower levels in the kidney (6). In contrast, the POT member PEPT2 (SLC15A2) is classified as a high-affinity, low-capacity transporter and is highly expressed in the kidney (6) along with brain (7), lung and mammary gland (3, 4). Both PEPT1 and PEPT2 exert their effects at the luminal surface of intestinal and renal epithelia, respectively, where they absorb and reabsorb di/tripeptides, mimetics and peptide-like drugs. Two other POT members, PHT1 (SLC15A4) (8) and PHT2 (SLC15A3) (9) have also been identified in small intestine, but their expression and function have yet to be clearly elucidated. Regardless, they appear not to have relevance at the plasma membrane of enterocytes (5, 10).
It has been reported that PEPT1 is regulated by a number of factors including the alteration of proton-motive force, food intake, hormones, pathological state, some pharmacologic agents, and diurnal rhythm (3, 4). Given its importance in absorbing peptide-bound nitrogen from the diet and gastrointestinal secretions, as well as pharmacological agents, the role of nutritional status in PEPT1 regulation is of particular interest. For example, several studies have shown that various degrees of fasting (i.e., from 1-4 days) result in an upregulation of PEPT1 mRNA and protein in small intestine, along with functional activity (11-13). However, the functional activity of PEPT1 was evaluated using in vitro models of rat jejunal brush border membrane vesicles (11) and Ussing chambers lined with intestinal tissue sheets (12), in situ rat perfusion models using a closed loop method (12), and Caco-2 cell cultures (13). None of these studies investigated the effect of fasting/starvation on the oral absorption of a PEPT1 substrate under physiological in vivo conditions. In one study, the pharmacokinetics of an oral β-lactam antibiotic, ceftibuten, was evaluated in fed and 4-day fasted rats after oral and intravenous drug administration (14). Although its systemic exposure after oral dosing was significantly increased during fasting, the results were confounded by dispositional changes, as indicated by substantial reductions in the total clearance of ceftibuten in fasted rats after intravenous dosing.
Food may alter the systemic availability of drugs by a multitude of mechanisms that act on the drug's physicochemical properties and gastrointestinal environment (15, 16). Such mechanisms might include changes in drug solubility, permeability, and metabolism via delayed gastric emptying, stimulated bile and/or splanchnic blood flow, increased pH and fluid volume in the gut, and altered luminal drug concentrations. While the literature is quite extensive concerning drug, meal and formulation interactions, much less is known about how food (or fasting) affects intestinal transporters and transporter-mediated absorption. With this in mind, our primary objective was to determine if fasting would affect the intestinal expression and in vivo functional activity of PEPT1 as determined after oral dosing of the model dipeptide glycylsarcosine (GlySar). Our secondary objective was to examine if fasting affected the small intestinal transit times, and if histological differences were present in mouse small intestine as a function of diet or genotype.
MATERIALS AND METHODS
Materials
[14C]GlySar (106 mCi/mmol) was purchased from Amersham Biosciences (Chicago, IL) and [3H]dextran 70,000 (265 mCi/gm) from American Radiolabeled Chemicals (St. Louis, MO). Pept1 knockout mice were generated on a C57BL/6 mouse background as described previously (17). Unlabeled GlySar was obtained from Sigma-Aldrich (St. Louis, MO). Diet LD 101, obtained from TestDiet (Richmond, IN), arrived as a dry powder and was reconstituted according to the manufacturer's instructions. Hyamine hydroxide was obtained from ICN Pharmaceuticals (Costa Mesa, CA). All other chemicals were obtained from standard sources.
Fed-Fasted Study Design
All mouse studies adhered to the “Principles of Laboratory Animal Care” (NIH publication #85-23, revised in 1985), and were approved by the Institutional Animal Care and Use Committee of the University of Michigan, Ann Arbor. Wild-type and Pept1 knockout mice (gender- and weight-matched, 6 to 8 weeks of age) were used in the proposed studies under fed and fasted conditions. The mice were kept in a temperature-controlled environment, with 12-hr light and dark cycles, and received a standard diet of solid chow and water ad libitum (Unit for Laboratory Animal medicine, University of Michigan, Ann Arbor, MI). Four-days prior to conducting the fed-fasted experiments, solid chow was changed to the micro-stabilized rodent liquid diet mix - LD101 (18). For three of these days, all mice received this liquid diet. On the fourth day, one cohort of mice was maintained on diet LD 101 (i.e., fed group) while in another cohort the liquid diet was replaced with water at 5 pm (i.e., fasted group). Mouse experiments were then performed at 9 am the next day, representing a 16-hr fast for those mice on water.
Real-Time PCR Analysis
Following intra-peritoneal anesthesia with sodium pentobarbital (65 mg/kg body weight), the small intestine and colon of mice were opened longitudinally and the mucus layer was gently scraped from the duodenal, jejunal, ileal, and proximal and distal colonic segments using a glass slide. Total RNA was then isolated according to the manufacturer's protocol using TriZol reagent (Invitrogen, Carlsbad, CA). After genomic DNA was removed from the total RNA by DNAse I treatment (Ambion, Austin, TX), first strand cDNA was synthesized by reverse-transcriptase III (Invitrogen, Carlsbad, CA). PEPT1 and house-keeping gene 18s rRNA primers were designed with Primer Express 3.0 software (Applied Biosystems, Foster City, CA) and synthesized by Integrated DNA Technologies (Coralville, IA). The forward and reverse primers for PEPT1 were CTTGGAGCCACCACAATGG and ACAGAATTCATTGACCACGATGA, respectively; the forward and reverse primers for 18s rRNA were GGCGTCCCCCAACTTCTTA and GGGCATCACAGACCTGTTATTG, respectively. The thermal profile for real-time PCR was one cycle at 50°C × 2 min, one cycle at 95°C × 10 min, 40 cycles at 95°C × 15 sec, and 60°C × 1 min. Relative abundance of PEPT1 transcripts was calculated based on the Ct cycles and normalized for 18s rRNA.
Immunoblot Analysis
Total protein from the mucus layers of mouse small intestine and colon was resolved on 7.5% SDS-PAGE, transferred to a PVDF membrane, and blotted with specific polyclonal rabbit anti-mouse PEPT1 antisera (raised against the COOH- terminal region, KGIGKENPYSSLEPVSQTNM; Lampire Biological Laboratories, Pipersville, PA) (1:1000 dilution) (5, 17). After the membrane was washed three times with TBS-T, it was incubated with goat anti-rabbit IgG conjugated to horseradish peroxidase (Bio-Rad, Hercules, CA) (1:3000 dilution). To control for loading efficiency, β-actin from the same membrane was blotted with a mouse monoclonal antibody (Santa Cruz Biotechnology, Santa Cruz, CA) (1: 1000 dilution) and then incubated with goat anti-mouse IgG conjugated to horseradish peroxidase (Bio-Rad, Hercules, CA) (1:3000 dilution). The membrane-bound antibodies were detected with Immobilon Western Chemiluminescent Substrate (Millipore, Billerica, MA).
In Vivo Pharmacokinetic Studies
Following intra-peritoneal anesthesia with sodium pentobarbital (65 mg/kg body weight), mice were administered a bolus dose of [14C]GlySar (5 nmol/g body weight) by tail vein injection. Serial blood samples were then collected at 0.25, 1, 5, 15, 30, 60, 90 and 120 min after dosing. For oral studies, [14C]GlySar (5 nmol/g body weight) was administered to conscious mice and serial samples collected at 5, 15, 30, 45, 60, 90, 120, 240 and 360 min. After oral gavage, the mice were returned to their cages in between blood sampling where they had free access to water. For both routes of administration, blood samples (15 to 20 μl) were obtained via tail transections and the plasma harvested.
Tissue distribution studies were performed at the end of blood sampling for both the intravenous and oral experiments with [14C]GlySar, as described above. However, an intravenous bolus of [3H]dextran 70,000 (2 μCi/mouse) was administered 2 min prior to collecting the last blood sample so that tissue concentrations could be corrected for the extracellular space of GlySar. As demonstrated for albumin, 2 min was a suitable time for estimating intravascular volume (19). Once this blood sample was obtained mice were immediately decapitated and multiple tissues/organs were harvested (i.e., cerebral cortex, eye, lung, heart, liver, stomach, duodenum, jejunum, ileum, colon, spleen, kidney, and skeletal muscle). Tissue samples were blotted dry, weighted, and digested in 0.33 ml of 1 M hyamine hydroxide (a tissue solubilizer) at 37°C. A 20-μL aliquot of 33% H2O2 was added to each solubilized tissue followed by Ecolite (+) liquid scintillation cocktail (MP Biomedicals). Radioactivity in the tissue and plasma samples was detected by a dual-channel liquid scintillation counter (Beckman LS 3801; Beckman Coulter, Fullerton, CA). Corrected tissue concentrations of GlySar (nmol/g of wet weight) were calculated as Ctiss – DS • Cb where Ctiss is the uncorrected GlySar tissue concentration (nmol/g), DS is the dextran space (ml/g), and Cb is the concentration of GlySar in blood (nmol/ml).
Small Intestinal Transit
Mice were administered a meal of 10% activated charcoal in 5% gum arabic solution (Sigma, St. Louis, MO), by oral gavage, at a volume of 10 μl/g body weight. At 30 min, the animals were sacrificed by cervical dislocation after brief anesthesia. The stomach and small intestine were separated from the greater omentum and then removed. The distance traveled by the leading edge of the charcoal suspension and the total length of small intestine (i.e., from the pylorus to ileocecum) were measured, and the small intestinal transit (SIT) calculated as (20): SIT (%) = 100 × charcoal distance / small intestine length.
Histological Analysis
Swiss rolls were prepared from freshly obtained duodenal, jejunal, ileal and colonic mouse segments (21), fixed overnight in 10% formaldehyde at 4°C, and then transferred to 70% (v/v) ethanol. The samples were stained with hematoxylin and eosin by the Comprehensive Cancer Center and analyzed by the Pathology Cores for Animal Research at the University of Michigan.
Data Analysis
Pharmacokinetic parameters after both intravenous and oral dosing of [14C]GlySar were determined using a noncompartmental approach (WinNonlin, v5.2; PharSight, Mountain View, CA). Data were reported as mean ± SE. Statistical differences between two treatment groups were determined using a two-sample student's t-test. For multiple treatment groups, statistical differences were determined using a one-way analysis of variance and Tukey method. All statistical analyses were performed by Prism v5.0 (GraphPad Software, Inc., San Diego, CA). A p value ≤ 0.05 was considered statistically significant.
RESULTS
Effect of 16-Hr Fast on PEPT1 Expression in Intestines
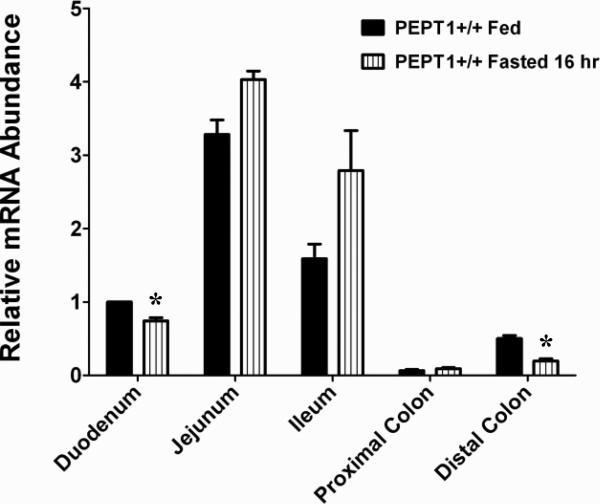
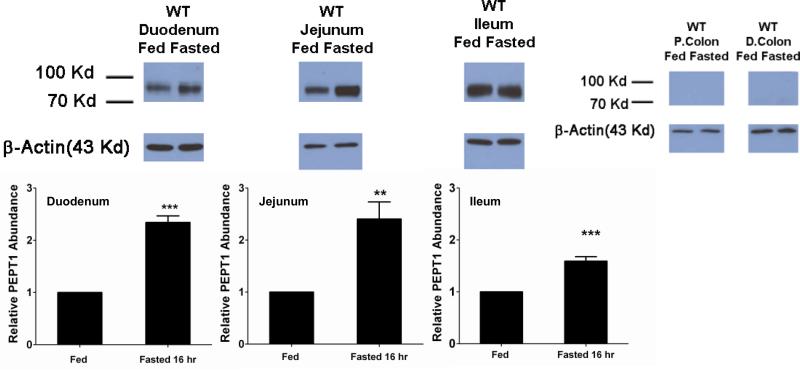
In wild-type mice, mRNA expression of PEPT1 was most abundant in the jejunum and ileum, then duodenum, with low level expression in the colon (Fig. 1). Fasting had little effect on PEPT1 mRNA in the intestines, with minor reductions being observed in the duodenum and distal colon. In contrast, protein expression of PEPT1 was increased more than 2-fold in the duodenum and jejunum and about 1.5-fold in the ileum of fasted mice (Fig. 2). Protein expression in proximal and distal colon was undetectable in both fed and fasted states.
Figure 1.
PEPT1 mRNA expression in small intestinal and colonic segments of wild-type (+/+) mice during fed and fasted conditions. mRNA expression in the duodenum of fed mice was considered the control group and was arbitrarily assigned a value of unity. mRNA expression in other treatment groups was scaled to the control value. Data are reported as mean ± SE (n=6). Statistical differences between fed and fasted conditions for each tissue segment were determined using a two-sample student's t-test; *p ≤ 0.05.
Figure 2.
PEPT1 protein expression in small intestinal and colonic segments of wild-type mice during fed and fasted conditions. For each tissue, protein expression in fed mice was considered the control group and was arbitrarily assigned a value of unity. Protein expression in fasted mice was scaled to the control value. Data are reported as mean ± SE (n=6). Statistical differences between fed and fasted conditions for each tissue segment were determined using a two-sample student's t-test; **p ≤ 0.01 and ***p ≤ 0.001. Relative protein expression levels in small intestinal and colonic segments have been reported previously (see reference 5, Fig 7).
Effect of 16-Hr Fast on Systemic Exposure and Tissue Distribution of GlySar after Intravenous Dosing
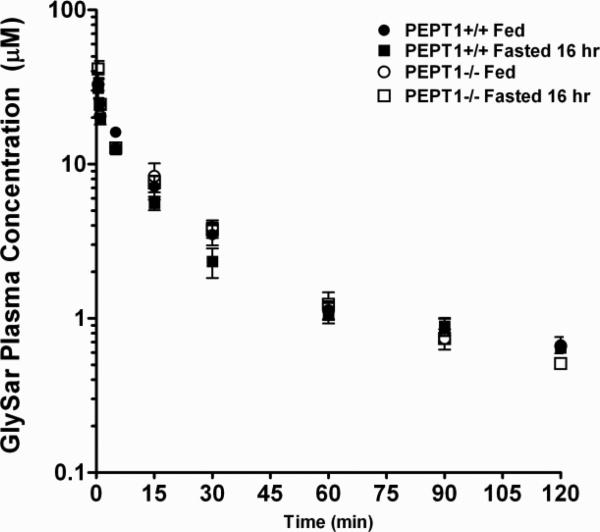
As shown in Fig. 3, the plasma concentration-time curves of intravenously administered GlySar were very similar in wild-type and Pept1 knockout mice under both fed and fasted conditions. Pharmacokinetic analysis of the curves showed that GlySar disposition was not different between the fed and fasted states in each genotype (Table I). Likewise, there was no difference between wild-type and Pept1 knockout mice under fed conditions. However, significant reductions were observed in the volume of distribution steady-state (Vdss), mean residence time (MRT), the terminal half-life (T1/2) of GlySar in Pept1 knockout mice under fasted conditions; clearance (CL) was unchanged in all treatment groups.
Figure 3.
Plasma concentration-time profiles of [14C]GlySar during fed and fasted conditions in wild-type (+/+) and Pept1 knockout (-/-) mice after 5 nmol/g intravenous bolus doses of dipeptide. Data are reported as mean ± SE (n=6).
Table I.
Pharmacokinetics of [14C]GlySar During Fed and Fasted Conditions in Wild-Type and Pept1 Knockout Mice after 5 nmol/g Intravenous Bolus Doses of Dipeptide
| Parameter | Wild-Type | Pept1 Knockout | ||
|---|---|---|---|---|
| Fed | 16-Hr Fast | Fed | 16-Hr Fast | |
| CL (μl/min) | 216 ± 19 | 253 ± 21 | 223 ± 13 | 221 ± 11 |
| Vdss (ml) | 8.6 ± 1.2 | 13.2 ± 2.0 D | 8.1 ± 0.8 | 6.9 ± 0.6 D |
| MRT (min) | 33.5 ± 1.8 | 39.1 ± 2.0 D | 32.9 ± 1.6 | 29.0 ± 1.6 D |
| T1/2 (min) | 44.6 ± 5.5 | 59.1 ± 6.3 D | 37.9 ± 2.6 | 34.1 ± 2.4 D |
Data are represented as mean ± SE (n = 6).
CL, total plasma clearance; Vdss, volume of distribution steady-state; MRT, mean residence time; T1/2 , terminal half-life.
One-way ANOVA and Tukey method of multiple comparisons were performed to test for differences among treatment groups: ARepresents significant differences between fed and fasted conditions in wild-type mice; Brepresents significant differences between fed and fasted conditions in Pept1 knockout mice; Crepresents significant differences between wild-type and Pept1 knockout mice in fed conditions; and Drepresents significant differences between wild-type and Pept1 knockout mice in fasted conditions.
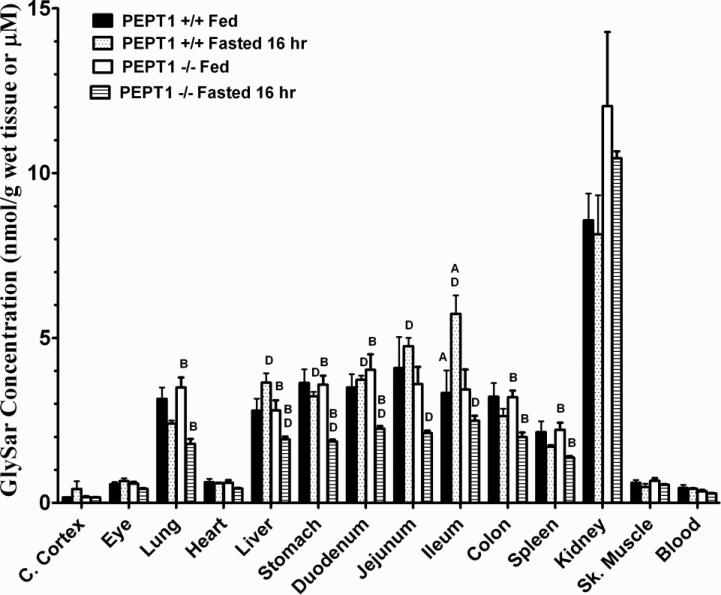
Significant differences in the tissue distribution of GlySar, two hours after intravenous dosing, were evident even though blood concentrations of dipeptide were not different as a function of genotype and diet (Fig. 4). These differences included a greater distribution of GlySar in the ileum of wild-type fasted vs. fed mice, a reduced distribution of GlySar in the lung, liver, stomach, duodenum, colon, and spleen of Pept1 knockout fasted vs. fed mice, and a reduced distribution of GlySar in the liver, stomach, duodenum, jejunum, and ileum of Pept1 knockout vs. wild-type animals during fasted conditions. The fact that kidney levels were not different among the four treatment groups probably explains the lack of significant differences in GlySar clearance since the renal route dictates how dipeptide is eliminated from the body.
Figure 4.
Tissue distribution of [14C]GlySar during fed and fasted conditions in wild-type (+/+) and Pept1 knockout (-/-) mice, 120 min after 5 nmol/g intravenous bolus doses of dipeptide. Data are reported as mean ± SE (n=6). One-way ANOVA and Tukey method of multiple comparisons were performed to test for differences among treatment groups: ARepresents significant differences between fed and fasted conditions in wild-type mice; Brepresents significant differences between fed and fasted conditions in Pept1 knockout mice; Crepresents significant differences between wild-type and Pept1 knockout mice in fed conditions; and Drepresents significant differences between wild-type and Pept1 knockout mice in fasted conditions.
Effect of 16-Hr Fast on Absorption and Tissue Distribution of GlySar after Oral Dosing
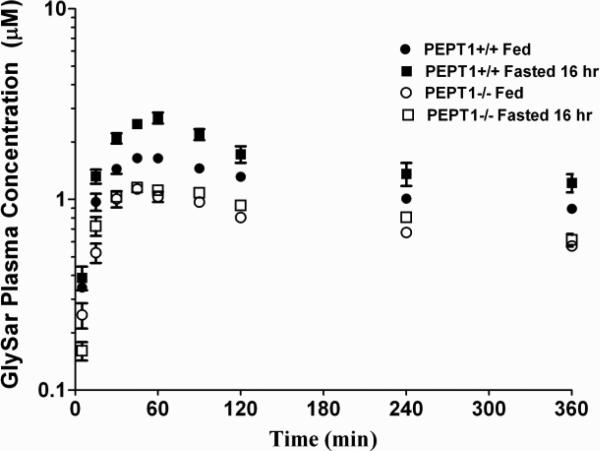
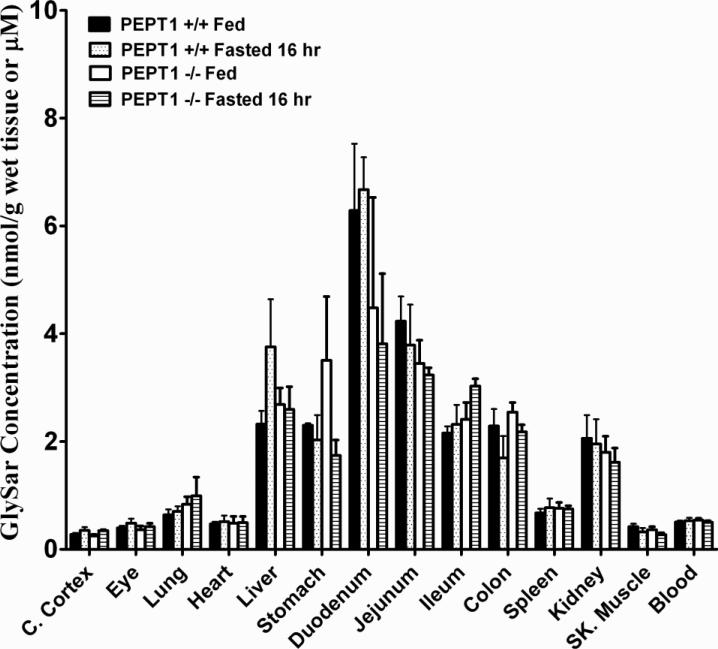
The plasma concentration-time profiles of GlySar in wild-type and Pept1 null mice, during fed and fasted conditions, are displayed in Fig. 5. A summary of the pharmacokinetic parameters for these four treatment groups is presented in Table II. Area under the plasma concentration-time curves (AUC0-360 min) of GlySar were significantly lower in Pept1 knockout mice than wild-type animals, regardless of diet, reflecting the reduced intestinal absorption of dipeptide during PEPT1 ablation. For the same reason, no difference was observed in the AUC0-360 min of GlySar in fed vs. fasted Pept1-deficient mice. However, in wild-type mice, fasted animals had a significantly greater AUC0-360 min where the increased intestinal absorption of GlySar reflected the upregulation of PEPT1 protein in all three regions of small intestine (see Fig. 2). The same trends and conclusions were true for peak plasma concentrations (Cmax) of GlySar. In contrast, no differences were observed between the four treatment groups in the time to reach peak plasma concentrations (Tmax) or in the terminal half-life (T1/2) of dipeptide. Likewise, the tissue distribution of GlySar was unchanged when sampled six hr after oral dosing (Fig. 6).
Figure 5.
Plasma concentration-time profiles of [14C]GlySar during fed and fasted conditions in wild-type (+/+) and Pept1 knockout (-/-) mice after 5 nmol/g oral doses of dipeptide. Data are reported as mean ± SE (n=6).
Table II.
Pharmacokinetics of [14C]GlySar During Fed and Fasted Conditions in Wild-Type and Pept1 Knockout Mice after 5 nmol/g Oral Doses of Dipeptide
| Parameter | Wild-Type | Pept1 Knockout | ||
|---|---|---|---|---|
| Fed | 16-Hr Fast | Fed | 16-Hr Fast | |
| AUC0-360 min (μM•min) | 415 ± 11 A,C | 581 ± 46 A,D | 268 ± 8 C | 302 ± 13 D |
| Cmax (μM) | 1.67 ± 0.03 A,C | 2.80 ± 0.10 A,D | 1.15 ± 0.07 C | 1.21 ± 0.03 D |
| Tmax (min) | 47.5 ± 4.6 | 52.5 ± 3.4 | 45.0 ± 3.9 | 55.0 ± 7.4 |
| T1/2 (min) | 350 ± 16 | 410 ± 47 | 374 ± 31 | 401 ± 47 |
Data are represented as mean ± SE (n = 6).
AUC0-360 min, area under the plasma concentration-time curve from 0 to 360 min; Cmax, peak plasma concentration; Tmax, time to reach peak plasma concentration; T1/2, terminal half-life.
One-way ANOVA and Tukey method of multiple comparisons were performed to test for differences among treatment groups: ARepresents significant differences between fed and fasted conditions in wild-type mice; Brepresents significant differences between fed and fasted conditions in Pept1 knockout mice; Crepresents significant differences between wild-type and Pept1 knockout mice in fed conditions; and Drepresents significant differences between wild-type and Pept1 knockout mice in fasted conditions.
Figure 6.
Tissue distribution of [14C]GlySar during fed and fasted conditions in wild-type (+/+) and Pept1 knockout (-/-) mice, 360 min after 5 nmol/g oral doses of dipeptide. Data are reported as mean ± SE (n=6). No statistical differences were observed using one-way ANOVA.
Effect of 16-Hr Fast on Small Intestinal Transit Time
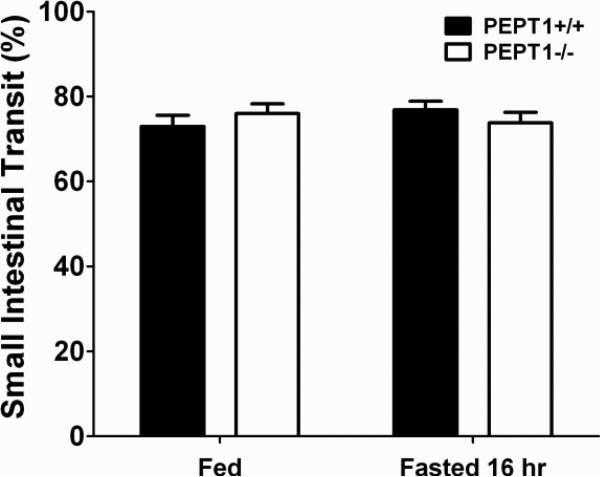
A charcoal meal was administered orally as a method to compare the small intestinal transit times of wild-type and Pept1 knockout mice in the fed-fasted state. As observed in Fig. 7, the leading edge of the charcoal suspension advanced to about 75% of small intestine 30 min after the meal was given. The 75% estimate for SIT was independent of genotype as well as diet.
Figure 7.
Small intestinal transit, as determined at 30 min by a charcoal meal, during fed and fasted conditions in wild-type (+/+) and Pept1 knockout (-/-) mice. Data are reported as mean ± SE (n=6). No statistical differences were observed using one-way ANOVA.
Histological Examination of Intestines
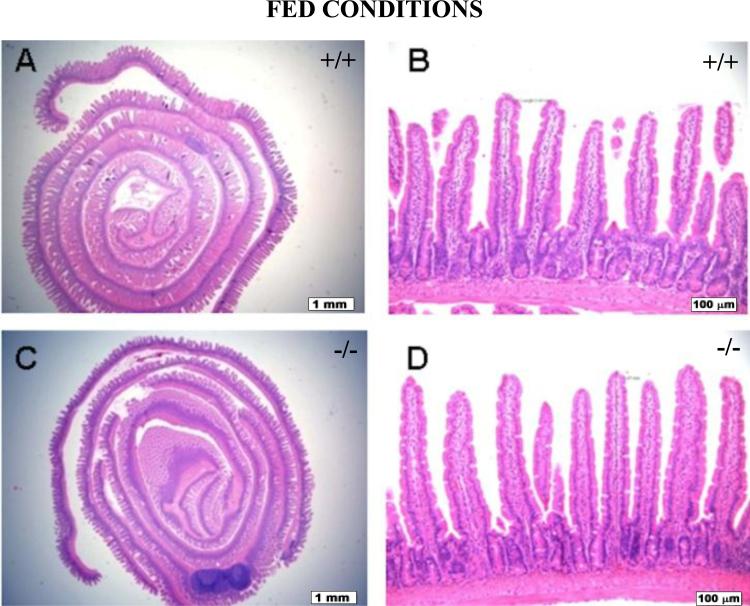
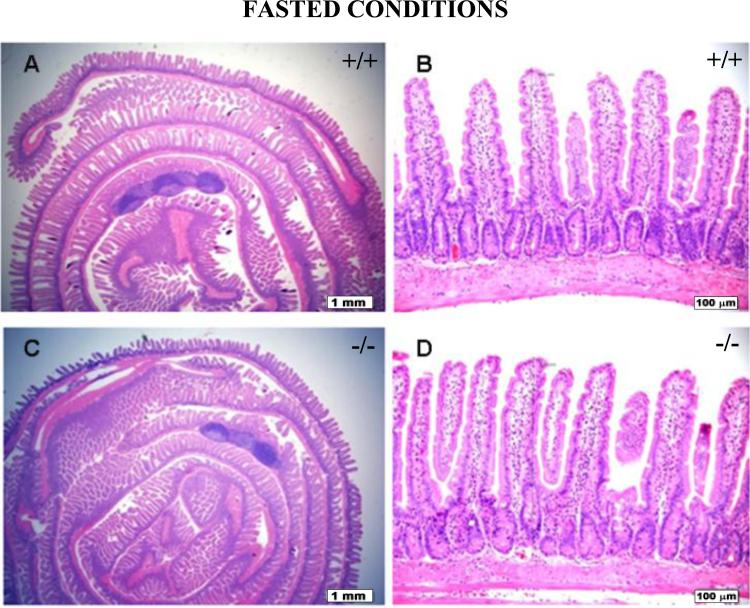
Small intestinal and colonic segments of wild-type and Pept1 knockout mice, under fed and fasted conditions, were evaluated for mucosal height and composition, lamina propria lymphoplasmacytic inflammatory cells, degree of mitotic activity, submucosal and muscular thickness, appearance, and overall morphology (n=6). No significant histological or morphological differences were observed in the animals as a function of genotype or diet. Representative examples of jejunum histology are shown for wild-type and Pept1 knockout null mice during the fed (Fig. 8) and fasted (Fig. 9) states.
Figure 8.
Histology of the jejunum during fed conditions in wild-type (+/+) mice (a, b) and Pept1 knockout (-/-) mice (c, d). Sections were stained with hematoxylin and eosin, and examined by light microscopy. In (a) and (c), the bar = 1 mm; in (b) and (d), the bar = 100 μm.
Figure 9.
Histology of the jejunum during fasted conditions in wild-type (+/+) mice (a, b) and Pept1 knockout (-/-) mice (c, d). Sections were stained with hematoxylin and eosin, and examined by light microscopy. In (a) and (c), the bar = 1 mm; in (b) and (d), the bar = 100 μm.
DISCUSSION
The transcription factors Sp1 (22) and Cdx2 (23) are functionally and physically associated with one another, thereby, resulting in the basal transcriptional regulation and intestine-specific expression of human PEPT1. Moreover, the peroxisome proliferator-activated receptor PPAR plays a critical role in fasting-induced intestinal PEPT1 expression (13). These studies and others (3, 4) have provided a molecular understanding of PEPT1 regulation. However, there are no studies that demonstrate unambiguously the upregulation of intestinal PEPT1 expression during fasted conditions and a concomitant increase in the in vivo intestinal absorption of a PEPT1 substrate following oral dosing.
In the present study, wild-type mice were compared to Pept1 knockout animals after oral and intravenous administrations of GlySar in both the fed and fasted state. We found that: 1) expression of PEPT1 protein in small intestine was increased about 2-fold in wild-type mice during fasted vs. fed conditions, 2) systemic exposure and peak plasma concentrations of orally administered GlySar were 40 and 65% greater, respectively, in wild-type mice during fasted vs. fed conditions; no significant differences were observed between fed and fasted animals during PEPT1 ablation; 3) GlySar clearance was unaffected by genotype or the fed-fasted state; 4) tissue distribution of GlySar was unchanged after oral dosing for all four treatment groups; and 5) no differences were observed in small intestinal transit time or histology for all treatment groups.
Most studies investigating the effect of fasting on PEPT1 expression and functional activity have been performed over a 2- to 4-day period in rats (12-14). Because mice have smaller body weights than rats, and because drug absorption studies are usually performed in mammals (especially humans) after an overnight fast, we chose 16 hr as the fasting time in our study design. Our compound of interest, GlySar, was dissolved in isotonic saline solution for both intravenous and oral administrations. To minimize the potential for solid food effects during the oral absorption of GlySar (e.g., changes in gastric emptying and intestinal motility), regular chow was changed to a liquid diet during the fed studies. The liquid diet (LD 101) provides the same proportion of lipid, carbohydrate, and protein as solid rat chow, and is formulated for rodents where solid diets are not appropriate. As reported previously, similar weight gains were observed in mice fed this liquid formulation compared to standard solid chow (18, 24). It remains to be elucidated if solid food, as compared to a liquid diet, might alter PEPT1 intestinal expression and activity.
Differences in systemic exposure (i.e., AUC=F•Dose/CL) after the oral dosing of GlySar could be due to differences in intestinal absorption (F) and/or total clearance (CL). To test if diet might cause dispositional changes in clearance, an intravenous dose of GlySar was administered to wild-type and Pept1 null mice during fed and fasted conditions. As demonstrated in Table I and Fig. 3, the clearance of GlySar was unchanged as a function of diet as well as genotype, thereby, ruling out this possible explanation for the increased AUC of orally administered GlySar in fasted vs. fed wild-type mice. This finding was consistent with an earlier study in which PEPT1 protein levels in kidney were unaltered between fed and 4-day fasted rats (14). Moreover, it was reported that PEPT1 accounted for only 16% of the renal reabsorption of GlySar when studied in wild-type and Pept2 null mice (25). That study and others (26, 27) demonstrated conclusively that renal PEPT1 was a minor mechanism in the elimination of GlySar and other peptide/mimetic substrates from the body.
Aside from regulating transporter expression, food can change the absorption characteristics of a drug by a variety of mechanisms including the alteration of gastrointestinal residence time. To investigate this possibility as well as the potential for genotypic differences, a charcoal suspension was given orally to mice and the small intestinal transit times were evaluated over 30 min. We found that the charcoal had advanced to 75% of the small intestinal length in wild-type and Pept1 knockout mice, and that the intestinal transit times were not influenced by fed-fasted conditions (Fig. 7). Moreover, no histological or morphological differences were observed in small intestinal and colonic segments of the mice, regardless of genotype or dietary treatment (Figs. 8 and 9). Finally, other POT family members (i.e., PEPT2, PHT1 and PHT2) were not upregulated in the small intestine, colon, or kidney during PEPT1 ablation (17) and, as a result, were not responsible for any differences between treatment groups in the systemic exposure of GlySar.
No differences were observed between wild-type and Pept1 knockout mice, regardless of dietary state, in the tissue distribution of GlySar after oral dosing (Fig. 6). This finding was particularly surprising in small intestine given that PEPT1 protein is abundantly expressed in the duodenum, jejunum and ileum of mice (5). However, whole gut transit times of about 200 min have been reported in mice (28) and, as a result, the 6-hr tissue samples were probably more reflective of systemic distribution than absorption effects since. Thus, a sampling time around the Tmax value would have been more suited for evaluating the influence of PEPT1 on intestinal GlySar distribution.
In fed-state mice, no differences were observed between wild-type and Pept1 knockout mice in the tissue distribution of GlySar 120 min after intravenous bolus dosing (Fig. 4). In contrast, fasted-state Pept1 knockout mice showed reduced concentrations of GlySar in the liver, stomach, duodenum, jejunum and ileum as compared to wild-type animals. The latter result is more difficult to reconcile since PEPT1 is expressed solely on the lumen-facing apical membrane of enterocytes and would not be expected to affect the intestinal distribution of GlySar following intravenous injection. However, GlySar accumulation will depend in general upon the rate at which the dipeptide enters, leaves, and is retained by the tissue. Little is known about the precise localization and function of peptide/histidine transporters PHT1 and PHT2 in the intracellular milieu of small intestine (29, 30). Even less is known about how peptides/mimetics efflux from enterocytes into blood, although functional studies suggest a facilitative transporter is operative at the basolateral membrane (31). Although speculative, up-regulation of peptide/histidine transporters in the first case and/or of facilitative basolateral transporters in the second case, during fasted-state conditions, might serve to lower the intestinal accumulation of GlySar in Pept1 knockout mice. An up-regulation of PEPT1, during fasting, might also lower the accumulation of GlySar in liver since functional studies in rat have supported its presence in lysosomes (32) while immunohistochemical studies have located this POT protein to the apical membrane of mouse bile duct epithelial cells (33). Obviously, such regulatory changes would have to be demonstrated experimentally.
Using everted jejunal rings in wild-type and Pept1 null mice, PEPT1 was previously reported by our laboratory to account for about 80% of the intestinal uptake of GlySar (10). In contrast, the magnitude of change in this study was more modest, with Pept1 knockout mice having systemic exposures of GlySar that were 65% and 52% of wild-type animals, respectively, during fed and fasted states. This finding highlights the fact that in vitro studies, although valid mechanistically, may not represent what happens under physiologic in vivo conditions. Although speculative, we believe that GlySar takes advantage of the small intestine's residual length and residence times so that other mechanisms become more important (e.g., passive permeability, paracellular flux) in the absence of PEPT1 (paper in review).
In concluding, drug-diet interactions are very complex with a variety of possible outcomes. Nevertheless, our studies clearly demonstrate that as little as 16 hr of fasting can cause a significant upregulation of PEPT1 protein expression in the small intestine which then translates into a significant increase in the in vivo oral absorption of GlySar. Future studies will be directed at the oral absorption of pharmacologically active PEPT1 substrates (e.g., cefadroxil and valacyclovir) under various fed-fasted conditions.
ACKNOWLEDGMENTS & DISCLOSURES
This work was supported by the National Institutes of Health National Institute of General Medical Sciences [Grant R01-GM035498] (to D.E.S.). We gratefully acknowledge Ingred L. Bergin for her histological evaluation of the intestines.
REFERENCES
- 1.Fei YJ, Kanai Y, Nussberger S, Ganapathy V, Leibach FH, Romero MF, Singh SK, Boron WF, Hediger MA. Expression cloning of a mammalian proton-coupled oligopeptide transporter. Nature. 1994;368:563–566. doi: 10.1038/368563a0. [DOI] [PubMed] [Google Scholar]
- 2.Daniel H. Molecular and integrative physiology of intestinal peptide transport. Annu Rev Physiol. 2004;66:361–384. doi: 10.1146/annurev.physiol.66.032102.144149. [DOI] [PubMed] [Google Scholar]
- 3.Rubio-Aliaga I, Daniel H. Peptide transporters and their roles in physiological processes and drug disposition. Xenobiotica. 2008;38:1022–1042. doi: 10.1080/00498250701875254. [DOI] [PubMed] [Google Scholar]
- 4.Brandsch M, Knütter I, Bosse-Doenecke E. Pharmaceutical and pharmacological importance of peptide transporters. J Pharm Pharmacol. 2008;60:543–585. doi: 10.1211/jpp.60.5.0002. [DOI] [PubMed] [Google Scholar]
- 5.Jappar D, Wu SP, Hu Y, Smith DE. Significance and regional dependency of peptide transporter (PEPT) 1 in the intestinal permeability of glycylsarcosine: in situ single-pass perfusion studies in wild-type and Pept1 knockout mice. Drug Metab Dispos. 2010;38:1740–1746. doi: 10.1124/dmd.110.034025. [DOI] [PMC free article] [PubMed] [Google Scholar]
- 6.Shen H, Smith DE, Yang T, Huang YG, Schnermann JB, Brosius FC., 3rd Localization of PEPT1 and PEPT2 proton-coupled oligopeptide transporter mRNA and protein in rat kidney. Am J Physiol. 1999;276:F658–665. doi: 10.1152/ajprenal.1999.276.5.F658. [DOI] [PubMed] [Google Scholar]
- 7.Shen H, Smith DE, Keep RF, Brosius FC., 3rd Immunolocalization of the proton-coupled oligopeptide transporter PEPT2 in developing rat brain. Mol Pharm. 2004;1:248–256. doi: 10.1021/mp049944b. [DOI] [PubMed] [Google Scholar]
- 8.Yamashita T, Shimada S, Guo W, Sato K, Kohmura E, Hayakawa T, Takagi T, Tohyama M. Cloning and functional expression of a brain peptide/histidine transporter. J Biol Chem. 1997;272:10205–10211. doi: 10.1074/jbc.272.15.10205. [DOI] [PubMed] [Google Scholar]
- 9.Sakata K, Yamashita T, Maeda M, Moriyama Y, Shimada S, Tohyama M. Cloning of a lymphatic peptide/histidine transporter. Biochem J. 2001;356:53–60. doi: 10.1042/0264-6021:3560053. [DOI] [PMC free article] [PubMed] [Google Scholar]
- 10.Ma K, Hu Y, Smith DE. Peptide transporter 1 is responsible for intestinal uptake of the dipeptide glycylsarcosine: studies in everted jejunal rings from wild-type and Pept1 null mice. J Pharm Sci. 2011;100:767–774. doi: 10.1002/jps.22277. [DOI] [PMC free article] [PubMed] [Google Scholar]
- 11.Thamotharan M, Bawani SZ, Zhou X, Adibi SA. Functional and molecular expression of intestinal oligopeptide transporter (Pept-1) after a brief fast. Metabolism. 1999;48:681–684. doi: 10.1016/s0026-0495(99)90164-6. [DOI] [PubMed] [Google Scholar]
- 12.Naruhashi K, Sai Y, Tamai I, Suzuki N, Tsuji A. PEPT1 mRNA expression is induced by starvation and its level correlates with absorptive transport of cefadroxil longitudinally in the rat intestine. Pharm Res. 2002;19:1417–1423. doi: 10.1023/a:1020436028194. [DOI] [PubMed] [Google Scholar]
- 13.Shimakura J, Terada T, Saito H, Katsura T, Inui K. Induction of intestinal peptide transporter 1 expression during fasting is mediated via peroxisome proliferator-activated receptor alpha. Am J Physiol Gastrointest Liver Physiol. 2006;291:G851–856. doi: 10.1152/ajpgi.00171.2006. [DOI] [PubMed] [Google Scholar]
- 14.Pan X, Terada T, Okuda M, Inui K. Altered diurnal rhythm of intestinal peptide transporter by fasting and its effects on the pharmacokinetics of ceftibuten. J Pharmacol Exp Ther. 2003;307:626–632. doi: 10.1124/jpet.103.055939. [DOI] [PubMed] [Google Scholar]
- 15.Custodio JM, Wu CY, Benet LZ. Predicting drug disposition, absorption/elimination/transporter interplay and the role of food on drug absorption. Adv Drug Deliv Rev. 2008;60:717–733. doi: 10.1016/j.addr.2007.08.043. [DOI] [PMC free article] [PubMed] [Google Scholar]
- 16.Harris RZ, Jang GR, Tsunoda S. Dietary effects on drug metabolism and transport. Clin Pharmacokinet. 2003;42:1071–1088. doi: 10.2165/00003088-200342130-00001. [DOI] [PubMed] [Google Scholar]
- 17.Hu Y, Smith DE, Ma K, Jappar D, Thomas W, Hillgren KM. Targeted Disruption of Peptide Transporter Pept1 Gene in Mice Significantly Reduces Dipeptide Absorption in Intestine. Mol Pharm. 2008;5:1122–1130. doi: 10.1021/mp8001655. [DOI] [PMC free article] [PubMed] [Google Scholar]
- 18.Helmrath MA, Shin CE, Fox JW, Erwin CR, Warner BW. Adaptation after small bowel resection is attenuated by sialoadenectomy: the role for endogenous epidermal growth factor. Surgery. 1998;124:848–854. [PubMed] [Google Scholar]
- 19.Guttierrez EG, Banks WA, Kastin AJ. Murine tumor necrosis factor alpha is transported from blood to brain in the mouse. J Neuroimmunol. 1993;47:169–176. doi: 10.1016/0165-5728(93)90027-v. [DOI] [PubMed] [Google Scholar]
- 20.Matwyshyn GA, Bhalla S, Gulati A. Endothelin ETA receptor blockade potentiates morphine analgesia but does not affect gastrointestinal transit in mice. Eur J Pharmacol. 2006;543:48–53. doi: 10.1016/j.ejphar.2006.05.032. [DOI] [PubMed] [Google Scholar]
- 21.Freeman TC, Bentsen BS, Thwaites DT, Simmons NL. H+/Di-tripeptide transporter (PepT1) expression in the rabbit intestine. Pflugers Arch- Eur J Physiol. 1995;430:394–400. doi: 10.1007/BF00373915. [DOI] [PubMed] [Google Scholar]
- 22.Shimakura J, Terada T, Katsura T, Inui K. Characterization of the human peptide transporter PEPT1 promoter: Sp1 functions as a basal transcriptional regulator of human PEPT1. Am J Physiol Gastrointest Liver Physiol. 2005;289:G471–477. doi: 10.1152/ajpgi.00025.2005. [DOI] [PubMed] [Google Scholar]
- 23.Shimakura J, Terada T, Shimada Y, Katsura T, Inui K. The transcription factor Cdx2 regulates the intestine-specific expression of human peptide transporter 1 through functional interaction with Sp1. Biochem Pharmacol. 2006;71:1581–1588. doi: 10.1016/j.bcp.2006.03.001. [DOI] [PubMed] [Google Scholar]
- 24.Helmrath MA, VanderKolk WE, Can G, Erwin CR, Warner BW. Intestinal adaptation following massive small bowel resection in the mouse. J Am Coll Surg. 1996;183:441–449. [PubMed] [Google Scholar]
- 25.Ocheltree SM, Shen H, Hu Y, Keep RF, Smith DE. Role and relevance of peptide transporter 2 (PEPT2) in the kidney and choroid plexus: in vivo studies with glycylsarcosine in wild-type and PEPT2 knockout mice. J Pharmacol Exp Ther. 2005;315:240–247. doi: 10.1124/jpet.105.089359. [DOI] [PubMed] [Google Scholar]
- 26.Shen H, Ocheltree SM, Hu Y, Keep RF, Smith DE. Impact of genetic knockout of PEPT2 on cefadroxil pharmacokinetics, renal tubular reabsorption, and brain penetration in mice. Drug Metab Dispos. 2007;35:1209–1216. doi: 10.1124/dmd.107.015263. [DOI] [PubMed] [Google Scholar]
- 27.Kamal MA, Jiang H, Hu Y, Keep RF, Smith DE. Influence of genetic knockout of Pept2 on the in vivo disposition of endogenous and exogenous carnosine in wild-type and Pept2 null mice. Am J Physiol Regul Integr Comp Physiol. 2009;296:R986–991. doi: 10.1152/ajpregu.90744.2008. [DOI] [PMC free article] [PubMed] [Google Scholar]
- 28.Nagakura Y, Naitoh Y, Kamato T, Yamano M, Miyata K. Compounds possessing 5-HT3 receptor antagonistic activity inhibit intestinal propulsion in mice. Eur J Pharmacol. 1996;311:67–72. doi: 10.1016/0014-2999(96)00403-7. [DOI] [PubMed] [Google Scholar]
- 29.Herrera-Ruiz D, Wang Q, Gudmundsson OS, Cook TJ, Smith RL, Faria TN, Knipp GT. Spatial expression patterns of peptide transporters in the human and rat gastrointestinal tracts, Caco-2 in vitro cell culture model, and multiple human tissues. AAPS PharmSci. 2001;3:E9. doi: 10.1208/ps030109. [DOI] [PMC free article] [PubMed] [Google Scholar]
- 30.Bhardwaj RK, Herrera-Ruiz D, Eltoukhy N, Saad M, Knipp GT. The functional evaluation of human peptide/histidine transporter 1 (hPHT1) in transiently transfected COS-7 cells. Eur J Pharm Sci. 2006;27:533–542. doi: 10.1016/j.ejps.2005.09.014. [DOI] [PubMed] [Google Scholar]
- 31.Terada T, Inui K. Peptide transporters: structure, function, regulation and application for drug delivery. Curr Drug Metab. 2004;5:85–94. doi: 10.2174/1389200043489153. [DOI] [PubMed] [Google Scholar]
- 32.Thamotharan M, Lombardo YB, Bawani SZ, Adibi SA. An active mechanism for completion of the final stage of protein degradation in the liver, lysosomal transport of dipeptides. J Biol Chem. 1997;272:11786–11790. doi: 10.1074/jbc.272.18.11786. [DOI] [PubMed] [Google Scholar]
- 33.Knutter I, Rubio-Aliaga I, Boll M, Hause G, Daniel H, Neubert K, Brandsch M. H+-peptide cotransport in the human bile duct epithelium cell line SK-ChA-1. Am J Physiol Gastrointest Liver Physiol. 2002;283:G222–229. doi: 10.1152/ajpgi.00534.2001. [DOI] [PubMed] [Google Scholar]


