

Abstract
Arp2/3 complex initiates the growth of branched actin-filament networks by inducing actin polymerization from the sides of pre-existing filaments. Nucleation promoting factors (NPFs) are essential for the branching reaction through interactions with the Arp2/3 complex prior to branch formation. The modes by which NPFs bind Arp2/3 complex and associated conformational changes have remained elusive. Here, we used electron microscopy to determine three-dimensional structures at ∼2 nm resolution of Arp2/3 complex with three different bound NPFs: N-WASp, Scar-VCA and cortactin. All of these structures adopt a conformation with the two actin-related proteins in an actin-filament-like dimer and the NPF bound to the pointed end. Distance constraints derived by fluorescence resonance energy transfer independently verified the NPF location. Furthermore, all bound NPFs partially occlude the actin-filament binding site, suggesting that additional local structural rearrangements are required in the pathway of Arp2/3 complex activation to allow branch formation.
Keywords: actin cytoskeleton, cell motility, docking, electron microscopy, image analysis
Introduction
Arp2/3 complex plays a central role in generating branched actin-filament networks at the leading edge of motile cells (Pollard and Borisy, 2003). This evolutionarily conserved 220 kDa complex consists of seven subunits that include two actin-related proteins (Arps), Arp2 and Arp3, and five additional subunits named ARPC1 to ARPC5. In the presence of ATP, nucleation promoting factors (NPFs) and pre-existing actin filaments, the complex initiates new filaments that grow as branches at an angle of 78° from existing filaments (Mullins et al, 1998; Blanchoin et al, 2000). Crystal structures of inactive Arp2/3 complex (Robinson et al, 2001; Nolen et al, 2004; Nolen and Pollard, 2007) provide an atomic scale view of the subunit organization. ARPC1, ARPC2, ARPC4 and ARPC5 form a scaffold that supports Arp2 and Arp3. Subdomains 1 and 2 of Arp2 are largely disordered in all crystal structures except one stabilized by chemical cross-linking (Nolen and Pollard, 2007). The arrangement of Arp2 and Arp3 in this inactive conformation does not support the growth of a daughter filament. In the branch junction, Arp2/3 complex is bound to the side of a pre-existing (mother) filament, and Arp2 and Arp3 form the first two subunits of the new (daughter) filament (Rouiller et al, 2008). In this active conformation, all of the subunits of Arp2/3 complex, including the pointed ends of both Arps, contact the mother filament.
Interactions with NPFs, actin monomers and actin filaments are all required for Arp2/3 complex to initiate a branch (Achard et al, 2010), but the structural pathway is not firmly established. The best-characterized NPFs, the C-terminal VCA (for Verprolin homology, Central, Acidic) regions of Wiskott–Aldrich syndrome protein (WASp), neuronal WASp (N-WASp) and Scar/WAVE, bind both Arp2/3 complex and actin monomers. Biochemical studies and crystal structures showed that V regions (also called WH2 domains) bind in the barbed-end groove of actin monomers (Chereau et al, 2005). C regions were shown to contribute to binding of VCA to both actin and Arp2/3 complex (Marchand et al, 2001; Kelly et al, 2006) and A regions bind Arp2/3 complex but not actin (Marchand et al, 2001). Models based on small angle X-ray solution scattering experiments (Boczkowska et al, 2008) postulated that Arp2 is the main binding site for the C region, but the absence of Arp2 does not reduce the affinity of NPFs for fission yeast Arp2/3 complex (Nolen and Pollard, 2008). Similarly, the location of the A binding region remains unsettled (Pan et al, 2004; Kreishman-Deitrick et al, 2005). Electron microscopy and spectroscopic measurements showed that NPF binding changes the conformation of Arp2/3 complex (Goley et al, 2004; Martin et al, 2005; Rodal et al, 2005), but the nature of these conformational changes remains unclear. Defining the nature of these conformational changes and determining the sites of NPF interactions with Arp2/3 complex are essential for understanding the pathway of Arp2/3 complex activation leading to branch formation.
We used electron microscopy and single-particle analysis to generate three-dimensional (3D) reconstructions of Acanthamoeba and budding-yeast Arp2/3 complex in the presence of three different NPFs at ∼2 nm resolution, including cortactin (Weed et al, 2000) and activators from the WASp family (Machesky et al, 1999; Winter et al, 1999). Modular statistics-based fitting (Volkmann and Hanein, 1999, 2003) of Arp2/3 complex crystal structures was used for quantitative characterization of conformational differences between these reconstructions (Volkmann, 2009) and to localize the bound NPFs. Distance constraints from fluorescence resonance energy transfer (FRET) analysis allowed us to independently locate the N-terminus of the C region and the C-terminus of the A region. In addition, the N-terminus of the V region was localized through electron microscopy of labelled VCA. With NPFs bound, Arp2 and Arp3 adopt a filament-like heterodimer arrangement but with features that are incompatible with nucleation: First, the bound NPFs localize at the pointed end of Arp3. Second, the binding sites of all NPFs partially overlap with the mother-filament binding site of Arp2/3 complex. These findings suggest the need for additional intermediate steps along the activation pathway that are compatible with tight binding of Arp2/3 complex to the mother filament and subsequent nucleation of a branch.
Results
Electron microscopy and image analysis revealed two distinct conformations of the Arp2/3 complex in the presence of NPFs
We obtained 3D reconstructions of Arp2/3 complex in the presence of several NPFs (Figure 1; Supplementary Figure S1) using fully hydrated samples (electron cryo-microscopy) as well as dehydrated, negatively stained samples. We used a complex of full-length N-WASp with its activator Nck (N-WASp/Nck, molecular weight 153 kDa) bound to budding-yeast Arp2/3 complex, or Scar-VCA fragment (12 kDa), a Scar-VCA fragment tagged with maltose-binding protein (MBP) (55 kDa) or full-length cortactin (90 kDa) bound to Acanthamoeba Arp2/3 complex.
Figure 1.

3D reconstructions of Arp2/3 complexes bound to different NPFs. (A–C) Different views of the reconstructions. Views looking towards the pointed end (A), the barbed end (B) and the Arp2 side (C) of the complex are shown. Crystal structure column: the crystal structure column shows a low-resolution representation of the crystal structure of inactive bovine Arp2/3 complex (PDB code: 1K8K). Subdomains 1 and 2 of Arp2 were completed using the structure of an actin monomer (1ATN) overlaid with subdomains 3 and 4 of Arp2. All samples segregated into two classes. Class I column: The class I column shows a surface representation of the class common to all samples. The one shown was obtained from budding-yeast Arp2/3 complex in the presence of N-WASp/Nck. The differences between class I and the low-resolution density calculated from the completed crystal structure were not significant, suggesting that no NPFs are bound in that conformation. Class II columns: The class II columns show surface representations of the second class of the respective samples. In general, all reconstructions are significantly different from the crystal structure, and in some regions from each other. Arrows point out some differences, colour coded according to region. The grey arrow points at changes attributed to Arp2 repositioning. The reconstruction in the Scar-VCA column was obtained from Acanthamoeba Arp2/3 complex in the presence of Scar-VCA tagged at the N-terminus with MBP. (D) Colour mapping for the Arp2/3 subunits depicted in the crystal structure columns of (A–C). The same colour scheme applies to Figures 2 and 4. (E) Fourier shell correlation for Acanthamoeba Arp2/3 complex with cortactin (blue), Scar-VCA (cyan) and budding-yeast Arp2/3 complex with N-WASp/Nck (magenta). The 0.5 cutoff criterion for the Fourier shell correlation (dotted lines) indicates 1.9–2.3 nm resolutions for these reconstructions. (F) Representation of the variance analysis of class II projections. The variance (red) was mapped into 3D and overlaid with surface representations of the Arp2 view (C) of the respective reconstructions of class II. The location of peaks 2 and 3 overlaps for Scar-VCA and N-WASp/Nck while peak 1 is only seen in the reconstruction of Acanthamoeba Arp2/3 complex in the presence of cortactin.
Between 4000 and 10 000 particles were selected for each sample. No preferred orientation with respect to the sample support film was observed for any of the samples and the distributions of orientations were even and complete (Supplementary Figure S1e). For all samples, we performed an iterative sorting procedure (Supplementary Figure S2) starting with models previously suggested for the inactive, active and intermediate conformations. Namely, the initial references for sorting were the original crystal structure (Robinson et al, 2001), a structure with Arp2 moved towards Arp3 to form a filament template (Rouiller et al, 2008), and a model with Arp2 moved to an intermediate position half way in between (following a previous suggestion by Rodal et al, 2005). At each step, the sorted classes were rigorously tested for model independence using at least three different models including the ones used for sorting, one calculated directly from the data using a common-line approach (Ludtke et al, 1999) and an alternative model for the activated complex based on a rotation around the ARPC2/ARPC4 helices (Robinson et al, 2001). If model dependence was detected in any of the sorted classes, the references for the sorting were modified and the sorting was repeated until no model dependence in any of the sorted classes remained.
The sorting analysis indicated that the particles in all of our samples segregated into two distinct classes regardless of which NPF was present (Figure 1). As justified by the detailed analysis that follows, our interpretation is that the particles in class I lack bound NPF and those in class II have a bound NPF. We found no evidence for intermediate conformations such as the one suggested by the analysis of two-dimensional (2D) projection images (Rodal et al, 2005), even if these models were provided as references in the sorting procedures. While reconstructions from particles sorted into one of the classes did not differ significantly between samples with different NPFs, reconstructions from the other class showed different density features, dependent on the NPF used (Figure 1, class II columns).
To obtain the highest possible resolution information and fidelity while guarding against artefacts, we generated independent reconstructions of fully hydrated samples (electron cryo-microscopy) as well as of dehydrated, negatively stained samples. The relatively small size and lack of symmetry of our specimens limits the achievable accuracy in alignment and classification for unstained samples and, consequently, the resolution (Henderson, 1995). We determined the corresponding resolution limit for these cryo-samples to be ∼2.3 nm (Supplementary Figure S1a). Negative staining can improve this limit to ∼2.0 nm (Ohi et al, 2004) but may introduce some stain-related artefacts. Because of the cubic relationship between resolution and information content, the improvement from 2.3 to 2.0 nm corresponds to a 1.52-fold increase in information content, a significant advantage for the achievable accuracy in docking of atomic models into the reconstructions. A Fourier shell correlation calculation between the stained and the unstained reconstructions indicates that there are no significant differences, and hence no staining artefacts, at the resolution of the cryo-reconstruction (see Supplementary Figure S1a). The resolution for the final reconstructions in negative stain, according to the 0.5 Fourier shell correlation cutoff between two randomly selected halves, was 2.0 nm for the class II reconstructions of Arp2/3 complex in the presence of cortactin or Scar-VCA and 2.3 nm for class II Arp2/3 complex in the presence of N-WASp/Nck (Figure 1E). The lower resolution of the latter is most likely due to the inherent flexibility of the bound N-WASp/Nck (see below and Supplementary Figure S1b–d). The resolution for the class I reconstructions was generally a little lower than that for the class II reconstructions (2.0–2.5 nm) owing to the smaller number of contributing images (see below). A reconstruction calculated from all class I data across data sets approached a resolution of 1.9 nm.
We used the ratios of particles in class II (NPF-bound Arp2/3 complex) to class I (free Arp2/3 complex) to make rough estimates of the dissociation equilibrium constants. The ratios were 13:10 for Acanthamoeba Arp2/3 complex with MBP-Scar-VCA, 16:10 for Scar-VCA, 27:10 for cortactin and 40:10 for budding-yeast complex with N-WASp/Nck. Assuming that most of the 500-nM NPF was free, the Kd values ranged from 0.1 μM for N-WASp/Nck with budding-yeast Arp2/3 complex to 0.4 μM for MBP-Scar-VCA with amoeba Arp2/3 complex. These affinities are similar to the values of 0.1–0.3 μM for fission yeast WASP-CA binding to the high-affinity sites on bovine and yeast Arp2/3 complex determined by calorimetry (Ti et al, 2011).
The NPF-free reconstruction (class I) resembles the Arp2/3 complex crystal structure
We used statistics-based, modular density fitting to dock crystal structures into the reconstructions (Volkmann and Hanein, 1999). In this procedure, atomic-resolution rigid-body modules obtained from the crystal structures are docked into corresponding modules of the experimental reconstructions. Modularization of the densities was achieved using the 3D watershed transform. The procedure identifies compact density compartments and their boundaries within the reconstructions. This allows an unbiased segmentation of self-contained density modules that most likely can move independently of each other (Volkmann, 2002).
In reconstructions of Arp2/3 complex, we found consistently four modules that could be assigned to Arp3/ARPC3, Arp2, ARPC2 and ARPC1/ARPC4/ARPC5 (Supplementary Figure S3). The segmentation of class II, NPF-dependent reconstructions yielded additional density segments possibly attributable to the NPFs. In contrast to the crystal structures where electron density is present only for subdomains 3 and 4 of Arp2 unless the crystals are fixed with glutaraldehyde (Nolen and Pollard, 2007), the segmented module for Arp2 includes density for all four subdomains in all reconstructions. For the class I reconstructions of Arp2/3 complex that were common to all samples (Figure 1), we found no statistically significant difference between the modular fits and the fit of the complete crystal structure (Robinson et al, 2001) with a modelled subdomains 1 and 2 of Arp2 at the resolution of the reconstructions. The relatively high correlation of 0.90±0.02 confirms the good correspondence between the reconstruction and the crystal structure. The use of alternative crystal structures with different nucleotides bound or treated with glutaraldehyde (Nolen et al, 2004; Nolen and Pollard, 2007) did not yield significantly different docking scores, indicating that the differences between the crystal structures are beyond the detection limit of our methodology (see also Supplementary Figure S4). This is not surprising, given the fact that the largest overall root-mean-square deviation between the various crystal structures is below 0.3 nm. The fact that there is no statistically significant difference between the docking score achieved by modular docking and the score achieved by docking the entire crystal structures as a rigid body indicates that there are no differences between the crystal structures and the class I reconstruction at our level of detection. In particular, these reconstructions contained no additional density attributable to bound NPFs. Furthermore, there was no significant difference between the class I reconstruction and a reconstructions of Arp2/3 complex obtained from control samples in the absence of NPFs. In the light of these findings, we conclude that the class I reconstructions represent the conformation of the inactive form of Arp2/3 complex without bound NPFs.
Arp2/Arp3 heterodimer adopts a filament-like arrangement in the NPF-bound conformation of Arp2/3 complex
Docking the inactive crystal structure with a model of subdomains 1 and 2 of Arp2 as a rigid body into all class II reconstructions left several parts of the structure outside the density. When the four rigid-body modules defined above were docked independently into the respective density segments, the fits improved significantly and Arp2 and Arp3 arranged close to the configurations of two successive subunits along the short-pitch helix of an actin filament. This result is remarkable, because no information about the actin filament was used in the docking process.
Interestingly, we found no statistically significant differences between these fits of Arp2/3 complex to the reconstructions of the various NPF-bound Arp2/3 complexes despite the fact that each reconstruction showed different densities attributable to bound NPFs (Figure 1A–C, arrows). This indicates that the class II conformation of Arp2/3 complex is independent of the specific bound NPF, allowing us to use the various reconstructions for cross-validation of the modular docking and to produce a more reliable consensus model for the conformation of Arp2/3 complex when NPF is bound. 2D projection analysis of NPF bound to either bovine or budding-yeast Arp2/3 complexes suggested that these complexes adopt similar conformations (Rodal et al, 2005). Here, 3D reconstructions originating from two species, Acanthamoeba and budding yeast, provide further evidence that the conformation of Arp2/3 complex when NPF is bound is shared between widely divergent species.
The Arp3 conformation is incompatible with a filament-like closed cleft in the NPF-bound conformation of Arp2/3 complex
Despite the improved fit using the unmodified rigid-body modules from the crystal structure (with a model of complete Arp2), density mismatches between the reconstruction and the models of Arp2 and Arp3/ARPC3 were still apparent (Figure 2). The closed nucleotide-cleft conformation of Arp2 as modelled in the branch junction fits the density module of Arp2 significantly better than more open models and fully accounts for the density of the module (Figure 2D; Table I). We conclude that the nucleotide-binding cleft of Arp2 is closed in the NPF-bound state.
Figure 2.

Molecular model of the NPF-bound conformation of Arp2/3 complex. (A, B) Four orthogonal views of the molecular model of the NPF-bound conformation of Arp2/3 complex in cartoon representation and a transparent surface representation of the class II reconstruction from which the NPF density was removed are shown (see Materials and methods model building section for details). The colour scheme of the Arp2/3 subunits follows that in Figure 1D. The excellent visual fit indicates that the conformational changes induced by NPF binding are well accounted for our modelling at the resolution of the reconstruction. (C) Fits of Arp3/ARPC3 (orange, magenta, respectively) models with various states of the Arp3 nucleotide-binding cleft into the transparent surface representation of the density module for these subunits. The view corresponds to the pointed end view in Figure 2A. The models were aligned to subdomain 1 of Arp3 and the contour level of the density presentation was chosen to be slightly lower than that displayed in (A, B) for illustration purposes. Filament and crystal (1K8K) conformations denote closed and open nucleotide-binding cleft, respectively. The fits indicate that Arp3 adopts an intermediate cleft conformation. (D) Fit of two Arp2 models into the Arp2 density module. Subdomains 1 and 2 of Arp2 crystal model were completed using the structure of an actin monomer (1J6Z) overlaid with subdomains 3 and 4 of Arp2. The fits indicate that Arp2 adopts a conformation similar to a subunit in an actin filament.
Table 1. Docking analysis.
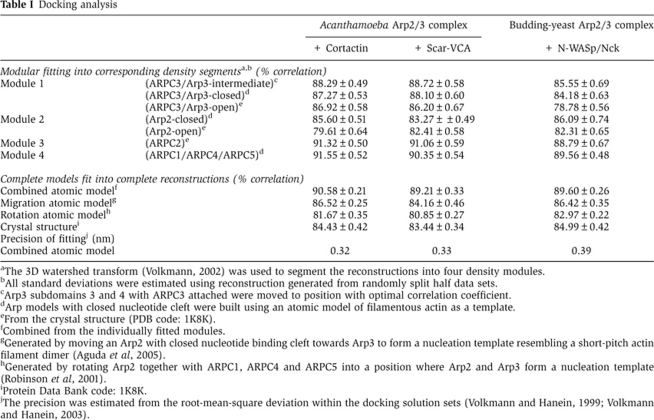
aThe 3D watershed transform (Volkmann, 2002) was used to segment the reconstructions into four density modules.
bAll standard deviations were estimated using reconstruction generated from randomly split half data sets.
cArp3 subdomains 3 and 4 with ARPC3 attached were moved to position with optimal correlation coefficient.
dArp models with closed nucleotide cleft were built using an atomic model of filamentous actin as a template.
eFrom the crystal structure (PDB code: 1K8K).
fCombined from the individually fitted modules.
gGenerated by moving an Arp2 with closed nucleotide binding cleft towards Arp3 to form a nucleation template resembling a short-pitch actin filament dimer (Aguda et al, 2005).
hGenerated by rotating Arp2 together with ARPC1, ARPC4 and ARPC5 into a position where Arp2 and Arp3 form a nucleation template (Robinson et al, 2001).
iProtein Data Bank code: 1K8K.
jThe precision was estimated from the root-mean-square deviation within the docking solution sets (Volkmann and Hanein, 1999; Volkmann and Hanein, 2003).
While the changes we introduced account well for the data as evidenced by the high docking scores and excellent visual fit (Table I; Figure 2A and B), more subtle changes such as rearrangements of secondary structure elements may exist beyond the detection limit of our methodology and/or reconstruction quality. In an effort to avoid over-fitting, we followed a conservative approach for all docking experiments and introduced the minimum changes necessary to explain the data. All modelling and fitting steps were subjected to hypothesis testing and were confirmed to lead to statistically significant improvements in the correlation using well-established statistical tools (Volkmann, 2009). We used a cross-validation approach throughout to validate all conformational changes described here. Using this approach, we also tested an alternative model where the VCA C region is attached at the barbed end of Arp2 as previously suggested by the interpretation of small angle X-ray scattering experiments (Boczkowska et al, 2008). In this configuration, the density that we attribute to VCA might be accounted for by an additional movement of subdomain 2 of Arp2. However, statistical analysis showed that the presence of the C region at the barbed end of Arp2 reduced the fitting scores in a statistically significant manner (confidence level 99.95%), allowing us to rule out the possibility that CA is bound to the barbed end of Arp2 in this conformation (Supplementary Figure S5).
In contrast to Arp2, neither a closed filament-like conformation nor open conformation of Arp3/ARPC3, such as the one observed in crystal structures, match the density of this module (Figure 2B). To better accommodate the observed density of the Arp3/ARPC3 module, we generated a succession of models with different degrees of nucleotide-cleft closure for docking independently into the corresponding density segments. The model with the highest correlation with the Arp3/ARPC3 module has the cleft of Arp3 intermediate between that in the branch-junction and crystal structures (Table I; Figure 2C).
In addition to the changes related to the Arp2 and Arp3/ARPC3 modules, rigid-body fitting of the ARPC2 and ARPC1/ARPC4/ARPC5 modules suggests that these modules rotate relative to each other by a small amount (<10°). The model of the NPF-bound Arp2/3 complex with Arp2 moved from its position in the crystal structures is compatible with the N-terminal helix of ARPC5 being attached to Arp2 as observed in crystal structures. The combined model as well as the individual modules fit the corresponding densities not only significantly better than the crystal structure of inactive Arp2/3 complex but also better than previously obtained hypothetical models for the active complex when docked as rigid bodies (Table I). All changes and modularizations are independently reproducible for six independent data sets of NPF-bound Arp2/3 complexes resulting in models within the precision stated in Table I (root-mean-square deviation between all six models 0.35 nm) at a confidence level of 99.95%.
The NPF-binding sites on Arp2/3 complex partially occlude the mother-filament binding site
Unbiased segmentation using the watershed transform (Volkmann, 2002) provided the initial estimate for the density attributable to the Arp2/3 complex components and the NPFs (Supplementary Figure S3). The resulting segments were refined in conjunction with an iterative modular fitting procedure as previously described (Volkmann, 2009). Then, calculated densities for all fitted components of the Arp2/3 complex were subtracted from the unsegmented experimental reconstructions. For further analysis, only difference density outside three standard deviations of the entire difference map (±3σ), corresponding to a significance level of α=0.0027, was considered. For cross-validation, the entire procedure was performed independently for reconstructions calculated from two different random halves of the data for each of the reconstructions. Only difference density that was present in both difference maps was considered for further analysis. Through this cross-validation approach, we can also estimate the precision of the boundaries of the extra densities (positive difference) as well as their contact area with the Arp2/3 complex model, both of which are reproducible within 0.5 nm for all reconstructions. No parts of the Arp2/3 complex model protruded outside the density (see also Figure 2) and thus no significant negative differences were observed.
Positive differences between the fitted models and the reconstructions can be either due to stabilization of regions that are disordered and thus not visible in the crystal structures used to build the models, to additional components not present in the model but present in the reconstructions (such as NPFs), or to conformational changes that have not been modelled. The lack of negative differences indicates that the fitted model is sufficient to explain the assigned density at the given level of resolution.
We identified two cross-validated difference density segments that are in close proximity to regions of Arp2/3 complex disordered in the crystal structures. One such density segment occurred for all class II reconstructions, independent of the bound NPF. This segment (pink in Figure 3A) is in immediate vicinity of the resolved ends of missing regions in ARPC1 and ARPC2, a total of ∼50 missing residues. While we cannot rule out that some of this density segment may contain contributions from the NPFs, it is likely that most of it is attributed for by these ∼50 residues not visible in the crystal structures but stabilized in the NPF-bound conformation similar to stabilization of functional loops in myosin while bound to actin filaments (Volkmann et al, 2000, 2005). In addition, we found a second cross-validated difference density segment that is common to all reconstructions. This segment coincides spatially with the expected location of a loop of ARPC5 that is missing in the crystal structure (see also Supplementary Figure S5; ARPC5 linker). This difference disappears if the loop is modelled into the fitted structure prior to calculating the difference. None of the other cross-validated difference density segments is close to large missing regions in the complex or could be explained by conceivable conformational changes. We conclude that these segments primarily correspond to the bound NPFs (red in Figure 3).
Figure 3.

Localization of the NPF on the Arp2/3 complex. (A) The pointed end view of the entire Arp2/3 complex, (B) the Arp3 view of the entire complex, (C) the side view of the Arp2/Arp3 heterodimer in the NPF-bound conformation and (D) the Arp3 subunit with Arp2 removed for clarity. The Arp subdomains are marked in the first row of (C, D). The first row shows a low-resolution representation of the NPF-bound Arp2/3 conformation (model of class II, Figure 2A and B) in the colour scheme defined in Figure 1D. The row labelled cortactin shows the density attributable to the bound cortactin (red) mapped onto the low-resolution representation shown in the first row (white). The extra density at ARPC1 (in pink) can largely be attributed for by the ∼50 residues missing in the crystal structure from ARPC1 (∼30 residues) and the C-terminus of ARPC2 (∼20 residues). The row labelled ‘N-WASp’ shows the density attributable to the bound N-WASp/Nck (red). Most of the N-WASp/Nck is not visible in our maps and appears to be disordered as suggested by the large variance peak in this region (peak 3 in Figure 1F). The row labelled ‘Scar’ shows the density attributable for by Scar-VCA (red) and the additional density present in the Scar-VCA construct with an N-terminal MBP tag (orange). This location marks the N-terminus of the V region (V). The density does not account for all of MBP, indicating that it is flexibly attached. The row labelled ‘FRET’ shows the location of the C-terminus of the A region (blue, marked A) and the N-terminus of the C region (cyan, marked C). The peaks are contoured to contain 0.5 of the entire probability density. The location determined by FRET is fully consistent with the NPF densities obtained by electron microscopy. The MBS row shows the mother-filament contacts determined previously by electron tomography of fully assembled Arp2/3-mediated branch junctions (Rouiller et al, 2008). It is clear that the NPF locations determined here overlap with the mother-filament contacts at the MBS2-binding site (green) while the MBS1 and MBS3-binding sites (magenta) remain accessible.
The cross-validated density attributable to cortactin wraps around Arp3 and continues on the top of ARPC2, ARPC4, ARPC5 and ARPC1 (Figures 1A–C and 3). Some of the density located at the pointed end of Arp3 overlaps with part of the mother-filament binding sites (MBSs). The density bridging ARPC2, 4, 5 and 1 is consistent with the cortactin attachment site observed in 2D reconstructions of actin-filament branches (Egile et al, 2005), suggesting that cortactin remains attached to the site at ARPC2, 4, 5 and 1 after branch formation. We performed an analysis of the 2D variance using projection images along the Arp2 and Arp3 views (Figure 1F). This analysis detects (in projection) regions in the structure, where high variability is present. The analysis detects a peak close to the cortactin attachment site at ARPC5 (Figure 1F, peak 1). This variance peak is most likely associated with the portion of cortactin that is not bound to Arp2/3 complex and that is not visible in the density due to its high variability. If the reconstruction of cortactin-bound Arp2/3 complex is docked onto the mother filament using the branch-junction model (Rouiller et al, 2008) as a template, the variance peak maps in between the mother and the daughter filaments. Interestingly, this site on the mother filament is close to the cortactin-binding site on subdomain 1 of actin previously determined using helical reconstruction techniques of actin filaments with bound actin-binding repeating domain of cortactin (Pant et al, 2006). This cortactin-binding site is close to but does not overlap with the Arp2/3 complex binding site on the mother-filament subunit that provides the majority of the ARPC2/ARPC4 contacts.
Reconstructions of budding-yeast and Acanthamoeba Arp2/3 complex with WASp family NPFs bound are remarkably similar in appearance (Figure 1A–C) and all clearly show additional density close to the pointed ends of Arp2 and Arp3 (Figure 3). The extra density in the reconstruction containing Scar-VCA without the MBP tag, accounts for a molecular weight of 10–12 kDa, indicating that most of VCA is folded and attached to the pointed end of the Arp dimer in the particles reconstructed. The extra density for Scar-VCA with the MBP tag is very similar to the extra density of Scar-VCA without the MBP tag in the vicinity of the Arp2/3 complex (boundaries within 0.5 nm of each other) but shows density in addition to that of untagged Scar-VCA at the far end, which we attributed to the presence of MBP (Figure 3, orange peak). The extra density in the reconstruction containing N-WASp/Nck accommodates only about 15% of its molecular weight (∼25 kDa). This fact suggests that the parts of N-WASp/Nck beyond VCA are flexibly linked to the VCA bound to Arp2/3 complex. This interpretation is supported by the location of the main 2D variance peak, which is close to the N-WASp/Nck density at the pointed end in the projection image of the reconstruction (Figure 1F, peak 3). In addition, a cloud of weak density can be seen in the same location in some of class averages (Supplementary Figure S1c, arrowhead). Individual particles show density of beads-on-a-string appearance protruding in random angles from Arp2/3 complex (Supplementary Figure S1b), compatible with N-WASp/Nck being flexibly linked to VCA when it is bound to the complex. The extra density of Arp2/3 complex with bound MBP-tagged Scar-VCA as compared with untagged Scar-VCA (Figure 3, orange peak) is at the same location as the extra density for N-WASp/Nck. The variance analysis shows a peak for MBP-tagged Scar-VCA at the same pointed end location as the variance for N-WASp/Nck (Figure 1F, peak 3).
We conclude that most of the VCA region that is visible in our reconstructions is located at the pointed end of the Arp2/Arp3 dimer where it partially occludes the mother-filament binding site 2 (MBS2; Figure 3, green surface). However, MBSs MSB1 and MBS3 are not directly obscured by the VCA density observed here.
FRET analysis confirms binding of VCA to the pointed end of the Arp2/Arp3 dimer
To localize the C and A regions of the WASp-VCA while bound to Arp2/3 complex, we used a combination of fluorescence cross-correlation spectroscopy (FCCS) (Bacia and Schwille, 2007) and moment-based brightness analysis (Muller, 2004). We acquired quantitative FRET data between CA peptides labelled with Texas Red (TR) on either the N-terminus (TR-CA) or C-terminus (CA-TR) and Arp2/3 complexes with GFP-tags at the C-termini of either Arp2, Arp3, ARPC3 or ARPC1. This FRET analysis yielded a total of eight measurements (Figure 4). Average FRET efficiency was converted to distance using an R0 of 5.15 nm.
Figure 4.

Methods and results for FRET measurement between Arp2/3 subunits tagged with GFP and TR-labelled CA peptide. (A–C) FCCS with 488 nm excitation for eGFP and 561 nm excitation for TR was used to measure the percentage of Arp2/3 complex bound with peptide at a range of peptide concentrations. As an example, representative curves are shown for ARPC3–GFP (A) titrated with TR-CA at the concentrations indicated in (B). The concentration of ARPC3–GFP was held constant (B). FCS curves of TR-CA are shown at the concentrations labelled. In FCS, the amplitude of the autocorrelation curve is inversely proportional to concentration. At each concentration of TR-CA, the cross-correlation was calculated between ARPC3–GFP and TR-CA. An example cross-correlation curve is shown in blue (C) for the concentrations of TR-CA and ARPC3–GFP. (D) The relative amplitude of the cross-correlation compared with the autocorrelation curves (example in C) is used to calculate the percentage of ARP2/3 bound to peptide at each peptide concentration. Representative data are shown for ARPC3–GFP titrated with TR-CA. (E) At each concentration of the TR-labelled peptide, after the FCCS measurement, the 561-nm laser was turned off and eGFP data were acquired and fit with moment-based brightness analysis. The curve of average brightness of each GFP-labelled Arp2/3 complex as a function of fraction bound to labelled CA was fit to extract bound (quenched) and unbound (unquenched) brightness of GFP, which was converted to FRET efficiency. Representative data are shown for Arp3–GFP titrated with TR-CA, which are the pair with the highest FRET. (F) Tables showing FRET efficiency (top) and corresponding distances (bottom) between the C-terminal GFP of indicated subunits and TR at C- or N-terminus of the CA peptide.
In the presence of a TR-tagged CA peptide (fluorescence acceptor), FRET clearly reduced the molecular brightness of GFP-labelled Arp2/3 complex (fluorescence donor) for all eight pairs (Supplementary Figure S6). The largest reduction in brightness was observed between Arp3–GFP when bound to TR-CA. Moderate FRET was observed between Arp2–GFP and TR-CA, and between CA-TR and ARPC3–GFP and Arp3–GFP (Figure 4), while very low FRET was observed between ARPC3–GFP or ARPC1–GFP and TR-CA, and between CA-TR and ARPC1–GFP and Arp2–GFP. The eight distances measured were incorporated into a single model to locate the CA peptide on Arp2/3 (Figure 3, FRET row). Briefly, the FRET distance constraints were converted into probability densities, incorporating the distance uncertainties derived from the steady-state anisotropy measurements and a model for the probable location of the respective GFP-tags. For ARPC3–GFP and Arp3–GFP, we used the location of the GFP moiety identified in the corresponding 3D reconstructions to construct a probability region for the centres of GFP, for Arp2–GFP and ARPC1–GFP, the respective probability region for the GFP centres was determined from the location of the subunit's C-terminus, the length of the linker and the diameter of GFP. The probability densities for the individual CA locations were combined into a joint probability distribution that accounts for all experimental uncertainties in the system (Supplementary Figure S7). The distance between the centroids of the probability distributions of the GFP locations and the centroids of the probability distributions for the CA-TR (Figure 3, blue peak) and TR-CA (cyan peak in Figure 3) reproduce the measured distances within the uncertainties of the measurements for all FRET pairs. The difference between the centroid-to-centroid distances for the CA-TR probe and the corresponding measurements listed in Figure 4F is 0.3 (±0.2) nm; that for the TR-CA probe is 0.6 (±0.4) nm. These values indicate an excellent agreement between the measurements and the modelled probability distributions and suggest that the localization of the probes is within the 1-nm accuracy range. The probabilistic mapping of the two probes at either end of CA is fully consistent with the density observed for N-WASp/Nck and Scar-VCA, localizing at the pointed ends of Arp2 and Arp3.
Discussion
Actin-filament branch formation depends on Arp2/3 complex and four other components, ATP, NPFs, mother filaments and actin monomers. Here, we provide structures of Arp2/3 complex with bound NPFs. Our studies reveal that binding of NPFs induces distinct structural changes in Arp2/3 complex that are independent of the specific NPF bound. The similar results obtained for NPFs from diverse sources indicate that conformational change during activation of Arp2/3 complex is shared widely.
One of the most striking changes induced by NPF binding is the rearrangement of the Arp2 and Arp3 subunits into a geometry resembling a short-pitch actin-filament dimer within 0.4 nm precision. The existence of such rearrangement of Arp2 and Arp3 was originally suggested by homology modelling of Arps (Kelleher et al, 1995) and was shown to exist in the fully assembled branch junctions (Volkmann et al, 2001; Egile et al, 2005; Rouiller et al, 2008). Here, we show that NPF binding favours this conformational change. Two hypothetical pathways were proposed to reach this spatial arrangement. One postulates movement of Arp2 with respect to the otherwise rigid Arp2/3 complex (Aguda et al, 2005) and the other postulates a 20° twist of a rigid body composed of Arp2, ARPC1, ARPC4 and ARPC5 in respect to Arp3, ARPC2 and ARPC3 (Robinson et al, 2001). The analysis indicates that elements of both models are needed to fit the parts of Arp2/3 complex into the reconstruction of the NPF-bound conformation. We observe that there is indeed a slight twist between the two suggested rigid-body modules, but that an additional movement of Arp2 with respect to the ARPC1/ARPC4/ARPC5 module is required to fit into the observed density. The fitting process maintained several interactions between ARPC4 and Arp2 observed in crystal structures but changed contacts between Arp2 with ARPC1. In fact, regions in ARPC1 that showed reduced hydrogen/deuterium exchange upon binding of VCA (Zencheck et al, 2009) coincide with the new contacts between ARPC1 and Arp2 in the NPF-bound conformation. Our observations suggest that Arp2 remains attached to ARPC4 but not to ARPC1 during the formation of the NPF-bound conformation. Our data are also compatible with the ARPC5 N-terminus providing a tether for assisting the movement of Arp2. The preservation of the contacts between ARPC4 and Arp2 provides a structural explanation as to why deletion of the ARPC5 tether does not significantly impact the activity of fission yeast Arp2/3 complex (Nolen and Pollard, 2008).
In the NPF-bound conformation, Arp2 adopts stable conformations with a closed nucleotide-binding cleft. This conformation of Arp2 resembles that of filamentous actin, similar to the one modelled in the branch junction (Rouiller et al, 2008). In contrast, Arp3 is stabilized in an intermediate conformational state where the nucleotide-binding cleft is half way in between a filament-like closed cleft and the open state observed in the inactive crystal structures. Thus, the overall conformation of NPF-bound Arp2/3 complex does not appear to adopt a fully activated conformation as observed in the branch junction. In actin and actin-related proteins, the state of the nucleotide-binding cleft is coupled to the barbed-end conformation. Thus, the NPF-induced conformation of Arp3 appears to be stabilized in an intermediate inactive state that prevents premature nucleation of a new filament by NPF-bound Arp2/3 complex. Binding to a mother filament is required to complete activation, ensuring that new filaments are only nucleated from the sides of existing filaments.
The analysis shows that cortactin contacts the pointed end of Arp3, wrapping around its back and then building a bridge between ARPC1, 2, 4 and 5, while the WASp family VCA motif binds to the pointed ends of Arp3 as well as Arp2 (Figure 4). Various NMR, hydrogen/deuterium exchange and cross-linking studies implicated Arp2, Arp3, ARPC1 and ARPC3 as potential binding sites for VCA (Weaver et al, 2001; Zalevsky et al, 2001; Kreishman-Deitrick et al, 2005; Zencheck et al, 2009). Cortactin and N-WASp-VCA can bind the Arp2/3 complex simultaneously; yet compete for binding to Arp3 (Weaver et al, 2001). The Arp3-binding sites in cortactin and VCA identified in this study overlap, consistent with this competition.
Our data clearly indicate that the VCA density in the NPF-bound complex is located at the pointed ends of Arp2 and Arp3. The location of an N-terminal MBP tag of VCA as well as that of the extra density of a larger construct indicates that the N-terminal V region is located at the pointed end as well. This result is consistent with the FRET data localizing the C-terminus of the A region and the N-terminus of the C region of VCA at the same location (Figure 3). This observed VCA density occludes part of the MBS2 on Arp2/3 complex determined by electron tomography of branch junctions (Rouiller et al, 2008) (Figure 3), explaining why CA binding to this high-affinity site inhibits binding of Arp2/3 complex to mother filaments (Ti et al, 2011). On the other hand, CA associated with MBS2 appears to leave open the MBS1-binding site (Rouiller et al, 2008) involving ARPC2, ARPC4, ARPC5 and ARPC1 (Figure 3). The availability of MBS1 together with the fact that 47% of the conserved residues comprising this site are charged (Beltzner and Pollard, 2004) may allow for longer-range, weaker electrostatic interactions between MBS1 and actin filaments. Myosin (Sweeney and Houdusse, 2004) and vinculin (Janssen et al, 2006) both make use of such weak electrostatic interactions to bind actin filaments. The high occupancy of VCA of a site that partially occludes the mother-filament binding site strongly indicates that this is the high-affinity binding site characterized in biochemical experiments (Ti et al, 2011).
V region of VCA binds monomeric actin (Chereau et al, 2005) and is generally believed to deliver the first actin monomer to the Arp dimer to form the nucleus for the daughter filament, but the location of the high-affinity site described here precludes delivery of the first actin subunit from V to the daughter filament. Therefore, the class II NPF-bound conformation is likely to be an intermediate in the branch formation pathway. For illustration purposes, Figure 5 shows how our class II structure might fit into one plausible pathway of branch formation that is compatible with our data. In this scenario, activation of a WASp family protein that exposes the VCA region, which binds Arp2/3 complex (1), triggering the conformational change that produces the class II structures described in this study. In these structures, Arp2 and Arp3 adopt an arrangement similar to a short-pitch actin dimer in a filament, but this conformation is not amenable to nucleate new filaments or bind the side of a mother filament (2), because the bound VCA (VCA I) occludes the filament-binding site MBS2 of Arp2/3 complex. When VCA-bound Arp2/3 complex encounters a pre-existing actin filament, some mechanism, perhaps weak electrostatic interactions of the VCA–Arp2/3 complex at MBS1 with the filament (3), needs to trigger a number of changes (4) to allow binding of Arp2/3 complex to the side of a filament. These changes include the rearrangement of two mother-filament subunits and the closure of the Arp3 nucleotide cleft (white arrow) observed in the reconstruction of the entire Arp2/3 branch junction (Rouiller et al, 2008).
Figure 5.

Schematic snapshots of early key stages of the pathway of Arp2/3 complex mediated branch formation. (1) VCA binds to inactive Arp2/3 complex, triggering reorientation of Arp2 (red arrow) to form a short-pitch actin-filament-like arrangement with Arp3 as well as partial cleft closure in Arp3 (light grey arrow) and complete cleft closure in Arp2. (2) VCA is bound at the pointed end of the Arp2/Arp3 heterodimer (black arrowhead). This conformation does not support growth of a new filament from the Arp2/Arp3 dimer. In addition, the bound VCA partially occludes the Arp2/3 complex binding site for actin filaments. (3) Because the binding site is not fully accessible, VCA-bound Arp2/3 complex can bind actin filaments only weakly, if at all, possibly through electrostatic interactions. (4) Several changes need to take place to allow binding of Arp2/3 complex to the side of an actin filament. These changes should include closing of the Arp3 nucleotide-binding cleft (light grey arrow) and rearrangement of two mother-filament subunits as observed in the fully assembled branch junction (Rouiller et al, 2008). In addition, the affinity of the binding site for actin-bound VCA at the barbed end of Arp3 needs to increase to allow binding and delivery of the first daughter-filament subunit (Ti et al, 2011). Finally, dissociation of the first VCA that is bound to Arp2/3 complex at the filament-binding site (red arrow) is necessary to allow tight binding of Arp3/3 complex to the actin filament.
Additional intermediates are required from this point in the pathway. A crystal structure and kinetic analysis (Ti et al, 2011) and cross-linking experiments (Padrick et al, 2011) show that VCA binding to a low-affinity site on the back side of Arp3 promotes binding of Arp2/3 complex to the mother filament and positions V to deliver the first subunit to the daughter filament. VCA bound to the high-affinity site described here would have to dissociate at some point during this step (red arrow in Figure 5) to allow complete binding of Arp2/3 complex to the mother filament. Formation of a tight, three-subunit filament-like nucleus differs from models of nucleation by proteins with multiple V-domains such as Spire, where the actin subunits are proposed to form a rather loose, open nucleating structure (Ducka et al, 2010).
A model from small angle X-ray solution scattering experiments with Arp2/3 complex and a cross-linked actin–VCA construct were interpreted with the actin monomer attached to the barbed end of Arp2 (Boczkowska et al, 2008). This site on the barbed end of Arp2 differs from the high-affinity binding site for free VCA described here and is a candidate to deliver a second actin subunit to the daughter filament (Padrick et al, 2011). Peak 2 at the barbed ends of the Arps identified in our variance analysis (Figure 1) of VCA-bound Arp2/3 complexes may indicate the location of such a low-occupancy binding site for WASp-VCA.
This is only one possible mechanism that is compatible with the available data. On one hand, while higher-resolution studies are likely to reveal more subtle conformational changes that are beyond our detection limit, the indication that the conformation of Arp2/3 complex is, in average, virtually independent of the bound NPF at the resolution of this study (2 nm) suggests that the underlying mechanism for mother-filament binding may be universal. On the other hand, while different proteins share common binding sites on actin filaments and single proteins can bind to more than one site on actin with different affinities, the existence of some weak-binding state between NPF-bound Arp2/3 complex and the mother filament is not strictly necessary to explain the available data.
Our study further characterizes and extends the conformational states of Arp2/3 complex along the activation pathway. In addition, this study provides evidence for a multiple-step regulation in branch formation that requires the presence of all factors, ATP, NPFs, monomeric actin and pre-existing actin filaments in order to form branches in a spatially and temporally precise manner.
Materials and methods
Protein purification and electron microscopy
Acanthamoeba and budding-yeast Arp2/3 complexes, Scar-VCA (∼12 kDa), MBP-Scar-VCA (∼55 kDa), N-WASp/Nck (∼140 kDa) and full-length cortactin (∼90 kDa) were purified as described elsewhere (Egile et al, 1999, 2005; Martin et al, 2005). In all, 500 nM of the respective NPF was mixed with either 50 nM budding-yeast or 100 nM Acanthamoeba Arp2/3 complex in 2 mM imidazole, pH 7.0, 50 mM KCl, 2 mM MgCl2, 1 mM EGTA, 0.2 mM DTT, 0.1 mM ATP, 0.02% azide. To ascertain activity of the imaged NPF-bound Arp2/3 complexes, pyrene-actin polymerization assays were conducted as previously described (Egile et al, 2005; Rouiller et al, 2008). The choices of concentration of the NPFs, guided by pyrenyl-actin polymerization assays, were set to allow to saturate the high-affinity site determined by biochemical binding experiments (Ti et al, 2011). This concentration should allow obtaining the highest yield of particles in the conformation triggered by binding of NPFs to the high-affinity site with minimum background and minimal contamination by lower-affinity sites.
The prepared samples were applied to homemade carbon-coated electron microscopy 400 mesh copper grids (SPI Inc). For electron cryo-microscopy, the grids were blotted and immediately plunged in liquid ethane and kept at liquid nitrogen temperatures for the entire data collection. For negative staining, 2% uranyl acetate was applied to the grids, which were subsequently blotted and air-dried. Images of all samples were acquired under low-dose conditions (25–50 e−/Å2) using a Tecnai 12 G2 microscope (FEI Electron Optics) equipped with a Lab6 filament at 120 kV and a nominal magnification of × 67 000. Images were captured on ISO163 Kodak film (R Esterman Inc). The defocus was between 1 and 2 μm. The micrographs were digitized using a SCAI Scanner (Integraph) at 7 μm raster and binned to a final pixel size of 0.55 nm.
Image processing
Totals of 4208, 9804, 7557 and 5048 particles were interactively selected from 80, 102, 122 and 101 micrographs of negatively stained budding-yeast Arp2/3 with N-WASp/Nck, Acanthamoeba Arp2/3 complex with Scar-VCA, MBP-Scar-VCA and cortactin, respectively. We selected 8469 particles interactively from 161 micrographs of unstained, cryo-plunged Acanthamoeba Arp2/3 complex with Scar-VCA. All particles were processed and analysed using the EMAN (Ludtke et al, 1999), SPARX (Hohn et al, 2007) and CoAn (Volkmann and Hanein, 1999) software packages using multi-reference refinement protocols (Spahn and Penczek, 2009) with additional tests for reference bias. Details are described in the Supplementary data.
Model building and modular statistics-based docking
All docking and modelling calculations were performed using the CoAn suite for statistics-based modular density docking (Volkmann and Hanein, 1999, 2003). CoAn relies on a global evaluation of the correlation distribution and cross-validation allowing reliable identification of statistical confidence intervals. These intervals are used to derive parameters of interest such as the accuracy of the fits, statistical significance of proposed conformational changes or statistical significance of differences between the docked model and the experimental density (Volkmann, 2009). The confidence level for all statistical tests was set to 99.95%. Models for Arp2 and Arp3 were built as described previously (Rouiller et al, 2008). An open cleft model for Arp2 was built by aligning subdomains 1 and 2 of actin (PDB code: 1ATN) with the resolved portion of subdomain 1 of Arp2 in the cross-linked Arp2/3 complex (PDB code: 2P9I; Nolen and Pollard, 2007) and replacing unresolved residues with those from the aligned actin structure. For cross-validating docking precision and significance of conformational changes, data sets were split up randomly in half. These random halves were treated as independent data sets forming the basis for the statistical analysis (Volkmann, 2009). The extra density for the NPFs was initially segmented from the density of the class II Arp2/3 complex reconstructions in a model-independent fashion using the 3D watershed transform (Volkmann, 2002). The initial NPF segments were iteratively refined in light of the docked models by subtracting the contributions of the class II Arp2/3 complex models from the density of the NPF-bound Arp2/3 complex reconstructions.
FRET between the Arp2/3 complex and TR-labelled CA peptides
To examine FRET between subunits of the Arp2/3 complex and TR-labelled CA, we first purified yeast Arp2/3 complex with individual subunits tagged at the C-terminus with eGFP using a CA affinity column, as previously described (Pan et al, 2004). These tagged Arp2/3 complexes are active in vitro and in vivo (Egile et al, 2005). The N-WASp CA peptide with a cysteine residue at the C-term was synthesized: (Pi Proteomics) (SGIVGALMEVMQKRSKAIHSSDEDEDEDDEEDFEDDDEWED-C) and fluorescently labelled with TR. Free dye was separated from labelled protein using size-exclusion chromatography. Due to the nature of the measurements, unlabelled peptide does not affect results. The same peptide except with an N-terminal cysteine residue was the generous gift of Roberto Dominguez (University of Pennsylvania School of Medicine). To measure FRET between a GFP-tagged Arp2/3 complex subunit and labelled CA quantitatively, it was necessary to distinguish FRET of bound Arp2/3 complex peptide pairs from the average FRET in an ensemble measurement, which includes donor molecules that may be bound or unbound to acceptor. For this, we coupled in vitro FCCS (Bacia and Schwille, 2007) with moment-based brightness analysis (Muller, 2004). Details are given in the Supplementary data.
Supplementary Material
Acknowledgments
This work was supported by NIH P01-GM066311 Grant to TP, RL, DH and NV. NIH Cell Migration Consortium Grant U54 GM64346 from the National Institute of General Medical Sciences (NIGMS) supported feasibility tests for the image processing and sorting calculations to NV.
Author contributions: DH, RL, TDP and NV conceived the project, designed the experiments and wrote the paper. CE and EK characterized the protein samples for electron microscopy. IR collected the electron microscopy data. XPX analysed the electron microscopy data, generated the reconstructions and performed the docking analysis. XF purified the proteins for the FRET experiments. JRU, BDS and XF performed the FRET experiments. BDS analysed the FRET data.
Footnotes
The authors declare that they have no conflict of interest.
References
- Achard V, Martiel JL, Michelot A, Guerin C, Reymann AC, Blanchoin L, Boujemaa-Paterski R (2010) A ‘primer’-based mechanism underlies branched actin filament network formation and motility. Curr Biol 20: 423–428 [DOI] [PubMed] [Google Scholar]
- Aguda AH, Burtnick LD, Robinson RC (2005) The state of the filament. EMBO Rep 6: 220–226 [DOI] [PMC free article] [PubMed] [Google Scholar]
- Bacia K, Schwille P (2007) Practical guidelines for dual-color fluorescence cross-correlation spectroscopy. Nat Protoc 2: 2842–2856 [DOI] [PubMed] [Google Scholar]
- Beltzner CC, Pollard TD (2004) Identification of functionally important residues of Arp2/3 complex by analysis of homology models from diverse species. J Mol Biol 336: 551–565 [DOI] [PubMed] [Google Scholar]
- Blanchoin L, Amann KJ, Higgs HN, Marchand JB, Kaiser DA, Pollard TD (2000) Direct observation of dendritic actin filament networks nucleated by Arp2/3 complex and WASP/Scar proteins. Nature 404: 1007–1011 [DOI] [PubMed] [Google Scholar]
- Boczkowska M, Rebowski G, Petoukhov MV, Hayes DB, Svergun DI, Dominguez R (2008) X-ray scattering study of activated Arp2/3 complex with bound actin-WCA. Structure 16: 695–704 [DOI] [PMC free article] [PubMed] [Google Scholar]
- Chereau D, Kerff F, Graceffa P, Grabarek Z, Langsetmo K, Dominguez R (2005) Actin-bound structures of Wiskott-Aldrich syndrome protein (WASP)-homology domain 2 and the implications for filament assembly. Proc Natl Acad Sci USA 102: 16644–16649 [DOI] [PMC free article] [PubMed] [Google Scholar]
- Ducka AM, Joel P, Popowicz GM, Trybus KM, Schleicher M, Noegel AA, Huber R, Holak TA, Sitar T (2010) Structures of actin-bound Wiskott-Aldrich syndrome protein homology 2 (WH2) domains of Spire and the implication for filament nucleation. Proc Natl Acad Sci USA 107: 11757–11762 [DOI] [PMC free article] [PubMed] [Google Scholar]
- Egile C, Loisel TP, Laurent V, Li R, Pantaloni D, Sansonetti PJ, Carlier MF (1999) Activation of the CDC42 effector N-WASP by the shigella flexneri IcsA protein promotes actin nucleation by Arp2/3 complex and bacterial actin-based motility. J Cell Biol 146: 1319–1332 [DOI] [PMC free article] [PubMed] [Google Scholar]
- Egile C, Rouiller I, Xu XP, Volkmann N, Li R, Hanein D (2005) Mechanism of filament nucleation and branch stability revealed by the structure of the Arp2/3 complex at actin branch junctions. PLoS Biol 3: e383. [DOI] [PMC free article] [PubMed] [Google Scholar]
- Goley ED, Rodenbusch SE, Martin AC, Welch MD (2004) Critical conformational changes in the Arp2/3 complex are induced by nucleotide and nucleation promoting factor. Mol Cell 16: 269–279 [DOI] [PubMed] [Google Scholar]
- Henderson R (1995) The potential and limitations of neutrons, electrons and X-ray for atomic resolution microscopy of unstained biological molecules. Q Rev Biophys 28: 171–194 [DOI] [PubMed] [Google Scholar]
- Hohn M, Tang G, Goodyear G, Baldwin PR, Huang Z, Penczek PA, Yang C, Glaeser RM, Adams PD, Ludtke SJ (2007) SPARX, a new environment for Cryo-EM image processing. J Struct Biol 157: 47–55 [DOI] [PubMed] [Google Scholar]
- Janssen ME, Kim E, Liu H, Fujimoto LM, Bobkov A, Volkmann N, Hanein D (2006) Three-dimensional structure of vinculin bound to actin filaments. Mol Cell 21: 271–281 [DOI] [PubMed] [Google Scholar]
- Kelleher JF, Atkinson SJ, Pollard TD (1995) Sequences, structural models, and cellular localization of the actin- related proteins Arp2 and Arp3 from Acanthamoeba. J Cell Biol 131: 385–397 [DOI] [PMC free article] [PubMed] [Google Scholar]
- Kelly AE, Kranitz H, Dotsch V, Mullins RD (2006) Actin binding to the central domain of WASP/Scar proteins plays a critical role in the activation of the Arp2/3 complex. J Biol Chem 281: 10589–10597 [DOI] [PMC free article] [PubMed] [Google Scholar]
- Kreishman-Deitrick M, Goley ED, Burdine L, Denison C, Egile C, Li R, Murali N, Kodadek TJ, Welch MD, Rosen MK (2005) NMR analyses of the activation of the Arp2/3 complex by neuronal Wiskott-Aldrich syndrome protein. Biochemistry 44: 15247–15256 [DOI] [PubMed] [Google Scholar]
- Ludtke SJ, Baldwin PR, Chiu W (1999) EMAN: semiautomated software for high-resolution single-particle reconstructions. J Struct Biol 128: 82–97 [DOI] [PubMed] [Google Scholar]
- Machesky LM, Mullins RD, Higgs HN, Kaiser DA, Blanchoin L, May RC, Hall ME, Pollard TD (1999) Scar, a WASp-related protein, activates nucleation of actin filaments by the Arp2/3 complex. Proc Natl Acad Sci USA 96: 3739–3744 [DOI] [PMC free article] [PubMed] [Google Scholar]
- Marchand JB, Kaiser DA, Pollard TD, Higgs HN (2001) Interaction of WASP/Scar proteins with actin and vertebrate Arp2/3 complex. Nat Cell Biol 3: 76–82 [DOI] [PubMed] [Google Scholar]
- Martin AC, Xu XP, Rouiller I, Kaksonen M, Sun Y, Belmont L, Volkmann N, Hanein D, Welch M, Drubin DG (2005) Effects of Arp2 and Arp3 nucleotide-binding pocket mutations on Arp2/3 complex function. J Cell Biol 168: 315–328 [DOI] [PMC free article] [PubMed] [Google Scholar]
- Muller JD (2004) Cumulant analysis in fluorescence fluctuation spectroscopy. Biophys J 86: 3981–3992 [DOI] [PMC free article] [PubMed] [Google Scholar]
- Mullins RD, Heuser JA, Pollard TD (1998) The interaction of Arp2/3 complex with actin: nucleation, high affinity pointed end capping, and formation of branching networks of filaments. Proc Natl Acad Sci USA 95: 6181–6186 [DOI] [PMC free article] [PubMed] [Google Scholar]
- Nolen BJ, Littlefield RS, Pollard TD (2004) Crystal structures of actin-related protein 2/3 complex with bound ATP or ADP. Proc Natl Acad Sci USA 101: 15627–15632 [DOI] [PMC free article] [PubMed] [Google Scholar]
- Nolen BJ, Pollard TD (2007) Insights into the influence of nucleotides on actin family proteins from seven structures of Arp2/3 complex. Mol Cell 26: 449–457 [DOI] [PMC free article] [PubMed] [Google Scholar]
- Nolen BJ, Pollard TD (2008) Structure and biochemical properties of fission yeast Arp2/3 complex lacking the Arp2 subunit. J Biol Chem 283: 26490–26498 [DOI] [PMC free article] [PubMed] [Google Scholar]
- Ohi M, Li Y, Cheng Y, Walz T (2004) Negative staining and image classification -- powerful tools in modern electron microscopy. Biol Proced Online 6: 23–34 [DOI] [PMC free article] [PubMed] [Google Scholar]
- Padrick SB, Doolittle LK, Brautigam CA, King DS, Rosen MK (2011) Arp2/3 complex is bound and activated by two WASP proteins. Proc Natl Acad Sci USA 108: E472–E479 [DOI] [PMC free article] [PubMed] [Google Scholar]
- Pan F, Egile C, Lipkin T, Li R (2004) ARPC1/Arc40 mediates the interaction of the actin-related protein 2 and 3 complex with Wiskott-Aldrich syndrome protein family activators. J Biol Chem 279: 54629–54636 [DOI] [PubMed] [Google Scholar]
- Pant K, Chereau D, Hatch V, Dominguez R, Lehman W (2006) Cortactin binding to F-actin revealed by electron microscopy and 3D reconstruction. J Mol Biol 359: 840–847 [DOI] [PubMed] [Google Scholar]
- Pollard TD, Borisy GG (2003) Cellular motility driven by assembly and disassembly of actin filaments. Cell 112: 453–465 [DOI] [PubMed] [Google Scholar]
- Robinson RC, Turbedsky K, Kaiser DA, Marchand JB, Higgs HN, Choe S, Pollard TD (2001) Crystal structure of Arp2/3 complex. Science 294: 1679–1684 [DOI] [PubMed] [Google Scholar]
- Rodal AA, Sokolova O, Robins DB, Daugherty KM, Hippenmeyer S, Riezman H, Grigorieff N, Goode BL (2005) Conformational changes in the Arp2/3 complex leading to actin nucleation. Nat Struct Mol Biol 12: 26–31 [DOI] [PubMed] [Google Scholar]
- Rouiller I, Xu XP, Amann KJ, Egile C, Nickell S, Nicastro D, Li R, Pollard TD, Volkmann N, Hanein D (2008) The structural basis of actin filament branching by Arp2/3 complex. J Cell Biol 180: 887–895 [DOI] [PMC free article] [PubMed] [Google Scholar]
- Spahn CM, Penczek PA (2009) Exploring conformational modes of macromolecular assemblies by multiparticle cryo-EM. Curr Opin Struct Biol 19: 623–631 [DOI] [PMC free article] [PubMed] [Google Scholar]
- Sweeney HL, Houdusse A (2004) The motor mechanism of myosin V: insights for muscle contraction. Philos Trans R Soc Lond B Biol Sci 359: 1829–1841 [DOI] [PMC free article] [PubMed] [Google Scholar]
- Ti SC, Jurgenson C, Nolen BJ, Pollard TD (2011) Structural and biochemical characterization of two binding sites for nucleation promoting factor WASp-VCA on Arp2/3 complex. Proc Natl Acad Sci USA 108: E463–E471 [DOI] [PMC free article] [PubMed] [Google Scholar]
- Volkmann N (2002) A novel three-dimensional variant of the watershed transform for segmentation of electron density maps. J Struct Biol 138: 123. [DOI] [PubMed] [Google Scholar]
- Volkmann N (2009) Confidence intervals for fitting of atomic models into low-resolution densities. Acta Crystallogr D Biol Crystallogr 65: 679–689 [DOI] [PMC free article] [PubMed] [Google Scholar]
- Volkmann N, Amann KJ, Stoilova-McPhie S, Egile C, Winter DC, Hazelwood L, Heuser JE, Li R, Pollard TD, Hanein D (2001) Structure of Arp2/3 complex in its activated state and in actin filament branch junctions. Science 293: 2456–2459 [DOI] [PubMed] [Google Scholar]
- Volkmann N, Hanein D (1999) Quantitative fitting of atomic models into observed densities derived by electron microscopy. J Struct Biol 125: 176–184 [DOI] [PubMed] [Google Scholar]
- Volkmann N, Hanein D (2003) Docking of atomic models into reconstructions from electron microscopy. Methods Enzymol 374: 204–225 [DOI] [PubMed] [Google Scholar]
- Volkmann N, Hanein D, Ouyang G, Trybus KM, DeRosier DJ, Lowey S (2000) Evidence for cleft closure in actomyosin upon ADP release. Nat Struct Biol 7: 1147–1155 [DOI] [PubMed] [Google Scholar]
- Volkmann N, Liu H, Hazelwood L, Krementsova EB, Lowey S, Trybus KM, Hanein D (2005) The structural basis of myosin V processive movement as revealed by electron cryomicroscopy. Mol Cell 19: 595–605 [DOI] [PubMed] [Google Scholar]
- Weaver AM, Karginov AV, Kinley AW, Weed SA, Li Y, Parsons JT, Cooper JA (2001) Cortactin promotes and stabilizes Arp2/3-induced actin filament network formation. Curr Biol 11: 370–374 [DOI] [PubMed] [Google Scholar]
- Weed SA, Karginov AV, Schafer DA, Weaver AM, Kinley AW, Cooper JA, Parsons JT (2000) Cortactin localization to sites of actin assembly in lamellipodia requires interactions with F-actin and the Arp2/3 complex. J Cell Biol 151: 29–40 [DOI] [PMC free article] [PubMed] [Google Scholar]
- Winter D, Lechler T, Li R (1999) Activation of the yeast Arp2/3 complex by Bee1p, a WASP-family protein. Curr Biol 9: 501–504 [DOI] [PubMed] [Google Scholar]
- Zalevsky J, Lempert L, Kranitz H, Mullins RD (2001) Different WASP family proteins stimulate different Arp2/3 complex-dependent actin-nucleating activities. Curr Biol 11: 1903–1913 [DOI] [PubMed] [Google Scholar]
- Zencheck WD, Xiao H, Nolen BJ, Angeletti RH, Pollard TD, Almo SC (2009) Nucleotide- and activator-dependent structural and dynamic changes of arp2/3 complex monitored by hydrogen/deuterium exchange and mass spectrometry. J Mol Biol 390: 414–427 [DOI] [PMC free article] [PubMed] [Google Scholar]
Associated Data
This section collects any data citations, data availability statements, or supplementary materials included in this article.