

Abstract
Adolescence places high demands on inter-personal interactions and, hence, on the extraction and processing of social cues. Here we assess longitudinally the development of brain activity within a network implicated in social cognition—the action observation network. We performed activation likelihood estimation meta-analyses to define regions of interest based upon the mature action observation network of adults. Using functional magnetic resonance imaging, we then examined developmental trajectories of functional brain activity within these brain regions. Using this approach, we reveal quadratic trajectories within a fronto-parietal network previously shown to demonstrate correlated morphological development.
Keywords: fMRI, development, adolescence, emotion, action observation
INTRODUCTION
Like other cognitive faculties, social cognition demonstrates a protracted maturational course from child- to adult-like levels. Adolescence, a developmental phase comprising the second decade of life, is a special case in point. Among other characteristics, this stage is characterized on one hand by heightened sensation-seeking, risk-taking and, from a perspective of adult society, reckless behaviour (Steinberg, 2008). On the other hand, adolescents display a shift from child-like impulsiveness to greater control of behavioural and emotional displays (Kuhn, 2009). If sensation-seeking and risk-taking serve to elevate an individual’s social standing, such proclivities might actually indicate emergence of social awareness not dissimilar to that seen in groups of adults. Similarly, maturation in social information processing likely motivates the reconciliation of these behaviours.
Adolescence is also typified by independence from those offering regulatory structure and guidance. Instead, adolescents spend an increasing amount of time with their peers. At a time when individuals begin thinking about others in a more abstract and multidimensional way (Eisenberg et al., 2009), the influence of peers on one’s own behaviour might be enhanced during adolescence. Indeed, Gardner & Steinberg (2005) found that the influence of peers on risky behaviour appears to be strongest during middle and late adolescence compared with adulthood. Given this heightened impact on behaviour during adolescence, one’s peers will contribute to the development of social representations (Eisenberg et al., 2009). The findings of Grosbras et al. (2007) may reveal a neural route by which peer interactions can influence social cognition; in this study, scores on a measure of resistance to peer influence (RPI) could be predicted by the inter-regional interactions in the blood oxygen level-dependent (BOLD) signal evoked by the observation of angry hand movements—that is, socially relevant cues—within a fronto-parietal and temporo-occipital network. Adolescents rating themselves as being able to resist peer influences showed greater functional connectivity across these brain regions, as compared with adolescents rating themselves as being more likely influenced by peers. The role of a fronto-parietal network in social cognition is particularly interesting when we consider the discovery of ‘mirror neurons’ within frontal area F5 (e.g. Rizzolatti et al., 1996; Fogassi et al., 1998; Molenbergs et al., 2009) and parietal area PF (Gallese et al., 1996; Fogassi et al., 2005) of the macaque brain. Mirror neurons respond in the same way to actions observed passively as they do during the execution of those same or similar actions. Moreover, human neuroimaging investigations (e.g. Iacoboni et al., 1999; Buccino et al., 2001, 2004b; Grosbras and Paus, 2006; Dinstein et al., 2007) have identified a similarly congruent response to both observed and executed actions within the ventral premotor cortex (PMC), inferior frontal gyrus (IFG; the caudal-most section—pars opercularis—a likely homologue of F5) and anterior inferior parietal lobule (IPL; the likely homologue of PF). We refer to this fronto-parietal network as the ‘action observation network’ (AON) herein.
The apparent ability of the AON to map observed actions onto the motor circuits responsible for their execution, causing them to ‘resonate’, has fascinated researchers since its discovery. Whether it subserves action understanding (Rizzolatti et al., 2001), imitation (Buccino et al., 2004a) or empathy (e.g. Rizzolatti, 2005; Grosbras and Paus, 2006), the AON appears to support social cognition (e.g. Gallese et al., 2004). In this light, the importance of achieving an understanding of its typical development seems obvious. But to our knowledge the only examination into its normative development has focused on its morphological properties. Paus et al. (2008) discovered that the degree of inter-regional correlations in cortical thickness between nodes of the AON was strongly associated with RPI scores in a group of typically developing adolescents (12–18 years of age); specifically, stronger correlations in cortical thickness between nodes of the network were related to higher RPI scores. The authors speculate that such parallel morphological development is a consequence of concurrent functional activity within such a heavily interconnected network. Yet to our knowledge there has been no developmental investigation of brain function within the AON, either cross-sectionally or longitudinally. The present study aims to fill this void by combining our current knowledge of structural brain development with age-related changes in functional activity within the AON. To achieve this aim, we draw on functional magnetic resonance imaging (fMRI) data collected in a sample of young adolescents, scanned three times between 10 and 13 years of age, participating in an action observation study first described by Grosbras and Paus (2006). Specifically, we examined longitudinal changes in functional brain activity evoked by the passive observation of actions performed with either hands or faces, and with or without an emotional undertone. This allowed us to examine how action observation-induced brain activity develops during early adolescence and to assess the degree to which affect modulates this brain activity during this developmental stage. In order to capture the functional development of the AON fully, it was necessary to quantify age-related changes in BOLD signal within each of its constituent nodes. Comparing measures of BOLD signal across ages is complicated by the dynamic nature of functional development, however. Age-related changes in activity can conceivably manifest as fragmentation or coalescence, expansion or contraction, and displacement. For this reason we decided to define as objectively as possible the adult AON and use the nodes of this mature network as regions of interest (ROIs) from which to examine age-related changes in fMRI response. To this end we performed an activation likelihood estimation (ALE) meta-analysis to identify the network of brain regions consistently engaged across a variety of action observation designs, with clusters of convergence between studies serving as ROIs. Although ALE meta-analyses already exist for face- and hand-action observation experiments, none were entirely suitable for our purposes. First, in an attempt to locate the putative human homologue of the macaque mirror neuron system, Molenberghs et al. (2009) explored convergence in results between studies combining passive action observation with execution and/or imitation. But focusing analyses only on overlapping activations inevitably neglects regions that are integral to action observation but exhibit no motor response; superior temporal sulcus (STS), for instance, consistently responds to biological motion (for a review, see Allison et al., 2000) but not to action execution. Second, Caspers et al. (2010) included a wide range of contrasts and interactions between action observation conditions, such as familiar vs unfamiliar actions (Calvo-Merino et al., 2006; Cross et al., 2009) and auditory or semantic inputs. Such variability makes the results both less sensitive and less specific for our purpose to delineate the fundamental nodes of the AON. We therefore conducted our own ALE analyses and the current article presents longitudinal changes in brain activity within the nodes of the AON identified from these meta-analyses.
METHODS
ALE meta-analysis
On 20 September 2009, we searched the Web of Science database (http://apps.isiknowledge.com) using the topical search terms action observation [AND] fMRI, and imitation [AND] fMRI. The term imitation was included because many investigations of imitation employ an action observation condition either as a localizer task or as a comparison against imitation. From the corpus of identified articles we considered only those (i) appearing in a peer-reviewed English journal before 2009, (ii) employing fMRI or positron emission tomography (PET) and (iii) reporting activation peaks in standardized 3D stereotaxic coordinates. To identify the most elementary of action observation experiments, the experimental condition had to include entirely passive observation of a human actor executing real or pantomimed, meaningful or meaningless, transitive or intransitive actions, performed with or without an emotional undertone. The control condition must have comprised (i) a resting state, (ii) the observation of a static biological effector, (iii) non-biological control motion or (iv) an image of the object towards which the action was directed. Only low-level contrasts between action observation and control conditions were considered—interactions or contrasts between action observation conditions or experiments investigating differences across populations (e.g. right- vs left-handers) were excluded. Lastly, given that ALE analyses estimate the likelihood of activation for every voxel within the brain, it is imperative that every voxel is equally represented in the analysis. To this end we included only experiments that report the results of unmasked whole-brain analyses; ROI-based analyses were excluded.
To ensure that we captured all brain regions responsive to the observation of hand and face actions we performed two ALE analyses: one for hand and one for face actions. Both analyses were performed entirely within BrainMap’s GingerALE (v2.0) application (www.brainmap.org/ale; Eickhoff et al., 2010). This version incorporates the empirically defined algorithm reported by Eickhoff et al. (2009), in which the permutations used to evaluate statistical significance of clusters of convergence are constrained by a grey matter mask. Thresholded cluster maps (min. cluster extent = 640 mm3; false discovery rate (FDR) q = 0.05) from the ‘hand’ and ‘face’ ALE analyses were first summed together, and then the resulting composite cluster map was finally delineated into anatomically discrete masks with the aid of the Automatic Anatomical Labelling (AAL) atlas (Tzourio-Mazoyer et al., 2002). The resulting masks then served as ROIs in subsequent analyses.
Adolescents
As part of an ongoing longitudinal study, a group of 65 adolescents (33 males; 57 right-handers) were scanned at three time points. To ensure our sample was initially pre-pubertal, the average age was 10 years (120.8 months; s.d. = 4.7 months; range = 113–129 months) at time one. At time two the average age was 11.5 years [139 months; s.d. = 4.9; range = 132–148; mean time interval = 18.8 (s.d. = 0.9) months] and at time three the average age was 13 years [157.8 months; s.d. = 5.5 months; age range = 150–174 months; time interval = 18.9 (s.d. = 2.3) months]. All adolescents reported English as their dominant language, and demonstrated a reading ability no more than 2 years below the grade-appropriate level (Woodcock et al., 2001). All were confirmed to be healthy, typically developing children reporting no history of neurological, psychiatric, developmental or medical disorders, and no evidence of behavioural problems as assessed by the Child Behaviour Checklist (Achenbach and Ruffle, 2000). None of the adolescents were exposed to maternal smoking or alcohol during pregnancy. All had normal or corrected-to-normal vision. Informed consent was obtained from the parents, together with assent from the adolescents themselves. The study conformed to the Helsinki Declaration and was approved by the Research Ethics Board of the Montreal Neurological Institute (MNI).
Pubertal Development Scale
Upon each visit, adolescents completed the Pubertal Development Scale (PDS; Peterson et al., 1988). This is a sex-specific eight-item self-report measure of physical development based upon Tanner stages (Marshall and Tanner, 1969, 1970). Adolescents answers questions concerning their physical development (e.g. growth in stature, breast development, pubic hair) and on the basis of their answers they are assigned to one of the five categories of pubertal status: (i) pre-pubertal, (ii) beginning puberty, (iii) mid-pubertal, (iv) advanced pubertal and (v) post-pubertal.
Stimuli
The experiment involved the passive viewing of video clips depicting neutral and angry hand and face actions, and control non-biological motion stimuli. A detailed explanation of the stimuli, the process behind their careful selection, and the timings by which they were presented is provided elsewhere (Grosbras and Paus, 2006). In brief, hand actions involved reaching, grasping and manipulating eight different objects in line with their intended purpose, with the right hand. Angry actions differed from their neutral counterparts only in their acceleration profile. Face actions involved angry expressions (e.g. frowning) or neutral gestures (e.g. nose twitching). The non-biological motion condition consisted of expansion and contraction-concentric circles at varying speeds and contrasts. Adolescents were instructed to attend closely to the video clips and told that they would be asked questions about the stimuli after the scan. After scanning we confirmed that the individual could recognize a subset of 10 hand and face stimuli from a set of 14 clips (four oddballs).
Imaging protocol
Scanning was performed on a 1.5T Siemens (Erlangen, Germany) Sonata scanner. A high-resolution T1-weighted structural image (matrix 256 × 256 × 160; 1 mm3 voxels) was first acquired for anatomical localization and co-registration with the functional time series. The time series consisted of 180 T2*-weighted, gradient-echo, echo-planar BOLD images (matrix 64 × 64 × 32; 4 mm3 voxels; TR = 3 s; TE = 50 ms) collected after the gradient had reached steady state. Each slice was oriented parallel to a line connecting the base of the cerebellum to the base of orbitofrontal cortex, covering the whole brain.
fMRI analysis
fMRI data processing was carried out using FMRIB’s software library (FSL, www.fmrib.ox.ac.uk/fsl). We excluded 19 adolescents (6 males) due to severe image distortions caused by braces at one or more times; for the remaining 46 adolescents we decided upon a lenient approach towards the removal of motion artefacts. Functional images were first corrected for head motion using motion correction and FSL's linear registration tool (MCFLIRT; Jenkinson et al., 2002). We then identified visually time series that demonstrated residual motion artefacts after motion correction. For the 18 scans highlighted in this manner, we utilized a second motion correction utility provided within FSL—fsl_motion_outliers. This tool first identifies time-points in which residual image intensity changes remaining after MCFLIRT exceed a threshold based on outliers in the sum of squared changes. Signal changes associated with these time-points are then treated as confounders within the subsequently applied general linear model (GLM), effectively removing these time-points from the analyses. An alternative to removing troublesome volumes, this approach accounts for any changes in signal and autocorrelation on either side of the affected volume and adjusts the degrees of freedom accordingly. Using this approach we were able to include all remaining adolescents (46; 27 males).
Using FMRI expert analysis tool (FEAT) v5.92, functional images were then spatially smoothed using a 8.0 mm full-width half-maximum Gaussian kernel and high pass filtered across time (Gaussian-weighted least-squares straight line fitting; σ = 50.0 s). Lastly, time-series were intensity normalized using grand-mean scaling of the entire 4D data set by a single multiplicative factor to minimize unspecific time effects. Time-series statistical analysis was carried out using FSL's improved linear modelling (FILM; Woolrich et al., 2001). Applying a GLM, for each individual at each time we computed z-statistic maps for four contrasts: (i) angry hands vs control; (ii) neutral hands vs control; (iii) angry faces vs control; and (iv) neutral faces vs control. Using FSL's linear registration tool (FLIRT; Jenkinson and Smith, 2001), all individual time-series were then registered to their corresponding brain-extracted high-resolution anatomical image. Anatomical images were then registered to the MNI-152 standard space template, and by combining both transformation matrices all individual z-statistic maps were then registered to this standard space template. It is the four registered z-statistic maps for each individual at each time upon which our ROI analyses were conducted.
Statistical analyses
To evaluate changes in brain function, for every subject at every time-point we extracted from within each ALE-defined ROI two measures of BOLD signal from each contrast: (i) the peak per cent BOLD signal change (%BSC) and (ii) the ratio of ‘active’ (z >1.7, held constant for all ROIs and all adolescents, at all times) to total number of voxels in a given ROI [active ratio (AR)]. The two measures were used as indices of activation magnitude and extent, respectively. Values beyond 3 s.d. from the mean in either measure were omitted.
Developmental trajectories were calculated using mixed-model regression, performed using SPSS 17.0, for %BSC and AR separately. This statistical technique accounts for longitudinal data sets with missing data and repeated measurements made at irregular time intervals. Using a significant (P < 0.05) decrease in the Akaike Information Criteria (AIC) value as an index of model improvement, we assessed the importance of all possible fixed effects, fixed-effect interactions and random effects by adding them to our base model in a step-up approach (West et al., 2007). This allowed us to ascertain the most parsimonious yet best-fitting model for each ROI individually, with both %BSC and AR as outcome measures. The addition of Age, Emotion, Sex, Age-by-Emotion and Age-by-Sex consistently improved model fit. On this basis, the final model took the form:
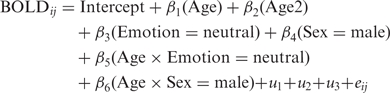 |
Age was represented in years and zero-centred, such that age 0 represented 113 months; Age represents the linear effect, while the second-order polynomial, Age2, represents any quadratic effect. Where a quadratic effect existed for a given ROI, both Age and Age2 were retained in the final model to ensure the models were well formulated (West et al., 2007). Where no Age2 effect was identified, only Age was retained in the applied model. In this equation, u1 represents a random intercept, u2 a random Age effect, and, where necessary, u3 a random Age2 effect, all nested within the individual. These allow each adolescent to have a unique starting position and trajectory that varies around the mean growth curve (West et al., 2007). The residual error term, eij, represents the usual, normally distributed residual error.
RESULTS
The present ‘hand’ ALE meta-analysis, consisting of 44 experiments, revealed bilateral clusters of convergence encompassing an occipito-temporo-parieto-frontal network, with a subcortical cluster surrounding the right amygdala. The ‘face’ ALE analysis, consisting of 14 experiments, revealed an occipito-temporo-frontal network, with subcortical clusters encompassing the left and right amygdalae. The results of both ALE analyses are presented in Figure 1, overlaid onto one another. Combining the clusters emerging from both ALE analyses and delineating them into meaningful anatomically discrete sections resulted in 20 ROIs. A summary of all ROIs and the results of the corresponding mixed-model regression are provided in Tables 1–8 for the hand- and face-related contrasts, respectively. Tables 1 and 5 and Tables 2 and 6 present the results for models in which %BSC and AR served as the outcome measure, respectively, and chronological age (CA) was modelled as the predictor variable. Figures 2 and 3 plot the coefficients from these mixed-model regressions for %BSC and AR, respectively.
Fig. 1.

Thresholded (q = 0.05) cluster maps (min. cluster extent = 640 mm3) from the ‘Face’ (blue) and ‘Hand ‘(red) ALE meta-analyses, overlaid onto one another (areas of overlap = white). Values represent the z-coordinate of the corresponding slice.
Table 1.
Coefficients from mixed-model regression on longitudinal measures of %BSC within ALE-derived ROIs with CA modelled as the time-varying covariate, for the contrast between angry and neutral hands vs control non-biological motion
| Peak % BSC | |||||||||||
|---|---|---|---|---|---|---|---|---|---|---|---|
| Label side | Size (mm3) | Centre of gravity |
Intercept (β0) | CA (β1) | CA2 (β2) | Emotion (angry) (β3) | Sex (females) (β4) | CA*Emotion (angry) (β5) | CA*Sex (females) (β6) | ||
| X | Y | Z | |||||||||
| Frontal | |||||||||||
| IFG | |||||||||||
| L | 2624 | −50 | 12 | 22 | 0.54 (0.08)** | <−0.001 (0.03) | 0.01 (0.06) | 0.04 (0.11) | 0.001 (0.02) | −0.05 (0.03) | |
| R | 7088 | 50 | 16 | 24 | 0.92 (0.11)** | −0.06 (0.03)* | 0.02 (0.07) | −0.27 (0.16) | 0.02 (0.03) | 0.02 (0.04) | |
| PMC | |||||||||||
| L | 10 184 | −40 | −2 | 45 | 0.89 (0.10)** | −0.02 (0.04) | 0.02 (0.07) | 0.06 (0.15) | 0.03 (0.03) | −0.05 (0.05) | |
| R | 8592 | 42 | 2 | 44 | 0.83 (0.09)** | −0.01 (0.04)* | 0.15 (0.08)* | 0.001 (0.13) | −0.04 (0.03) | −0.06 (0.05) | |
| Temporal | |||||||||||
| ITG/MTG/STG | |||||||||||
| L | 12 552 | −47 | −64 | 1 | 2.03 (0.20)** | 0.02 (0.06) | 0.15 (0.12) | 0.11 (0.30) | −0.05 (0.05) | −0.17 (0.09) | |
| R | 17 904 | 49 | −57 | 1 | 1.57 (0.16)** | −0.03 (0.06)* | 0.17 (0.10) | 0.05 (0.23) | −0.03 (0.04) | −0.10 (0.08) | |
| Fusiform | |||||||||||
| L | 2992 | −40 | −56 | −18 | 1.26 (0.13)** | −0.04 (0.04) | −0.04 (0.08) | −0.17 (0.19) | −0.02 (0.3) | −0.02 (0.06) | |
| R | 3056 | 40 | −54 | −18 | 1.03 (0.13)** | −0.003 (0.05) | 0.17 (0.08)* | −0.08 (0.19) | −0.07 (0.03)* | −0.05 (0.07) | |
| Occipital | |||||||||||
| IOGa | |||||||||||
| L | 1040 | −16 | −83 | −12 | 0.75 (0.08)** | −0.04 (0.03)* | −0.17 (0.06)** | −0.10 (0.12) | 0.03 (0.03) | −0.06 (0.04) | |
| IOGb | |||||||||||
| L | 816 | −35 | −87 | −4 | 0.87 (0.10)** | −0.02 (0.03)* | −0.05 (0.06) | −0.03 (0.14) | −0.01 (0.03) | −0.04 (0.04) | |
| Striate | |||||||||||
| L | 1032 | −7 | −95 | 3 | 0.33 (0.07)** | −0.01 (0.03) | 0.03 (0.05) | −0.09 (0.11) | −0.01 (0.02) | −0.01 (0.04) | |
| R | 696 | 7 | −79 | −8 | 0.48 (0.10)** | −0.25 (0.06)** | 0.05 (0.02)** | 0.04 (0.06) | −0.07 (0.12) | −0.01 (0.01) | −0.01 (0.01) |
| Parietal | |||||||||||
| IPL | |||||||||||
| L | 11 344 | −42 | −41 | 47 | 0.89 (0.10)** | 0.01 (0.04) | 0.15 (0.07)* | −0.05 (0.14) | −0.02 (0.03) | 0.01 (0.06) | |
| R | 4832 | 37 | −42 | 49 | 0.44 (0.06)** | 0.01 (0.02) | 0.12 (0.05)* | −0.06 (0.09) | −0.03 (0.02) | 0.01 (0.03) | |
| SMG/AG | |||||||||||
| L | 1728 | −58 | −28 | 34 | 0.56 (0.08)** | 0.13 (0.06)* | −0.03 (0.01)* | 0.09 (0.04)* | −0.04 (0.09) | 0.001 (0.01) | −0.01 (0.01) |
| R | 1592 | 50 | −30 | 42 | 0.36 (0.07)** | 0.01 (0.02) | 0.15 (0.05)** | −0.08 (0.10) | −0.05 (0.02)* | <0.001 (0.03) | |
| SPL | |||||||||||
| L | 4344 | −28 | −56 | 56 | 1.54 (0.16)** | −0.05 (0.06) | 0.02 (0.12) | −0.29 (0.23) | −0.02 (0.05) | 0.05 (0.08) | |
| R | 4456 | 26 | −56 | 60 | 1.40 (0.18)** | −0.16 (0.06)* | 0.22 (0.13) | −0.64 (0.26)* | −0.06 (0.05) | 0.20 (0.08)* | |
| Subcortical | |||||||||||
| Amygdala | |||||||||||
| L | 1240 | −21 | −7 | −10 | 0.36 (0.05)** | −0.01 (0.02) | <0.001 (0.05) | 0.02 (0.07) | 0.001 (0.02) | −0.04 (0.03) | |
| R | 1584 | 19 | −10 | −11 | 0.43 (0.05)** | −0.01 (0.02)* | 0.08 (0.05) | −0.06 (0.08) | −0.03 (0.02) | −0.02 (0.03) | |
To avoid over-parameterization, SPSS assigns one level of a factor as a reference against which all other levels are compared. Coefficients related to the effect of sex are given relative to males; those related to the effect of emotion are given relative to the neutral condition. ROIs that were not identified by the ‘hand’ ALE analysis are greyed out. *P < 0.05; **P < 0.01. CA, chronological age; IFG, inferior frontal gyrus; PMC, premotor cortex; ITG, inferior temporal gyrus, MTG, middle temporal gyrus; STG, superior temporal gyrus; IOG, inferior occipital gyrus; IPL, inferior parietal lobule; SMG, supramarginal gyrus; AG, angular gyrus; SPL, superior parietal lobule; L, left hemisphere; R, right hemisphere.
Table 2.
Coefficients from mixed-model regression on longitudinal measures of the ratio of active to total voxels (AR) within ALE-derived ROIs with CA modelled as the time-varying covariate, for the contrast between angry and neutral hands vs control non-biological motion
| AR | |||||||
|---|---|---|---|---|---|---|---|
| Label side | Intercept (β0) | CA (β1) | CA2 (β2) | Emotion (angry) (β3) | Sex (females) (β4) | CA*Emotion (angry) (β5) | CA*Sex (females) (β6) |
| Frontal | |||||||
| IFG | |||||||
| L | 0.20 (0.04)** | −0.01(0.01) | 0.01 (0.04) | −0.02 (0.05) | −0.004 (0.02) | −0.01 (0.02) | |
| R | 0.27 (0.06)** | −0.02 (0.02) | 0.07 (0.04) | −0.04 (0.08) | −0.01 (0.02) | 0.01 (0.03) | |
| PMC | |||||||
| L | 0.26 (0.05)** | −0.01 (0.02) | −0.01 (0.03) | 0.06 (0.07) | 0.01 (0.03) | −0.02 (0.02) | |
| R | 0.23 (0.05)** | −0.02 (0.02)* | 0.08 (0.03)* | 0.2 (0.08) | −0.02 (0.01) | −0.01 (0.03) | |
| Temporal | |||||||
| ITG/MTG/STG | |||||||
| L | 0.63 (0.04)** | −0.01 (0.02)* | 0.04 (0.03) | −0.05 (0.06) | −0.02 (0.01) | −0.01 (0.02) | |
| R | 0.49 (0.05)** | −0.01 (0.02) | 0.05 (0.03) | −0.05 (0.07) | −0.01 (0.01) | −0.01 (0.02) | |
| Fusiform | |||||||
| L | 0.43 (0.06)** | −0.01 (0.02) | 0.02 (0.04) | −0.06 (0.08) | −0.03 (0.02) | 0.001(0.03) | |
| R | 0.41 (0.05)** | −0.01 (0.02)* | 0.05 (0.04) | 0.02 (0.08) | −0.03 (0.02) | −0.02 (0.03) | |
| Occipital | |||||||
| IOGa | |||||||
| L | 0.37 (0.06)** | −0.04 (0.02)* | −0.09 (0.05)* | −0.06 (0.09) | 0.02 (0.02) | −0.01 (0.03) | |
| IOGb | |||||||
| L | 0.54 (0.07)** | −0.004 (0.02)* | −0.06 (0.05) | −0.05 (0.10) | −0.01 (0.02) | −0.04 (0.02) | |
| Striate | |||||||
| L | 0.09 (0.03)** | −0.02 (0.01) | −0.02 (0.02) | −0.01 (0.03) | 0.01 (0.01) | 0.01 (0.01) | |
| R | 0.14 (0.03)** | −0.06 (0.02)** | 0.01 (0.01)* | 0.002 (0.02) | −0.07 (0.04) | <0.001 (0.002) | 0.002 (0.003) |
| Parietal | |||||||
| IPL | |||||||
| L | 0.31 (0.05)** | −0.01 (0.02) | 0.10 (0.03)** | 0.02 (0.08) | −0.02 (0.01) | −0.01 (0.03) | |
| R | 0.11 (0.04)** | −0.001 (0.01) | 0.08 (0.03)** | 0.02 (0.06) | −0.02 (0.01) | −0.003 (0.02) | |
| SMG/AG | |||||||
| L | 0.37 (0.07)** | −0.01 (0.02) | 0.09 (0.05) | 0.01 (0.09) | 0.01 (0.02) | −0.01 (0.03) | |
| R | 0.08 (0.05)** | 0.01 (0.01)* | 0.09 (0.03)** | 0.04 (0.07) | −0.03 (0.01)* | −0.02 (0.02) | |
| SPL | |||||||
| L | 0.50 (0.06)** | −0.02 (0.02) | 0.08 (0.04) | −0.04 (0.08) | −0.02 (0.02) | 0.01 (00.3) | |
| R | 0.22 (0.05)** | −0.02 (0.02) | 0.07 (0.04)* | −0.06 (0.08) | −0.02 (0.01) | 0.03 (0.02) | |
| Subcortical | |||||||
| Amygdala | |||||||
| L | 0.12 (0.04)** | 0.002 (0.02) | 0.03 (0.04) | 0.06 (0.06) | −0.02 (0.02) | −0.02 (0.02) | |
| R | 0.18 (0.04)** | −0.09 (0.03)** | 0.02 (0.01)* | 0.04 (0.03) | 0.04 (0.04) | −0.01 (0.003) | 0.001 (0.003) |
To avoid over-parameterization, SPSS assigns one level of a factor as a reference against which all other levels are compared. Coefficients related to the effect of sex are given relative to males; those related to the effect of emotion are given relative to the neutral condition. ROIs that were not identified by the ‘hand’ ALE analysis are greyed out. *P < 0.05; **P < 0.01. SPL: superior parietal lobule. See legend to Table 1 for abbreviations.
Table 3.
Coefficients from mixed-model regression on longitudinal measures of %BSC within ALE-derived ROIs with BA modelled as the time-varying covariate, for the between contrast angry and neutral hands vs control non-biological motion
| Peak % BSC | |||||||
|---|---|---|---|---|---|---|---|
| Label side | Intercept (β0) | BA (β1) | BA2 (β2) | Emotion (angry) (β3) | Sex (females) (β4) | BA*Emotion (angry) (β5) | BA*Sex (females) (β6) |
| Frontal | |||||||
| IFG | |||||||
| L | 0.57 (0.09)** | −0.02 (0.05) | 0.07 (0.10) | −0.19 (0.12) | −0.03 (0.05) | 0.09 (0.07) | |
| R | 0.55 (0.16)** | 0.13 (0.08) | 0.15 (0.08) | 0.18 (0.25) | −0.06 (0.05) | −0.20 (0.12) | |
| PMC | |||||||
| L | 0.86 (0.12)** | −0.01 (0.06) | 0.13 (0.11) | −0.05 (0.18) | −0.03 (0.06) | 0.03 (0.09) | |
| R | 0.71 (0.16)** | 0.04 (0.08) | 0.13 (0.12) | −0.07 (0.25) | −0.04 (0.06) | −0.01 (0.12) | |
| Temporal | |||||||
| ITG/MTG/STG | |||||||
| L | 1.89 (0.21)** | 0.10 (0.12) | 0.13 (0.18) | 0.01 (0.32) | −0.05 (0.10) | −0.12 (0.17) | |
| R | 1.35 (0.23)** | 0.09 (0.12) | 0.04 (0.16) | 0.51 (0.37) | 0.03 (0.09) | −0.36 (0.18) | |
| Fusiform | |||||||
| L | 1.16 (0.15)** | −0.02 (0.08) | 0.08 (0.13) | −0.25 (0.23) | −0.09 (0.07) | 0.06 (0.12) | |
| R | 0.92 (0.21)** | 0.04 (0.10) | 0.09 (0.11) | 0.21 (0.34) | −0.05 (0.06) | −0.15 (0.16) | |
| Occipital | |||||||
| IOGa | |||||||
| L | 0.73 (0.12)** | −0.28 (0.13)* | 0.13 (0.04)* | −0.05 (0.06) | −0.15 (0.12) | −0.01 (0.01) | −0.03 (0.03) |
| IOGb | |||||||
| L | 0.76 (0.12)** | 0.04 (0.07) | −0.05 (0.09) | −0.32 (0.18) | −0.01 (0.05) | 0.07 (0.10) | |
| Striate | |||||||
| L | 0.23 (0.10)** | 0.04 (0.06) | 0.01 (0.07) | 0.01 (0.15) | 0.01 (0.04) | −0.07 (0.09) | |
| R | 0.60 (0.16)** | −0.41 (0.16)* | 0.11 (0.05)* | 0.10 (0.07) | −0.29 (0.15) | −0.03 (0.02) | 0.06 (0.03) |
| Parietal | |||||||
| IPL | |||||||
| L | 0.92 (0.13)** | −0.003 (0.06) | 0.12 (0.11) | 0.05 (0.20) | −0.01 (0.06) | −0.05 (0.10) | |
| R | 0.43 (0.10)** | 0.01 (0.05) | 0.14 (0.07)* | −0.02 (0.15) | −0.04 (0.04) | 0.002 (0.07) | |
| SMG/AG | |||||||
| L | 0.71 (0.12)** | −0.03 (0.06) | 0.12 (0.08) | 0.05 (0.19) | −0.01 (0.04) | −0.06 (0.10) | |
| R | 0.21 (0.11)* | 0.20 (0.11) | −0.06 (0.03)* | 0.07 (0.05) | −0.03 (0.11) | −0.004 (0.01) | −0.01 (0.02) |
| SPL | |||||||
| L | 1.34 (0.24)** | 0.03 (0.13) | 0.08 (0.17) | −0.20 (0.37) | −0.05 (0.09) | 0.03 (0.20) | |
| R | 1.17 (0.25)** | −0.07 (0.12) | 0.13 (0.21) | −0.35 (0.37) | −0.03 (0.11) | 0.11 (0.18) | |
| Subcortical | |||||||
| Amygdala | |||||||
| L | 0.32 (0.07)** | 0.02 (0.04) | −0.04 (0.07) | −0.02 (0.09) | 0.03 (0.04) | −0.02 (0.05) | |
| R | 0.39 (0.05)** | −0.002 (0.03) | −0.04 (0.06) | −0.08 (0.07) | 0.03 (0.03) | −0.01 (0.04) | |
To avoid over-parameterization, SPSS assigns one level of a factor as a reference against which all other levels are compared. Coefficients related to the effect of sex are given relative to males; those related to the effect of emotion are given relative to the neutral condition. ROIs that were not identified by the ‘hand’ ALE analysis are greyed out. *P < 0.05; **P < 0.01. SPL: superior parietal lobule. See legend to Table 1 for abbreviations.
Table 4.
Coefficients from mixed-model regression on longitudinal measures of the ratio of active to total voxels (AR) within ALE-derived ROIs with BA modelled as the time-varying covariate, for the contrast between angry and neutral hands vs control non-biological motion
| AR | |||||||
|---|---|---|---|---|---|---|---|
| Label side | Intercept (β0) | BA (β1) | BA2 (β2) | Emotion (angry) (β3) | Sex (females) (β4) | BA*Emotion (angry) (β5) | BA*Sex (females) (β6) |
| Frontal | |||||||
| IFG | |||||||
| L | 0.15 (0.06)** | 0.02 (0.03) | 0.04 (0.05) | 0.01 (0.08) | −0.02 (0.03) | −0.03 (0.04) | |
| R | 0.38 (0.10)** | −0.30 (0.10)** | 0.11 (0.03)** | 0.11 (0.04)** | −0.08 (0.09) | −0.02 (0.01) | 0.01 (0.02) |
| PMC | |||||||
| L | 0.24 (0.06)** | 0.01 (0.03) | 0.01 (0.05) | −0.04 (0.09) | −0.001 (0.03) | 0.02 (0.04) | |
| R | 0.33 (0.08)** | −0.20 (0.09)* | 0.07 (0.03)* | 0.06 (0.03) | −0.06 (0.08) | −0.01 (0.01) | 0.01 (0.02) |
| Temporal | |||||||
| ITG/MTG/STG | |||||||
| L | 0.56 (0.06)** | 0.03 (0.03) | 0.05 (0.05) | 0.001 (0.08) | −0.03 (0.03) | −0.05 (0.04) | |
| R | 0.44 (0.07)** | 0.02 (0.03) | 0.04 (0.05) | −0.09 (0.10) | −0.02 (0.03) | 0.01 (0.05) | |
| Fusiform | |||||||
| L | 0.44 (0.09)** | −0.01 (0.04) | −0.08 (0.06) | −0.03 (0.13) | 0.03 (0.03) | −0.02 (0.07) | |
| R | 0.55 (0.10)** | −0.22 (0.10)* | 0.06 (0.03)* | 0.02 (0.04) | −0.10 (0.09) | −0.01 (0.01) | 0.03 (0.02) |
| Occipital | |||||||
| IOGa | |||||||
| L | 0.27 (0.09)** | 0.01 (0.04) | −0.12 (0.07) | −0.03 (0.12) | 0.04 (0.04) | −0.04 (0.06) | |
| IOGb | |||||||
| L | 0.49 (0.10)** | 0.02 (0.04) | −0.10 (0.08) | −0.03 (0.13) | 0.02 (0.04) | −0.06 (0.06) | |
| Striate | |||||||
| L | 0.02 (0.04)** | 0.03 (0.02) | 0.01 (0.03) | 0.10 (0.05)* | −0.01 (0.02) | −0.05 (0.02)* | |
| R | – | – | – | – | – | – | – |
| Parietal | |||||||
| IPL | |||||||
| L | 0.31 (0.08)** | 0.003 (0.04) | 0.09 (0.05) | −0.04 (0.11) | −0.02 (0.03) | 0.01 (0.05) | |
| R | 0.11 (0.06)** | >−0.001 (0.03) | 0.04 (0.04) | 0.09 (0.08) | 0.004 (0.02) | −0.05 (0.04) | |
| SMG/AG | |||||||
| L | 0.19 (0.10)** | 0.27 (0.10)** | −0.09 (0.03)** | 0.12 (0.05)* | −0.05 (0.10) | −0.004 (0.01) | 0.004 (0.02) |
| R | 0.05 (0.06)* | 0.02 (0.03) | 0.08 (0.05) | 0.05 (0.09) | −0.03 (0.03) | −0.02 (0.05) | |
| SPL | |||||||
| L | 0.43 (0.10)** | 0.01 (0.05) | 0.09 (0.06) | 0.03 (0.15) | −0.03 (0.03) | −0.04 (0.07) | |
| R | 0.20 (0.08) | −0.01 (0.04) | 0.02 (0.05) | 0.08 (0.11) | 0.001 (0.03) | −0.05 (0.06) | |
| Subcortical | |||||||
| Amygdala | |||||||
| L | 0.17 (0.05)** | −0.03 (0.03) | −0.10 (0.06) | 0.03 (0.07) | 0.05 (0.03) | −0.001 (0.04) | |
| R | 0.20 (0.05)** | −0.05 (0.03) | −0.05 (0.05) | −0.01 (0.06) | 0.03 (0.03) | 0.04 (0.03) | |
To avoid over-parameterization, SPSS assigns one level of a factor as a reference against which all other levels are compared. Coefficients related to the effect of sex are given relative to males; those related to the effect of emotion are given relative to the neutral condition. ROIs that were not identified by the ‘hand’ ALE analysis are greyed out. *P < 0.05; **P < 0.01; -: non-convergence of mixed-models; SPL: superior parietal lobule. See legend to Table 1 for abbreviations.
Table 5.
Coefficients from mixed-model regression on longitudinal measures of %BSC within ALE-derived ROIs with CA modelled as the time-varying covariate, for the contrast between angry and neutral faces vs control non-biological motion
| Peak % BSC | |||||||||||
|---|---|---|---|---|---|---|---|---|---|---|---|
| Label side | Size (mm3) | Centre of gravity |
Intercept (β0) | CA (β1) | CA 2 (β2) | Emotion (Angry) (β3) | Sex (Females) (β4) | CA*Emotion (Angry) (β5) | CA*Sex (Females) (β6) | ||
| X | Y | Z | |||||||||
| Frontal | |||||||||||
| IFG | |||||||||||
| L | 2624 | −50 | 12 | 22 | 0.66 (0.08)** | −0.03 (0.03) | −0.25 (0.06)** | 0.04 (0.11) | 0.02 (0.03) | −0.01 (0.04) | |
| R | 7088 | 50 | 16 | 24 | 1.04 (0.09)** | −0.06 (0.0)** | −0.12 (0.07) | −0.13 (0.13) | −0.01 (0.03) | 0.02 (0.04) | |
| PMC | |||||||||||
| L | 10 184 | −40 | −2 | 45 | 0.80 (0.07)** | −0.04 (0.02) | −0.29 (0.07)** | −0.07 (0.10) | 0.03 (0.03) | 0.03 (0.03) | |
| R | 8592 | 42 | 2 | 44 | 1.10 (0.10)** | −0.07 (0.03)** | −0.18 (0.09)* | 0.01 (0.14) | 0.01 (0.04) | −0.02 (0.04) | |
| Temporal | |||||||||||
| ITG/MTG/STG | |||||||||||
| L | 12 552 | −47 | −64 | 1 | 1.45 (0.12)** | −0.10 (0.04)* | −0.35 (0.11)* | −0.15 (0.17) | 0.03 (0.04) | 0.06 (0.04) | |
| R | 17 904 | 49 | −57 | 1 | 1.47 (0.12)** | −0.04 (0.04) | −0.18 (0.11) | −0.05 (0.16) | 0.01 (0.04) | 0.02 (0.05) | |
| Fusiform | |||||||||||
| L | 2992 | −40 | −56 | −18 | 1.10 (0.13)** | −0.03 (0.04) | −0.16 (0.09) | −0.01 (0.19) | 0.05 (0.04) | −0.03 (0.05) | |
| R | 3056 | 40 | −54 | −18 | 1.11 (0.11)** | 0.01 (0.03) | −0.27 (0.10)** | 0.18 (0.14) | 0.08 (0.04) | −0.08 (0.04) | |
| Occipital | |||||||||||
| IOGa | |||||||||||
| L | 1040 | −16 | −83 | −12 | 0.30 (0.07)** | −0.02 (0.03) | 0.08 (0.06) | −0.12 (0.1) | 0.04 (0.03) | −0.01 (0.4) | |
| IOGb | |||||||||||
| L | 816 | −35 | −87 | −4 | 0.60 (0.12)** | −0.03 (0.03) | −0.11 (0.07) | −0.18 (0.17) | 0.02 (0.03) | 0.07 (0.04) | |
| Striate | |||||||||||
| L | 1032 | −7 | −95 | 3 | 0.15 (0.08)** | 0.02 (0.03) | 0.13 (0.07) | −0.03 (0.11) | −0.02 (0.03) | −0.02 (0.04) | |
| R | 696 | 7 | −79 | −8 | 0.25 (0.10)** | −0.03 (0.03) | 0.05 (0.09) | −0.04 (0.14) | 0.01 (0.03) | −0.03 (0.04) | |
| Parietal | |||||||||||
| IPL | |||||||||||
| L | 11 344 | −42 | −41 | 47 | 0.51 (0.06)** | −0.05 (0.02) | −0.09 (0.05) | −0.10 (0.08) | 0.03 (0.02) | 0.02 (0.03) | |
| R | 4832 | 37 | −42 | 49 | 0.33 (0.05)** | −0.01 (0.02) | −0.05 (0.04) | −0.01 (0.08) | 0.01 (0.02) | −0.03 (0.02) | |
| SMG/AG | |||||||||||
| L | 1728 | −58 | −28 | 34 | 0.20 (0.06)** | 0.09 (0.04)* | −0.02 (0.01)* | −0.09 (0.04)* | −0.04 (0.06) | 0.001 (0.01) | 0.002 (0.01) |
| R | 1592 | 50 | −30 | 42 | 0.21 (0.05)** | −0.01 (0.02) | −0.03(0.05) | −0.06 (0.07) | 0.004 (0.02) | −0.01 (0.02) | |
| SPL | |||||||||||
| L | 4344 | −28 | −56 | 56 | 0.59 (0.10)** | −0.18 (0.08)* | 0.03 (0.02)* | 0.03 (0.07) | −0.12 (0.11) | −0.004 (0.01) | 0.01 (0.01) |
| R | 4456 | 26 | −56 | 60 | 0.60 (0.12)** | −0.03 (0.04) | 0.01 (0.14) | −0.26 (0.16) | −0.02 (0.04) | 0.01 (0.05) | |
| Subcortical | |||||||||||
| Amygdala | |||||||||||
| L | 1240 | −21 | −7 | −10 | 0.59 (0.07)** | −0.06 (0.02)** | 0.02 (0.05) | −0.06 (0.09) | 0.03 (0.02) | −0.002 (0.03) | |
| R | 1584 | 19 | −10 | −11 | 0.68 (0.08)** | −0.04 (0.03)* | 0.05 (0.06) | −0.05 (0.11) | 0.01 (0.02) | −0.02 (0.04) | |
To avoid over-parameterization, SPSS assigns one level of a factor as a reference against which all other levels are compared. Coefficients related to the effect of sex are given relative to males; those related to the effect of emotion are given relative to the neutral condition. ROIs that were not identified by the ‘face’ ALE analysis are greyed out. *P < 0.05; **P < 0.01; SPL: superior parietal lobule. See legend to Table 1 for abbreviations.
Table 6.
Coefficients from mixed-model regression on longitudinal measures of the ratio of active to total voxels (AR) within ALE-derived ROIs with CA modelled as the time-varying covariate, for the contrast between angry and neutral faces vs control non-biological motion
| AR | |||||||
|---|---|---|---|---|---|---|---|
| Label side | Intercept (β0) | CA (β1) | CA2 (β2) | Emotion (angry) (β3) | Sex (females) (β4) | CA*Emotion (angry) (β5) | CA*Sex (females) (β6) |
| Frontal | |||||||
| IFG | |||||||
| L | 0.35 (0.04)** | −0.04 (0.02) | −0.21 (0.04)** | −0.04 (0.05) | 0.02 (0.02) | 0.03 (0.02) | |
| R | 0.41 (0.05)** | −0.03 (0.02)* | −0.15 (0.05)** | −0.03 (0.07) | 0.02 (0.02) | 0.01 (0.02) | |
| PMC | |||||||
| L | 0.14 (0.02)** | −0.01 (0.01) | −0.08 (0.02)** | 0.01 (0.02) | 0.01 (0.01) | 0.001 (0.001) | |
| R | 0.27 (0.04)** | −0.02 (0.01)* | −0.08 (0.03)* | 0.01 (0.05) | 0.01 (0.01) | −0.003 (0.02) | |
| Temporal | |||||||
| ITG/MTG/STG | |||||||
| L | 0.19 (0.03)** | 0.07 (0.02)** | −0.02 (0.005)** | −0.10 (0.02)** | 0.004 (0.04) | −0.001 (0.002) | 0.004 (0.003) |
| R | 0.37 (0.04)** | −0.01 (0.01) | −0.09 (0.03)** | −0.04 (0.05) | −0.01 (0.01) | 0.03 (0.02) | |
| Fusiform | |||||||
| L | 0.32 (0.05)** | −0.01 (0.02) | −0.07 (0.04) | −0.02 (0.05) | 0.02 (0.02) | 0.02 (0.02) | |
| R | 0.36 (0.05)** | 0.01 (0.02) | −0.07 (0.04) | 0.08 (0.07) | 0.02 (0.02) | −0.01 (0.03) | |
| Occipital | |||||||
| IOGa | |||||||
| L | – | – | – | – | – | – | – |
| IOGb | |||||||
| L | 0.23 (0.05)** | −0.001 (0.01) | −0.08 (0.04)* | −0.01 (0.08) | 0.02 (0.02) | 0.01 (0.02) | |
| Striate | |||||||
| L | 0.05 (0.02)** | −0.001 (0.01) | 0.06 (0.02)* | −0.03 (0.03) | −0.02 (0.01) | >0.001 (0.01) | |
| R | – | – | – | – | – | – | – |
| Parietal | |||||||
| IPL | |||||||
| L | 0.003 (0.02) | 0.02 (0.01)* | −0.01 (0.002)* | 0.01 (0.01) | 0.02 (0.01) | >0.001 (0.001) | −0.001 (0.001) |
| R | 0.02 (0.01)** | −0.001 (0.004) | −0.003 (0.01) | 0.02 (0.01) | 0.001 (0.004) | −0.003 (0.01) | |
| SMG/AG | |||||||
| L | – | – | – | – | – | – | – |
| R | – | – | – | – | – | – | – |
| SPL | |||||||
| L | 0.02 (0.01)** | −0.004 (0.002) | −0.01 (0.01) | 0.01 (0.01) | 0.003 (0.003) | −0.004 (0.003) | |
| R | 0.02 (0.01)** | −0.01 (0.003) | −0.002 (0.01) | −0.002 (0.003) | 0.002 (0.003) | 0.002 (0.004) | |
| Subcortical | |||||||
| Amygdala | |||||||
| L | 0.38 (0.06)** | −0.05 (0.02)* | 0.03 (0.05) | −0.06 (0.09) | 0.01 (0.02) | 0.03 (0.03) | |
| R | 0.43 (0.06)** | −0.05 (0.02) | 0.04 (0.06) | −0.02 (0.09) | 0.01 (0.02) | 0.03 (0.03) | |
To avoid over-parameterization, SPSS assigns one level of a factor as a reference against which all other levels are compared. Coefficients related to the effect of sex are given relative to males; those related to the effect of emotion are given relative to the neutral condition. ROIs that were not identified by the ‘face’ ALE analysis are greyed out. *P < 0.05; **P < 0.01; –: non-convergence of mixed-models; SPL: superior parietal lobule. See legend to Table 1 for abbreviations.
Table 7.
Coefficients from mixed-model regression on longitudinal measures of %BSC within ALE-derived ROIs with BA modelled as the time-varying covariate, for the contrast between angry and neutral faces vs control non-biological motion
| Peak % BSC | |||||||
|---|---|---|---|---|---|---|---|
| Label side | Intercept (β0) | BA (β1) | BA 2 (β2) | Emotion (Angry) (β3) | Sex (Females) (β4) | BA*Emotion (Angry) (β5) | BA*Sex (Females) (β6) |
| Frontal | |||||||
| IFG | |||||||
| L | 0.71 (0.08)** | −0.06 (0.04) | −0.29 (0.08)** | −0.15 (0.10) | 0.04 (0.05) | 0.10 (0.06) | |
| R | 0.81 (0.12)** | 0.06 (0.07) | −0.11 (0.10) | 0.07 (0.19) | −0.02 (0.06) | −0.09 (0.10) | |
| PMC | |||||||
| L | 0.87 (0.09)** | −0.10 (0.05) | −0.25 (0.09)** | −0.21 (0.13) | 0.01 (0.05) | 0.12 (0.07) | |
| R | 0.91 (0.13) | 0.02 (0.07) | −0.20 (0.13) | 0.02 (0.19) | 0.02 (0.07) | −0.02 (0.10) | |
| Temporal | |||||||
| ITG/MTG/STG | |||||||
| L | 1.22 (0.16)** | 0.01 (0.08) | −0.26 (0.15) | 0.12 (0.24) | −0.02 (0.08) | −0.06 (0.11) | |
| R | 1.28 (0.15)** | 0.04 (0.08) | −0.23 (0.14) | 0.23 (0.23) | 0.04 (0.08) | −0.11 (0.12) | |
| Fusiform | |||||||
| L | 1.24 (0.14)** | −0.13 (0.08) | −0.21 (0.14) | −0.24 (0.20) | −0.10 (0.07) | 0.11 (0.12) | |
| R | 0.93 (0.16)** | 0.12 (0.09) | 0.003 (0.13) | 0.31 (0.24) | −0.08 (0.07) | −0.15 (0.14) | |
| Occipital | |||||||
| IOGa | |||||||
| L | 0.13 (0.10) | 0.10 (0.06) | −0.001 (0.09) | >−0.001 (0.14) | 0.01 (0.05) | −0.10 (0.09) | |
| IOGb | |||||||
| L | 0.53 (0.15)** | −0.01 (0.08) | −0.14 (0.10) | 0.06 (0.24) | 0.03 (0.06) | −0.03 (0.12) | |
| Striate | |||||||
| L | 0.10 (0.11) | 0.06 (0.06) | 0.10 (0.10) | −0.06 (0.16) | −0.002 (0.05) | −0.02 (0.08) | |
| R | 0.18 (0.11) | −0.01 (0.07) | 0.11 (0.13) | −0.20 (0.15) | −0.02 (0.07) | 0.06 (0.09) | |
| Parietal | |||||||
| IPL | |||||||
| L | 0.46 (0.08)** | −0.04 (0.04) | −0.08 (0.08) | −0.18 (0.11) | 0.02 (0.04) | 0.07 (0.06) | |
| R | 0.40 (0.08)** | −0.06 (0.04) | −0.10 (0.06) | −0.06 (0.12) | 0.05 (0.03) | 0.01 (0.06) | |
| SMG/AG | |||||||
| L | 0.38 (0.07)** | −0.07 (0.04) | −0.16 (0.08)* | −0.05 (0.10) | 0.05 (0.04) | 0.01 (0.05) | |
| R | 0.25 (0.06)** | −0.04 (0.03) | 0.01 (0.07) | −0.18 (0.08)* | −0.02 (0.04) | 0.07 (0.04) | |
| SPL | |||||||
| L | 0.45 (0.13)** | −0.02 (0.07) | −0.004 (0.13) | −0.30 (0.18) | 0.01 (0.07) | 0.12 (0.09) | |
| R | 0.56 (0.15)** | −0.02 (0.07) | 0.06 (0.15) | −0.43 (0.20)* | −0.05 (0.08) | 0.12 (0.11) | |
| Subcortical | |||||||
| Amygdala | |||||||
| L | 0.44 (0.09)** | 0.02 (0.05) | 0.02 (0.07) | 0.05 (0.13) | 0.03 (0.04) | −0.06 (0.07) | |
| R | 0.56 (0.08)** | 0.01 (0.04) | 0.12 (0.09) | 0.04 (0.12) | −0.02 (0.05) | −0.06 (0.06) | |
To avoid over-parameterization, SPSS assigns one level of a factor as a reference against which all other levels are compared. Coefficients related to the effect of sex are given relative to males; those related to the effect of emotion are given relative to the neutral condition. ROIs that were not identified by the ‘face’ ALE analysis are greyed out. *P < 0.05; **P < 0.01; SPL: superior parietal lobule. See legend to Table 1 for abbreviations.
Table 8.
Coefficients from mixed-model regression on longitudinal measures of the ratio of active to total voxels (AR) within ALE-derived ROIs with BA modelled as the time-varying covariate, for the contrast between angry and neutral faces vs control non-biological motion
| AR | |||||||
|---|---|---|---|---|---|---|---|
| Label side | Intercept (β0) | BA (β1) | BA2 (β2) | Emotion (angry) (β3) | Sex (females) (β4) | BA*Emotion (angry) (β5) | BA*Sex (females) (β6) |
| Frontal | |||||||
| IFG | |||||||
| L | 0.32 (0.06)** | −0.04 (0.03) | −0.23 (0.06)** | −0.004 (0.08) | 0.04 (0.03) | 0.02 (0.04) | |
| R | 0.30 (0.07)** | 0.02 (0.03) | −0.17 (0.06)** | 0.04 (0.10) | 0.03 (0.03) | −0.02 (0.05) | |
| PMC | |||||||
| L | 0.16 (0.03)** | −0.03 (0.01) | −0.09 (0.03)** | −0.02 (0.04) | 0.02 (0.02) | 0.02 (0.02) | |
| R | 0.22 (0.05) | 0.002 (0.03) | −0.07 (0.05) | −0.01 (0.07) | 0.01 (0.03) | 0.01 (0.04) | |
| Temporal | |||||||
| ITG/MTG/STG | |||||||
| L | 0.28 (0.04)** | −0.03 (0.02) | −0.18 (0.04)* | 0.10 (0.07) | 0.05 (0.02)* | −0.03 (0.03) | |
| R | 0.33 (0.05)** | 0.01 (0.02) | −0.12 (0.04)** | 0.08 (0.07) | 0.01 (0.02) | −0.03 (0.04) | |
| Fusiform | |||||||
| L | 0.34 (0.06)** | −0.02 (0.03) | −0.08 (0.06) | 0.09 (0.09) | 0.03 (0.03) | −0.03 (0.05) | |
| R | 0.28 (0.07)** | 0.06 (0.04) | −0.02 (0.06) | 0.27 (0.15)* | −0.01 (0.03) | −0.12 (0.06)* | |
| Occipital | |||||||
| IOGa | |||||||
| L | 0.03 (0.02) | >0.001 (0.01) | 0.02 (0.02) | −0.04 (0.02) | −0.01 (0.01) | 0.01 (0.01) | |
| IOGb | |||||||
| L | 0.27 (0.08)** | −0.03 (0.03) | −0.11 (0.05)* | 0.06 (0.13) | 0.04 (0.03) | −0.02 (0.05) | |
| Striate | |||||||
| L | 0.001 (0.03) | 0.02 (0.02) | 0.07 (0.03)* | −0.01 (0.04) | −0.03 (0.02) | −0.01 (0.02) | |
| R | – | – | – | – | – | – | – |
| Parietal | |||||||
| IPL | |||||||
| L | 0.03 (0.02) | −0.01 (0.01) | −0.03 (0.02) | −0.01 (0.02) | 0.02 (0.01) | 0.01 (0.01) | |
| R | 0.02 (0.01) | −0.001 (0.01) | −0.01 (0.01) | >−0.001 (0.02) | 0.003 (0.01) | 0.01 (0.01) | |
| SMG/AG | |||||||
| L | – | – | – | – | – | – | – |
| R | – | – | – | – | – | – | – |
| SPL | |||||||
| L | 0.01 (0.01) | −0.002 (0.01) | −0.01 (0.01) | −0.01 (0.01) | 0.002 (0.01) | 0.01 (0.01) | |
| R | 0.01 (0.01) | 0.003 (0.01) | >0.001 (0.01) | −0.01 (0.01) | 0.001 (0.01) | 0.01 (0.01) | |
| Subcortical | |||||||
| Amygdala | |||||||
| L | 0.19 (0.08)** | 0.04 (0.04) | 0.13 (0.08) | 0.18 (0.11) | −0.04 (0.04) | −0.10 (0.06) | |
| R | 0.17 (0.10)** | 0.18 (0.10) | −0.05 (0.03)* | 0.10 (0.05) | 0.15 (0.09) | −0.01 (0.01) | −0.03 (0.02) |
To avoid over-parameterization, SPSS assigns one level of a factor as a reference against which all other levels are compared. Coefficients related to the effect of sex are given relative to males; those related to the effect of emotion are given relative to the neutral condition. ROIs that were not identified by the ‘face’ ALE analysis are greyed out. *P < 0.05; **P < 0.01; - = non-convergence of mixed-models; SPL: superior parietal lobule. See legend to Table 1 for abbreviations.
Fig. 2.

Trajectories for %BSC using coefficients from the mixed-model regression applied to each ROI, with CA modelled as the predictor. Where significant Age*Emotion interactions exist, separate trajectories are plotted for the corresponding angry and neutral conditions. The ROI label and a summary of significant (P < 0.05) effects are provided: A = Age; E = Emotion; S = Sex; A*E = Age × Emotion interaction; A*S = Age × Sex interaction; Red lines = angry hands; blue lines = neutral hands; orange lines = angry faces; green lines = neutral faces. SPL: superior parietal lobule.
Fig. 3.

Trajectories for AR using coefficients from the mixed-model regression applied to each ROI, with CA modelled as the predictor. Where significant Age*Emotion interactions exist, separate trajectories are plotted for the corresponding angry and neutral conditions. The ROI label and a summary of significant (P < 0.05) effects are provided: A = Age; E = Emotion; S = Sex; A*E = Age × Emotion interaction; A*S = Age × Sex interaction; Red lines = angry hands; blue lines = neutral hands; orange lines = angry faces; green lines = neutral faces. SPL: superior parietal lobule.
Both %BSC and AR reveal an effect of emotion under the hand conditions within parietal ROIs, while for the face conditions the same is true within frontal ROIs. Only the right PMC exhibits the effect of emotion for hand actions with the frontal lobe, and only the left supramarginal gyrus/angular gyrus (SMG/AG) demonstrates this effect for face actions within the parietal lobe. Both measures of BOLD signal also reveal an effect of emotion for face but not hand actions within the inferior temporal gyrus/middle temporal gyrus/superior temporal gyrus (ITG/MTG/STG). Importantly, both measures converge on the direction of this effect: while angry hand actions elicit greater %BSC and AR than neutral hand actions in the majority of ROIs, neutral facial expressions appear to evoke a greater magnitude and extent of BOLD response then their angry counterparts. The observation of hand actions also appears to engage brain tissue within our occipital ROIs far more than face actions. This is also apparent from the lack of convergence in the models applied to AR within these ROIs under the face conditions resulting from aliasing of the covariance parameters. This is most likely due to a lack of variability around zero values, reflecting very few ‘active’ voxels within these ROIs. This explanation is supported by the fact that the lack of convergence affects primarily those ROIs defined by the ALE analysis of action observation of the opposite modality. Furthermore, for the hand but not the face conditions, an effect of emotion is detected by both measures in the left IOGa. Interestingly, in this exception, neutral hand actions elicit a BOLD response with stronger magnitude and larger extent than angry hand actions. Observable differences in intercepts and problems with model convergence were encountered in the parietal lobe, too, suggesting that hand actions engage voxels within these ROIs more than face actions.
Significant age-related linear decreases in %BSC were identified within the right PMC and right IFG, with a similar pattern revealed by AR within these same ROIs. Within the left ITG/MTG/STG, the two measures of BOLD signal converge less; in response to face actions, %BSC reveals a linear age-related decrease while AR depicts a peak occurring at ∼11 years, followed by a decline. Both measures depict an age-related decrease in the two left IOG (inferior occipital gyrus) ROIs and a U-shaped trajectory in the right striate ROI. Lastly, the measure of %BSC reveals a similar age-related quadratic trajectory under both the hand and face conditions within the left SMG/AG, with a peak occurring ∼11.5 years. It is also interesting to see sex and sex-by-age interactive effects in %BSC within the right superior parietal lobule, for hand actions only. Specifically, in males this region exhibits a greater magnitude of BOLD signal than it does in females during the observation of hand actions, and only males show an age-related linear decline. Figure 4 illustrates this sex and sex-by-age interaction for the hand conditions. Lastly, age-related declines in %BSC and AR are observed within the amygdalae ROIs.
Fig. 4.

Plot of trajectories for %BSC using the coefficients from the mixed-model regression applied to right superior parietal lobule (SPL), with age modelled as the predictor variable. Red lines = angry hands; blue lines = neutral hands; Solid lines = males; dashed lines = females.
Since the majority of ROIs revealing significant age effects showed age-related decrease in both %BSC and AR, we considered the possibility that age was confounded by some ‘habituation’ or ‘visit’ effect (see below for related discussion). To control for this potential confound, we examined a time-varying covariate computed by removing CA from pubertal stage, providing us with a pure measure of ‘biological age’ (BA). To achieve this, we calculated the residuals from the regression between pubertal stage and CA. Importantly, to eliminate the potentially confounding effect of sex in this calculation, we did this separately for males and females. We then substituted CA and all CA-related interactions with BA and applied these new linear mixed-models to each ROI. Under the hand conditions, only the right IPL and SMG/AG now maintain higher %BSC and AR for angry compared with neutral hands. Under the face conditions the effect of emotion remains fairly unchanged, with most frontal ROIs showing higher values for both measures for neutral relative to angry face actions. A more striking observation is that under both the hand and face conditions, the linear age-related decreases in %BSC and AR revealed with CA as the predictor variable are replaced by quadratic trajectories when BA is the predictor. Under the hand conditions with BA as the predictor, %BSC reveals the same U-shaped trajectory for the right striate and inverted U-shaped trajectory in the SMG/AG that it does with CA as the predictor. For the IOGa, however, the linear decrease in %BSC is replaced by a U-shaped trajectory. The same change from a linear to a U-shaped trajectory is true for AR within the right PMC, IFG and right fusiform. The right SMG/AG shows a change from a linear to an inverted U-shaped trajectory. Under the face conditions, %BSC reveals none of the linear longitudinal effects observed with CA as the predictor variable. Yet with BA as the predictor, AR now shows an inverted U-shaped function within the right amygdala.
DISCUSSION
Consistent with other reports (Caspers et al., 2010), the present ‘hand’ ALE analysis revealed a bilateral temporo-parieto-frontal network comprising all the nodes of the familiar adult AON, and the ‘face’ ALE analysis exposed a temporo-frontal network. Unique to the present meta-analyses of action observation, however, are the clusters of convergence that encompass the amygdalae and the primary and extrastriate visual cortex. These are likely due to (i) the inclusion of studies examining the BOLD response to hand and face actions executed with an emotional undertone (e.g. Carr et al., 2003; Grosbras and Paus, 2006) and (ii) the exclusion of studies contrasting action observation with control conditions that are likely to mask important activations, respectively.
Under the face conditions, both measures of BOLD signal reveal an effect of emotion in frontal ROIs, as well as the ITG/MTG/STG. This is in contrast to the findings of Grosbras and Paus (2006) who, using the same paradigm with adults, report no significant differences in BOLD signal magnitude in these regions when contrasting angry vs neutral faces. This might indicate a heightened sensitivity to the emotional content of observed actions in our adolescent sample. If we consider adolescence as involving a greater orientation towards social cues (Steinberg, 2005), perhaps it is not surprising that the emotional undertone behind observed actions modulates activity within nodes of the ‘immature’ AON. Along these lines, the observation that neutral rather than angry actions elicit a higher degree of BOLD signal within these nodes is also unsurprising; if we think of neutral facial expressions as ambiguous social cues they should necessarily demand a higher level of social processing and, therefore, induce greater BOLD signal.
Under the hand conditions, both %BSC and AR demonstrate an effect of emotion within the right IPL and left SMG/AG. Interestingly, this effect goes in an opposite direction to that observed for faces, namely ‘angry’ hands elicit a stronger response than ‘neutral’ ones. Consistent with the present results, Grosbras and Paus (2006) report that angry but not neutral hand actions engaged activity within the IPL, specifically the supramarginal gyrus. In the present study, the IPL and SMG/AG reveal an effect of emotion under both hand and face conditions. Together with evidence implicating the supramarginal gyrus in the extraction of meanings and/or intentions behind observed actions (Emmorey et al., 2002; Heberlein et al., 2004), the present results are consistent with the notion of enhanced emotional modulation of action observation-induced brain activity during the age-range studied here, as compared with adulthood.
Throughout all of the ROIs interrogated, where an effect of CA exists it is associated with linear decreases in both magnitude (%BSC) and volume (AR) of BOLD signal. We cannot ignore the possibility that the linear decreases we observe in %BSC and AR result from some confounding influence rather than underlying neurodevelopmental events. Specifically, given the nature of longitudinal developmental fMRI studies, it is possible that CA is confounded by two systematically varying influences: increasing familiarity with the experimental context and/or the stimuli. In the first case, Davidson et al. (2003) discuss the possibility that young children may experience higher anxiety levels relative to mature individuals within the scanner environment. Such state-related changes will be accompanied by the release of neurotransmitters capable of modulating task-related changes in brain function (Paus, 2008). With repeated exposure, participants will become more familiar with and less anxious within the scanner environment, confounding CA-related effects in BOLD signal. For this reason we also examined a time-varying covariate that is less confounded by this presumably linear ‘visit’ effect—‘BA’ that is based on pubertal stage after co-varying out CA. The change from linear to quadratic trajectories in %BSC under the hand conditions within the left IOGa, and in AR within right PMC and right fusiform gyrus, suggests that the linear CA-related effects are indeed partially confounded by this visit effect. In the second case, it has been reported that repeated presentation of face stimuli is associated with significant decreases in BOLD signal magnitude within some of the brain regions examined here, including bilateral PMC, inferior temporal cortex, left amygdala and a right primary visual region in close proximity to our right striate ROI (e.g. Wright et al., 2000; Fischer et al., 2003). Importantly, this effect appears to result from long-term familiarity with the stimuli rather than short-term repetition suppression (Dubois et al., 1998). Interestingly, then, under our face conditions, the linear CA-related decreases we observe in both %BSC and AR within right PMC and left amygdala are not replicated by the corresponding developmental trajectories for BA. Since BA will be less confounded by a linear ‘habituation’ effect, as adolescents entered the study at slightly different pubertal stages, we can assume that the linear CA-related decreases observed under the face conditions partially reflect habituation to the face stimuli. Since facial expressions possess greater biological relevance and social salience than hand actions, the greater discrepancy between the trajectories of BA and CA for either measure of BOLD signal under the face conditions relative to the hand conditions might be expected; that is, face actions should be more susceptible to habituation than hands. We have chosen to present the results of models based on both CA and ‘biological age’ because of the striking differences in the results obtained. Such a demonstration of the influence of a ‘visit’ effect on longitudinal measures of brain function has obvious implications for future studies into developmental neuroscience.
Since there are no studies examining the development of brain activity in response to action observation, we can only compare the present results with those from studies employing similar stimuli to ours, or studies reporting on developmental changes in brain activity within the same brain regions interrogated here. In an investigation examining the development of functional response to faces and bodies, Peelen et al. (2009) identify age-related increases between a ‘child’ (7–17 years) and an adult group (20–32 years) in AR within the right but not the left fusiform face area (FFA). Consistent with this observation, although not significant, in the present study the right fusiform gyrus is one of only two regions that suggest age-related increases in both %BSC and AR under the face conditions, and AR reveals an inverted U-shaped trajectory with BA modelled as the predictor variable. In an investigation into the development of function activity elicited during response inhibition, Durston et al.’s (2006) ROI-based analyses reveal decreases in %BSC between 9- and 11-year olds within pre-central gyrus. Similarly, again using a response inhibition task, Casey et al. (1997) discovered that BOLD signal volume within an ROI encompassing IFG decreased by half in their adult group (21–24 years) compared with their child group (7–12 years). The CA-related linear decreases in %BSC and AR and the U-shaped BA-related trajectory for AR that we have revealed within the right PMC and IFG are consistent with these previous reports. Finally, in another response inhibition task, Luna et al. (2001) report voxel-wise comparisons showing children (8–13 years) to have the largest magnitude of BOLD signal within the supramarginal gyrus relative to an adolescent and adult group. Again, this is consistent with the quadratic trajectories we have found within the SMG/AG showing declines in %BSC and AR following a peak at 11.5 years, suggesting, perhaps, a link between the development of the neural underpinnings of executive control and social cognition.
It is important to point out that all of the aforementioned prior studies have employed a cross-sectional design. In doing so they have contrasted an adolescent to an adult sample, allowing them to illustrate relative immaturities in neural systems. Instead, we have adopted a longitudinal approach examining only early adolescence. Given the greater sensitivity of a longitudinal design relative to a cross-sectional one vis-à-vis developmental changes in brain function (Durston et al., 2006), we believe our longitudinal study of brain function is well suited to furthering our understanding of the development of the AON.
In summary, under the hand conditions, similar developmental trajectories can be observed within right PMC, IFG and fusiform gyrus. The effect of CA depicts linear decreases across these ROIs, but BA suggests developmental changes are instead U-shaped. More consistent is the inverted U-shaped developmental trajectory for both %BSC and AR within SMG/AG. Under the face conditions, the discrepancy between trajectories for CA and BA are much greater, likely indicating that faces are more susceptible to habituation. The fact that frontal (i.e. right PMC and IFG) and parietal (i.e. SMG/AG) nodes show opposing developmental trajectories might suggest that the AON consists of at least two functionally distinct networks that together contribute towards social cognition: First, similar trajectories within the right PMC and IFG might reveal a frontal network involved in the preparation and/or inhibition of a response to socially relevant stimuli; Second, in the absence of any direct visual input to the motor cortices (Rizzolatti and Luppino, 2001), a parietal network might be responsible for the visuo-motor transformations that would allow visual input to modulate the activity of frontal motor circuits (e.g. Rizzolatti et al., 1997). Similar developmental trajectories for brain activity within the right PMC and IFG lend some support to the notion that coordinated brain activity within the heavily connected network results in coordinated development of grey matter within it nodes (Paus et al., 2008). Considering the putative link between excitatory post-synaptic potentials and the BOLD signal (Mathiesen et al., 1999; Logothetis et al., 2001), longitudinal measures of BOLD signal might instead be influenced by grey-matter development, the trajectories of which are non-linear in many regions of the human brain (e.g. Giedd et al., 1999; Gogtay et al., 2004).
Acknowledgments
This work was funded by the Sante Fe Institute Consortium and the Canadian Institutes of Health Research. We wish to thank Candice Cartier, Elissa Golden, Valerie Legge, Kristina Martinu and Line Gingras for assistance with the recruitment of participants and data collection. We are grateful to the participating families for their long-term commitment and interest in this work.
REFERENCES
- Allison T, Puce A, McCarthy G. Social perception from visual cues: role of the STS region. Trends in Cognitive Sciences. 2000;4:267–78. doi: 10.1016/s1364-6613(00)01501-1. [DOI] [PubMed] [Google Scholar]
- Achenbach TM, Ruffle TM. The Child Behaviour Checklist and related forms for assessing behavioural/emotional problems and competencies. Pediatrics in Review. 2000;21:265–71. doi: 10.1542/pir.21-8-265. [DOI] [PubMed] [Google Scholar]
- Buccino G, Binkofski F, Fink GR, et al. Action observation activates premotor and parietal areas in a somatotopic manner: an fMRI study. European Journal of Neuroscience. 2001;13(2):400–4. [PubMed] [Google Scholar]
- Buccino G, Binkofski F, Riggioa L. The mirror neuron system and action recognition. Brain and Language. 2004a;89:370–6. doi: 10.1016/S0093-934X(03)00356-0. [DOI] [PubMed] [Google Scholar]
- Buccino G, Vogt S, Ritzi A, et al. Neural circuits underlying imitation learning of hand actions: an event-related fMRI study. Neuron. 2004b;42:323–34. doi: 10.1016/s0896-6273(04)00181-3. [DOI] [PubMed] [Google Scholar]
- Calvo-Merino B, Grezes J, Glaser DE, Passingham RER, Haggard P. Seeing or doing? Influence of visual and motor familiarity in action observation. Current Biology. 2006;16:1905–10. doi: 10.1016/j.cub.2006.07.065. [DOI] [PubMed] [Google Scholar]
- Carr L, Iacoboni M, Dubeau M-C, Mazziotta JC, Lenzi GL. Neural mechanisms of empathy in humans: a relay from neural systems for imitation to limbic systems. Proceedings of National Academy of Science: USA. 2003;100:5497–502. doi: 10.1073/pnas.0935845100. [DOI] [PMC free article] [PubMed] [Google Scholar]
- Casey BJ, Trainor RJ, Orendi JL, et al. A developmental functional MRI study of prefrontal activation during performance of a go-no-go task. Journal of Cognitive Neuroscience. 1997;9(6):835–47. doi: 10.1162/jocn.1997.9.6.835. [DOI] [PubMed] [Google Scholar]
- Caspers S, Zilles K, Laird AR, Eickhoff S. ALE meta-analysis of action observation and imitation in the human brain. NeuroImage. 2010;50:1148–67. doi: 10.1016/j.neuroimage.2009.12.112. [DOI] [PMC free article] [PubMed] [Google Scholar]
- Cross ES, Kraemer DJM, Hamilton AF, Kelley WM, Grafton ST. Sensitivity of action observation to dance by dancers. NeuroImage. 2009;31:1257–67. doi: 10.1016/j.neuroimage.2006.01.033. [DOI] [PMC free article] [PubMed] [Google Scholar]
- Davidson MC, Thomas KM, Casey BJ. Imaging the developing brain fMRI. Mental Retardation and Developmental Disabilities; Research Reviews. 2003;9:161–7. doi: 10.1002/mrdd.10076. [DOI] [PubMed] [Google Scholar]
- Dinstein I, Hasson U, Rubin N, Heeger DJ. Brain areas selective for both observed and executed movements. Journal of Neurophysiology. 2007;98:1415–27. doi: 10.1152/jn.00238.2007. [DOI] [PMC free article] [PubMed] [Google Scholar]
- Dubois S, Rossion B, Schiltz C, et al. Effect of familiarity on the processing of human faces. NeuroImage. 1998;9:278–89. doi: 10.1006/nimg.1998.0409. [DOI] [PubMed] [Google Scholar]
- Durston S, Davidson MC, Tottenham N, et al. A shift from diffuse to focal cortical activity with development. Developmental Science. 2006;9(1):1–20. doi: 10.1111/j.1467-7687.2005.00454.x. [DOI] [PubMed] [Google Scholar]
- Eisenberg N, Morris AS, McDaniel B, Spinard TL. In: Handbook of Adolescent Psychology. 3rd edn. Learner RM, Steinberg L, editors. Hoboken, New Jersey: John Wiley & Sons; 2009. [Google Scholar]
- Eickhoff SB, Laird AR, Grefkes C, Wang LE, Zilles K, Fox PT. Co-ordinate-based activation likelihood estimation meta-analysis of neuroimaging data: a random-effects approach based on empirical estimates of spatial uncertainty. Human Brain Mapping. 2009;30:2907–26. doi: 10.1002/hbm.20718. [DOI] [PMC free article] [PubMed] [Google Scholar]
- Emmorey K, Damasio H, McCullough S, et al. Neural systems underlying spatial language in American sign language. NeuroImage. 2002;17:812–24. [PubMed] [Google Scholar]
- Fischer H, Wright CI, Whalen PJ, McInerney SC, Shin LM, Rauch SL. Brain habituation during repeated exposure to fearful and neutral faces: a functional MRI study. Brain Research Bulletin. 2003;59(5):387–392. doi: 10.1016/s0361-9230(02)00940-1. [DOI] [PubMed] [Google Scholar]
- Fogassi L, Ferrari PF, Gesierich B, Rozzi S, Chersi F, Rizzolatti G. Parietal lobe: from action organization to intention understanding. Science. 2005;308:662–7. doi: 10.1126/science.1106138. [DOI] [PubMed] [Google Scholar]
- Fogassi L, Gallese V, Fadiga L, Rizzolatti G. Neurons responding to the sight of goal-directed hand/arm actions in the parietal area PF (7b) of the macaque monkey. Society of Neuroscience Abstracts. 1998;24:154. [Google Scholar]
- Gallese V, Fadiga L, Fogassi L, Rizzolatti G. Action recognition in the premotor cortex. Brain. 1996;119:593–609. doi: 10.1093/brain/119.2.593. [DOI] [PubMed] [Google Scholar]
- Gallese V, Keysers C, Rizzolatti G. A unifying view of the basis of social cognition. Trends in Cognitive Sciences. 2004;8(9):396–403. doi: 10.1016/j.tics.2004.07.002. [DOI] [PubMed] [Google Scholar]
- Gardner M, Steinberg L. Peer influence on risk taking, risk preference, and risky decision making in adolescence and adulthood: an experimental study. Developmental Psychology. 2005;41(4):625–35. doi: 10.1037/0012-1649.41.4.625. [DOI] [PubMed] [Google Scholar]
- Giedd JN, Blumenthal J, Jeffries NO, et al. Brain development during childhood and adolescence. Nature Neuroscience. 1999;2(10):861–3. doi: 10.1038/13158. [DOI] [PubMed] [Google Scholar]
- Gogtay N, Giedd JN, Lusk L, et al. Dynamic mapping of human cortical development during childhood through early adulthood. Proceedings of National Academy of Science: USA. 2004;101:8174–9. doi: 10.1073/pnas.0402680101. [DOI] [PMC free article] [PubMed] [Google Scholar]
- Grosbras M, Jansen M, Leonard G, et al. Neural mechanisms of resistance to peer influence in early adolescence. The Journal of Neuroscience. 2007;27(30):8040–5. doi: 10.1523/JNEUROSCI.1360-07.2007. [DOI] [PMC free article] [PubMed] [Google Scholar]
- Grosbras M, Paus T. Brain networks involved in viewing angry hands or faces. Cerebral Cortex. 2006;16:1087–96. doi: 10.1093/cercor/bhj050. [DOI] [PubMed] [Google Scholar]
- Heberlein AS, Adolphs R, Tranel D, Damasio H. Cortical regions for judgements of emotions and personality traits from point-light walkers. Journal of Cognitive Neuroscience. 2004;16:1143–58. doi: 10.1162/0898929041920423. [DOI] [PubMed] [Google Scholar]
- Iacoboni M, Woods RP, Brass M, Bekkering H, Mazziotta JC, Rizzolatti G. Cortical mechanisms of human imitation. Science. 1999;286:2526–8. doi: 10.1126/science.286.5449.2526. [DOI] [PubMed] [Google Scholar]
- Jenkinson M, Bannister P, Brady M, Smith S. Improved optimisation for the robust and accurate linear registration and motion correction of brain images. NeuroImage. 2002;17(2):825–41. doi: 10.1016/s1053-8119(02)91132-8. [DOI] [PubMed] [Google Scholar]
- Jenkinson M, Smith S. A global optimisation method for robust affine registration of brain images. Medical Image Analysis. 2001;5(2):143–56. doi: 10.1016/s1361-8415(01)00036-6. [DOI] [PubMed] [Google Scholar]
- Kuhn D. Adolescent thinking. In: Learner RM, Steinberg L, editors. Handbook of Adolescent Psychology. 3rd edn. Hoboken, New Jersey: John Wiley & Sons; 2009. [Google Scholar]
- Logothetis NK, Pauls J, Augath M, Trinath T, Oaltermann A. Neurphysiological investigation of the basis of the fMRI signal. Nature. 2001;412:150–7. doi: 10.1038/35084005. [DOI] [PubMed] [Google Scholar]
- Luna B, Thulborn KR, Munoz DP, et al. Maturation of widely distributed brain function subservers cognitive development. NeuroImage. 2001;13:786–93. doi: 10.1006/nimg.2000.0743. [DOI] [PubMed] [Google Scholar]
- Marshall WA, Tanner JM. Variations in pattern of pubertal changes in girls. Archives of Disease in Childhood. 1969;44:291–303. doi: 10.1136/adc.44.235.291. [DOI] [PMC free article] [PubMed] [Google Scholar]
- Marshall WA, Tanner JM. Variations in pattern of pubertal changes in boys. Archives of Disease in Childhood. 1970;45:13–23. doi: 10.1136/adc.45.239.13. [DOI] [PMC free article] [PubMed] [Google Scholar]
- Mathiesen C, Caesar K, Akgören N, Lauritzen M. Modification of activity-dependent increases of cerebral blood flow by excitatory synaptic activity and spikes in rat cerebellar cortex. Journal of Physiology. 1999;512(2):555–66. doi: 10.1111/j.1469-7793.1998.555be.x. [DOI] [PMC free article] [PubMed] [Google Scholar]
- Molenbergs P, Cunningham R, Mattingley JB. Is the mirror system involved in imitation? A short review and meta-analysis. Neuroscience and Biobhavioural Reviews. 2009;33:975–80. doi: 10.1016/j.neubiorev.2009.03.010. [DOI] [PubMed] [Google Scholar]
- Paus T. Brain development. In: Learner R M, Steinberg L, editors. Handbook of Adolescent Psychology. 3rd edn. Hoboken, New Jersey: John Wiley & Sons; 2008. [Google Scholar]
- Paus T, Toro R, Leonard G, et al. Morphological properties of the action-observation cortical network in adolescents with low and high resistance to peer influence. Social Neuroscience. 2008;3:303–16. doi: 10.1080/17470910701563558. [DOI] [PubMed] [Google Scholar]
- Peelen MV, Glaser B, Vuilleumier P, Eliez S. Differential development of selectivity for faces and bodies in fusiform gyrus. Developmental Science. 2009;12(6):F16–25. doi: 10.1111/j.1467-7687.2009.00916.x. [DOI] [PubMed] [Google Scholar]
- Peterson AC, Crockett L, Richards M, Boxer A. A self-report measure of pubertal status: reliability, validity, and initial norms. Journal of Youth and Adolescence. 1988;17:117–133. doi: 10.1007/BF01537962. [DOI] [PubMed] [Google Scholar]
- Steinberg L. Cognitive ad affective development in adolescence. Trends in Cognitive Sciences. 2005;9(2):69–74. doi: 10.1016/j.tics.2004.12.005. [DOI] [PubMed] [Google Scholar]
- Steinberg L. A social neuroscience perspective on adolescent risk-taking. Developmental Reviews. 2008;28:78–101. doi: 10.1016/j.dr.2007.08.002. [DOI] [PMC free article] [PubMed] [Google Scholar]
- Rizzolatti G. The mirror neuron system and its function in humans. Anatomical Embryology. 2005;210:419–21. doi: 10.1007/s00429-005-0039-z. [DOI] [PubMed] [Google Scholar]
- Rizzolatti G, Fadiga L, Fogassi L, Gallese V. Premotor cortex and the recognition of motor actions. Cognitive Brain Research. 1996;3:131–41. doi: 10.1016/0926-6410(95)00038-0. [DOI] [PubMed] [Google Scholar]
- Rizzolatti G, Fogassi L, Gallese V. Parietal cortex: from sight to action. Current Opinion in Neurobiology. 1997;7(4):562–7. doi: 10.1016/s0959-4388(97)80037-2. [DOI] [PubMed] [Google Scholar]
- Rizzolatti G, Fogassi L, Gallese V. Neurophysiological mechanisms underlying the understanding and imitation of action. Nature Reviews Neuroscience. 2001;2:661–70. doi: 10.1038/35090060. [DOI] [PubMed] [Google Scholar]
- Rizzolatti G, Luppino G. The cortical motor system. Neuron. 2001;31:889–901. doi: 10.1016/s0896-6273(01)00423-8. [DOI] [PubMed] [Google Scholar]
- Tzourio-Mazoyer N, Landeau B, Papthanassiou D, et al. Automated anatomical labelling of activation in SPM using a macroscopic anatomical pracellation of the MNI MRI signal-subject brain. Neuroimage. 2002;15:273–89. doi: 10.1006/nimg.2001.0978. [DOI] [PubMed] [Google Scholar]
- West BT, Welch KB, Galecki AT. Linear Mixed Models: A Practical Guide Using Statistical Software. Florida: Taylor Francis Group; 2007. [Google Scholar]
- Woodcock RW, McGrew KS, Mather N. Woodcock-Johnson III. Itasca, IL: Riverside Publishing; 2001. [Google Scholar]
- Woolrich MW, Ripley BD, Brady JM, Smith SM. Temporal autocorrelation in univariate linear modelling of FMRI data. NeuroImage. 2001;14(6):1370–86. doi: 10.1006/nimg.2001.0931. [DOI] [PubMed] [Google Scholar]
- Wright CI, Fischer H, Whalen PJ, McInerney SC, Shin LM, Rauch SL. Differential prefrontal cortex and amygdala habituation to repeatedly presented emotional stimuli. NeuroReport. 2000;12(2):379–83. doi: 10.1097/00001756-200102120-00039. [DOI] [PubMed] [Google Scholar]