

Abstract
Heme oxygenase-1 (HO-1) is induced in most cell types by many forms of environmental stress and is believed to play a protective role in cells exposed to oxidative stress. Metabolism by cytochromes P450 (P450) is highly inefficient as the oxidation of substrate is associated with the production of varying proportions of hydrogen peroxide and/or superoxide. This study tests the hypothesis that heme oxygenase-1 (HO-1) plays a protective role against oxidative stress by competing with P450 for binding to the common redox partner, the NADPH P450 reductase (CPR) and in the process, diminishing P450 metabolism and the associated production of reactive oxygen species (ROS). Liver microsomes were isolated from uninduced rats and rats that were treated with cadmium and/or β-napthoflavone (BNF) to induce HO-1 and/or CYP1A2. HO-1 induction was associated with slower rates of metabolism of the CYP1A2-specific substrate, 7-ethoxyresorufin. Furthermore, HO-1 induction also was associated with slower rates of hydrogen peroxide and hydroxyl radical production by microsomes from rats induced for CYP1A2. The inhibition associated with HO-1 induction was not dependent on the addition of heme to the microsomal incubations. The effects of HO-1 induction were less dramatic in the absence of substrate for CYP1A2, suggesting that the enzyme was more effective in inhibiting the CYP1A2-related activity than the CPR-related production of superoxide (that dismutates to form hydrogen peroxide).
Keywords: Cytochrome P450, Heme Oxygenase-1, Metabolism, Reactive Oxygen Species
INTRODUCTION
Heme Oxygenase isoforms 1 and 2 (HO-1 and HO-2, respectively) are membrane-bound enzymes that catalyze the rate-limiting step of heme catabolism by using molecular oxygen and electrons that are supplied by NADPH cytochrome P450 reductase (CPR) to convert heme to biliverdin, CO, and ferrous iron [1]. HO-2 is found to be selectively expressed in tissues such as brain, liver, spleen, and testes [2] and is believed to play a role in signaling by providing CO which functions as a second messenger, in a manner similar to that of NO [1]. In contrast, HO-1 is constitutively expressed in liver, spleen, and bone marrow [3;4] and is highly inducible in virtually all tissues by a variety of stimuli associated with environmental stress such as oxidative stress [5], heat shock [6], nutrient depletion [7], disruption of intracellular calcium homeostasis [8], exposure to cytotoxins [9], and pro-inflammatory stimuli [10].
The correlation between HO-1 expression and environmental stress has led to the hypothesis that the enzyme plays a role in cytoprotection. This putative role has been demonstrated most convincingly by studying the antioxidant effects of the enzyme. In fact, it has been argued that oxidative stress is associated with virtually all of the environmental stimuli that induce HO-1 [11] and as a result, the main function of HO-1 may be as a general response to cellular oxidative stress [12]. Support for this assertion is provided by evidence of elevated HO-1 levels in a multitude of disease states which have been related to oxidative stress (reviewed in [13]). However, the most compelling evidence for the antioxidant effects of HO-1 activity have come from studies that show an increased susceptibility to oxidative injury in people having a defective HO-1 gene [14;15] and from studies demonstrating that the over-expression of HO-1 in rat lung [16;17] and liver [18] by targeted gene therapy afforded increased resistance to H2O2-and heme-related toxicity in the lung and liver cells derived from these animals.
In general, the antioxidant effects of HO-1 are attributed directly to its catalytic activity [19]. First, it has been demonstrated that heme is a potent, hydrophobic pro-oxidant [20]. Among other effects, it has the capacity to intercalate in membranes and mediate the peroxidation of membrane phospholipids [21]. Thus, the metabolism by HO-1 primarily serves as a mechanism by which the cell scavenges free heme and prevents its build-up to toxic levels. In addition, the pigments derived from HO-1-mediated metabolism of heme, biliverdin and bilirubin (which is formed from biliverdin by biliverdin reductase) have been shown to have antioxidant properties [22;23] Finally, CO, in its role as a secondary messenger, has been shown to protect hepatic microcirculation under oxidative stress [11].
The cytochromes P450 (P450) represent a gene superfamily of enzymes that are involved in the oxidative metabolism of a wide variety of xenobiotics. Similar to HO-1, the P450 enzymes use molecular oxygen and electrons provided by CPR to insert an oxygen atom into a substrate molecule [24]. Typically, the substrates for these enzymes are highly lipophilic, so metabolism by the P450s produce a more water-soluble product, facilitating the disposition and clearance of ingested foreign compounds. However, in the process of metabolizing some compounds, the P450 system can catalyze the formation of reactive metabolites that can lead to toxicity and/or carcinogenesis [25;26]. In addition, reactive oxygen species (ROS), such as hydrogen peroxide and superoxide, are formed as by-products of normal substrate turnover by P450 [27].
In several studies, HO-1 expression and activity resulted in increased resistance to oxidative injury associated with the P450-mediated metabolism of hepatotoxins. In three separate in vivo studies, the treatment of rats with halothane [28], acetominophen [29], and carbon tetrachloride [30] (hepatotoxins that are known to be activated to toxic intermediates by P450 [26]) resulted in increased hepatic expression of HO-1. In those studies, it was determined that heme released from damaged P450 was responsible for the induction of HO-1. Furthermore, it was shown that inhibition of HO-1 activity resulted in potentiation of P450-mediated hepatotoxicity, and in the halothane and acetaminophen studies, it was also shown that pretreatment of animals with heme to induce HO-1 afforded protection from subsequent treatment with the hepatotoxins. These studies corroborated the findings from a study with liver-derived HEPG2 cells that showed oxidative injury associated with CYP2E1 metabolism was partially prevented by the induction of HO-1 [31].
These studies suggest that there is an intimate relationship between P450 activity and HO-1 expression. The basis for this relationship partly resides in the fact that HO-1 and P450 both share the same redox partner, CPR (Figure 1). Furthermore, in liver tissue, CPR is expressed at much lower abundance than P450 (1/10th to 1/20th the P450 concentration [32]). Thus, there appears to be the potential for inhibition of each enzyme system through the competition for binding to the limiting amount of CPR. We have recently published studies examining the interaction of full-length HO-1 with CPR [33;34]. Those findings, in comparison to others pertaining to the interaction of P450 with reductase [35], suggest that the full-length HO-1 binds to CPR with greater affinity than P450 and demonstrates high affinity interaction with CPR even in the absence of heme. Thus, HO-1induction may diminish the interaction of CPR and P450 and, in turn have a cytoprotective effect by limiting destructive P450-mediated metabolism during exposure to environmental stress. Interestingly, it also has been shown that the interaction of HO-1 with various isoforms of P450 may lead to degradation of the P450s [36;37]. Thus, in addition to preventing the interaction of CPR and P450 by binding to the former, HO-1 also may modulate the P450 system by directly interacting with P450 to facilitate the catabolism of its heme prosthetic group.
Figure 1. Schematic diagram of the potential protein interactions in the endoplasmic reticulum that influence the activities of the P450 system and HO-1.

The thick, double-sided arrows represent potential protein interactions that occur in the endoplasmic reticulum. The activities of both HO-1 and P450 are dependent on the interaction of the enzymes with the CPR. When electrons from CPR are received by P450, the P450 uses O2 to convert substrates to products. In some cases, these products are reactive, electrophilic metabolites. Metabolism by P450 also results in the production of hydrogen peroxide and superoxide as side-products. When electrons are transferred to HO-1 after binding to CPR, O2 is used to convert heme to ferrous iron, CO, and biliverdin. However, previous data suggest that HO-1 and CPR bind with high affinity even when the HO-1 is not bound to heme [45]. The P450 is in abundance relative to CPR in the endoplasmic reticulum (10- to 20-fold excess). Thus, metabolism by P450 may be significantly diminished by the induction of HO-1 and subsequent interaction of HO-1 and CPR. In this capacity, HO-1 would provide protection from oxidative stress by attenuating the production of ROS by P450. A putative interaction (?) between HO-1 and P450 as suggested by other studies [36;37] also is shown in the figure. It has been suggested that heme from the P450 may be scavenged by HO-1, leading to inactivation of the P450 [36]. Because heme is a pro-oxidant, HO-1 also would protect against oxidative stress through this putative interaction by catalyzing the degradation of the heme and halting the production of ROS by P450.
The goal of this study is to measure specific metabolism by CYP1A2 (cytochrome P450 1A2) and the NADPH-dependent production of hydrogen peroxide and hydroxyl radical from rat liver microsomes with and without induction of CYP1A2 and/or HO-1. The study will also compare the effects of HO-1 in the presence and absence of heme. It is predicted that HO-1 expression will be associated with lower rates of CYP1A2-mediated metabolism and NADPH-dependent ROS production even in the absence of added heme.
MATERIALS AND METHODS
Chemicals
All chemicals were from Sigma Chemical Co. (St. Louis, MO) unless specified otherwise.
Treatment of rats
For all of the treatment conditions, male Sprague Dawley rats (four animals/group) were dosed i.p.; fasted overnight; and euthanized 24 hr later. Rats were divided into the following experimental groups to assess the affect of HO-1 induction on CYP1A2-mediated metabolism and NADPH-dependent ROS production: 1) HO-1-induced – dosed with 20 μmol/kg cadmium chloride in saline solution; 2) CYP1A2-induced – dosed with 40 mg/kg β-napthoflavone (βNF) as a 1 % suspension in corn oil; 3) – HO-1- and CYP1A2-induced – dosed with both cadmium chloride and βNF; and 4) Control – dosed with vehicle only.
Preparation of liver microsomes and measurement of protein levels of P450, HO-1, and CPR
Livers were excised immediately after rats were euthanized. Microsomes and rat liver cytosol were prepared by differential centrifugation, and protein concentrations were determined [38]. The microsomes from each rat were diluted to 20 mg/mL protein with 0.01 M potassium phosphate (pH 7.4) and stored at − 80°C. Total P450 levels were determined by measuring the carbon-monoxy ferrous complex [39]. The levels of CPR, CYP1A2, and HO-1 in the microsomes were determined by western blot densitometry using the following primary antibodies: 1) mouse monoclonal antibody to the rat HO-1 (US Biologics, Swampscott, MA); a rabbit, polyclonal to rat CPR (Stressgen, Victoria, BC, Canada); and a mouse monoclonal to rat 1A1 (NIH, Bethesda, MD). The CPR antibody was diluted 1:4000, whereas, the other two were diluted 1:1000. The standards used were the purified rat CPR [33], rat CYP1A2-expressing baculosomes purchased from BD Gentest (Franklin Lakes, NJ), and human HO-1 [33] respectively, as standards. The secondary IgG antibodies were linked to horse radish peroxidase and were the goat anti-mouse and mouse anti-rabbit antibodies the respective species (Sigma, St. Louis, MO) and were diluted 1:2000 for the secondary incubation. The chemiluminescence was detected by incubation with SuperSignal West Pico substrate (Thermo-Scientific, Rockford, IL).
Determination of the rate of 7-ethoxyresorufin metabolism by rat liver microsomes induced for expression of CYP1A2
The effect of HO-1 expression on CYP1A2 activity in rat liver microsomes was determined by measuring the metabolism of 7-ethoxyresorufin (7ERF) [38]. For these reactions, the βNF- and βNF-/cadmium-induced microsomes were suspended at a CYP1A2 concentration of 0.05 μM (as determined from the western blot densitometry) in 0.09 mL of buffer containing 0.05 M Hepes (pH 7.5), 15 mM MgCl2, 5 μM 7ERF (added from a 2 mM stock solution in methanol), and 0.1 mM EDTA. The reactions at 37°C were initiated with 10 μL of 4 mM NADPH. The rates were determined in real time fluorescence by comparison to a resorufin standard curve (Ex – 535 nm; Em – 585 nm) and are expressed as the average ± the standard error of 12 determinations.
Determination of the rate of heme metabolism by rat liver microsomes induced for expression of HO-1
HO-1 activity was measured in rat liver microsomes by monitoring the formation of bilirubin from heme as described previously [40]. Rat liver microsomes and cytosol were suspended at final protein concentrations of 4 mg/ml and 5 mg/ml, respectively in 100 mM potassium phosphate buffer (pH 7.4) that also contained 0.2 unit/μL catalase, 0.15 mg/ml bovine serum albumin, and 15 μM heme. When indicated, the incubations also contained 5 μM 7ERF. The 0.09 ml samples were incubated at 37°C for 3 min before the reactions were initiated with 10 μL of 4 mM NADPH. The rate of formation of bilirubin was monitored in real time by absorbance at 468 nm.
Determination of the rate of NADPH-dependent hydrogen peroxide production by rat liver microsomes
Rat liver microsomes were contaminated with catalase making the detection of hydrogen peroxide problematic. Samples of liver microsomes from each rat were subjected to an additional high speed centrifugation step in an attempt to remove residual catalase. However, the microsomes obtained in this manner still catalyzed the degradation of exogenous hydrogen peroxide. Thus, a modified method of Hildebrandt et al. [41], which utilizes the peroxidase activity of catalase to convert hydrogen peroxide and methanol to water and formaldehyde, was used to measure hydrogen peroxide production by rat liver microsomes. Briefly, rat liver microsomes were suspended at a protein concentration of 2 mg/mL in 0.18 mL of buffer containing 0.05 M Hepes (pH 7.4), 15 mM MgCl2, 0.1 mM EDTA, 400 units of bovine liver catalase, and 0.5 % methanol. All buffers and water used in assays to measure ROS production were run over a 100 mL column of Chelex 100 (Bio Rad, Hercules, CA) before use. Some reactions also included 15 μM heme, 200 μM phenacetin, and/or 10 μM 7ERF, as indicated. Prior to using this procedure to measure the rates in microsomes, control experiments were conducted with the purified enzymes to show that 0.5 % methanol had minimal effects on the metabolism of 7ERF and heme by CYP1A2 and HO-1, respectively. After incubating for 5 min at 37°C, reactions were initiated with 20 μL of 4 mM NADPH. After 7 min, the reactions were terminated by vortexing after the addition of 20 μL of a saturated solution of BaSO4 and 22 μL of a solution containing both 25 % ZnSO4 (w/v) and 50 mM semicarbazide (pH 7.0). The samples, in 1.5 mL plastic microfuge tubes, were then immediately placed in ice for 10 min before centrifugation at 16,000 × g for 10 min. The supernatants were then mixed in a clean microfuge tube with an equal volume (0.1 mL each) of a solution containing 2 M ammonium acetate, 0.2 % (v/v) acetyl acetone; and 0.3 % (v/v) acetic acid and heated at 37°C for 30 min. The amounts of formaldehyde formed in the reactions were determined by fluorescence [42] (excitation: 410 nm; emission: 510 nm) and comparison to a formaldehyde standard curve.
Determination of the rate of NADPH-dependent hydroxyl radical production by rat liver microsomes
The method of Klein et al. [43] utilizing the ability of hydroxyl radical to oxidize dimethyl sulfoxide to formaldehyde was adapted to measure the rate of hydroxyl radical formation by rat liver microsomes. The reaction conditions were identical to those used to measure hydrogen peroxide production except the incubations contained 0.5% dimethyl sulfoxide and 0.5 mM sodium azide and did not contain methanol and bovine liver catalase. As described above in the protocol to measure hydrogen peroxide, control studies were conducted with the purified enzymes to show that 0.5% dimethyl sulfoxide and 0.5 mM sodium azide did not affect HO-1 and CYP1A2 metabolism of heme and 7ERF, respectively. Formaldehyde production was quantitated as described above.
RESULTS
Induction of CYP1A2 and/or HO-1 in rat liver microsomes
To test the hypothesis that HO-1 plays an anti-oxidant role, in part, by modulating the activity of the P450 monooxygenase system, this study compared CYP1A2-mediated metabolism and the NADPH-dependent generation of ROS by control and HO-1-induced rat liver microsomes. Rats were treated with cadmium chloride and BNF to induce HO-1 and CYP1A2, respectively. Thus, the effects of HO-1 on the specific metabolism by CYP1A2 could be determined.
Densitometry of western blots run with known amounts of the purified CYP1A2, HO-1, and CPR was performed (Fig 2).
Figure 2. Representative western blots of CYP1A2 (A), HO-1 (B), and CPR (C) standards and rat liver microsomal samples.
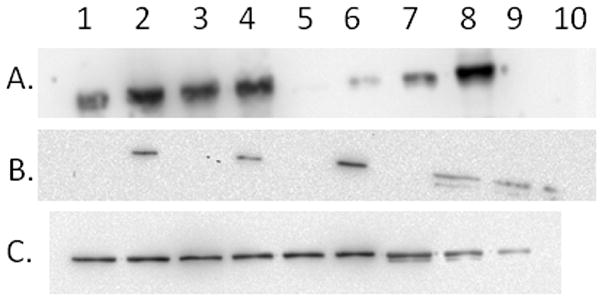
(Panel A) Western blot for CYP1A2 derived by running 2 μL of the microsomal samples from rats treated with BNF in lanes 1–4 and four concentrations of purified CYP1A2 standard protein (1, 2, 5, and 10 pmol) in lanes 5–8, respectively. (Panel B) Western blot for HO-1 derived by running 5 μL of microsomes from rats not treated with cadmium (lanes 1 and 3 used control microsomes; lanes 5 and 7 used microsomes from BNF-treated rats) and 2 μL of cadmium-induced microsomes (lane 2 used microsomes from rats treated only with cadmium; lanes 4 and 6 used microsomes from rats treated with both cadmium and BNF). Lanes 8, 9, and 10, contained 5.0, 2.5, and 1.0 pmol of HO-1 standard, respectively. The concentration of the HO-1 stadard was adjusted by densitometry for the proportion of degraded, shortened form of HO-1 present. (Panel C) Western blot for CPR derived by running 1.5 μL of microsomal samples from uninduced (lanes 1 and 2), cadmium-treated (lanes 3 and 4), BNF-treated (lane 5), and BNF-/cadmium-treated (lane 6). Lanes 7, 8, and 9 contained 2.0, 1.0, and 0.5 pmol, respectively of CPR standard. The western blots were performed as described in materials and Methods.
Table 1 shows the levels of total P450, CPR, CYP1A2, and HO-1 in the rat liver microsomes after the different treatments. The table shows that HO-1 and CYP1A2 were induced approximately 10- and 20-fold, respectively by the induction protocols; whereas, CPR levels were not significantly changed by any of the treatments. There was an excess of total P450 over CPR by all of the treatments (although the excess was not as large as reported previously [32]). The level of HO-1 expression was one fourth that of CPR in control animals; however, after induction of HO-1 with cadmium chloride HO-1, expression was roughly four times that of CPR and comparable to the total P450.
Table 1.
Expresssion levels (μM ± standard error) of HO-1, CPR, and CYP1A1/1A2 levels in rat liver microsomesa.
| Treatment Group | HO-1 | CPR | CYP1A1/1A2 | Total P450 |
|---|---|---|---|---|
| Control | 0.817 ± 0.2 | 3.6 ± 0.3 | 0.05 ± 0.01 | 16.8 ± 0.95 |
| Cadmium | 9.8 ± 3** | 3.2 ± 0.5 | 0.03 ± 0.01 | 13.6 ± 1.5 |
| BNF | 0.9 ± 0.3 | 3.0 ± 0.6 | 0.73 ± 0.15* | 17.28 ± 0.52 |
| BNF/Cadmium | 8.0 ± 1.0* | 1.8 ± 0.5 | 1.05 ± 0.32** | 13.98 ± 0.93 |
Rats were treated and liver microsomes were prepared as described in Materials and Methods. The concentrations of HO-1, CPR, and CYP1A2 in rat liver microsomes were determined by western blot densitometry, whereas the concentration of total P450 was determined from the ferrous CO complex.
indicate the expression levels are significantly different, as indicated by a Dunnett’s test, from control (P < 0.05 and P < 0.01, respectively).
Although CYP1A2 was induced dramatically by BNF treatment, the enzyme still constituted a small percentage (<10 %) of the total P450. Because of the small proportion of CYP1A2 in the microsomes from BNF-treated animals, CPR was in excess of both HO-1 and CYP1A2, whereas in BNF/cadmium-treated microsomes, levels of HO-1 were 3-fold greater than the sum of the levels of CPR and CYP1A2. Thus, the induction of HO-1 was ideal to test the hypothesis that HO-1 could influence specific metabolism by CYP1A2 through a mechanism involving either the competition with the P450 for the limiting CPR or by directly binding to CYP1A2 to influence its interaction with CPR.
Metabolism of 7ERF by BNF microsomes
To measure the effect of HO-1 induction on the productive metabolism by CYP1A2, the microsomes from the BNF-treated rats (± cadmium) were assayed for 7-ethoxyresorufin (7ERF) O-dealkylation activity. This reaction has been shown to be specific for CYP1A2 [44]. Figure 3 shows that the specific activity of the microsomes from the BNF/cadmium-treated rats was significantly lower than that from the BNF-treated rats (P < 0.0001). These data are consistent with our hypothesis that HO-1 inhibited the activity of CYP1A2 in liver microsomes even in the absence of heme. The presence of heme in the microsomal 7ERF reactions did not significantly affect the results. Such results are consistent with our previous findings showing that HO-1 binds tightly to CPR even in the absence of heme [33;45].
Figure 3. Rate of 7ERF metabolism by liver microsomes from rats treated with BNF and BNF/cadmium.

The rate of O-dealkylation of 7ERF by rat liver microsomes was determined as described in Materials and Methods. The data represent the average ± the standard error of 24 determinations (microsomes from 4 rats × 6 replicates).
Effect of cadmium chloride on CYP1A2-mediated metabolism of 7ERF
Cadmium has been shown to be a toxic heavy metal which binds avidly to thiol groups of intracellular proteins [46]. It seemed possible that the lower CYP1A2-mediated activity associated with cadmium treatment (Fig 3) was attributable to cadmium-related inhibition of the P450. It has been shown that 10 μM cadmium chloride can induce HO-1 in hepatocytes [47]. The intracellular Cd concentration in liver cytosol following dosing conditions very similar to those used in this study (250 g rats dosed i.p. with 17μmol/kg cadmium chloride) was estimated to be approximately 65 μM [48]. Because most of the cadmium contained in liver cells is bound to metallothionein in the cytosol [46], we tested the effects of 10 μM and 50 μM cadmium chloride on the CYP1A2-mediated metabolism of 7ERF in the BNF-treated microsomes. Our results show that the inhibition resulting from both cadmium concentrations was not statistically significant (Fig 4) in stark contrast to the relative levels of CYP1A2 activities in the BNF- and BNF/cadmium-treated microsomes (Fig 3). Thus, it seems likely that the inhibition in CYP1A2 activity associated with cadmium treatment is attributable to the induction of HO-1 and not to a direct effect of the heavy metal on the P450.
Figure 4. Effect of cadmium chloride on 7ERF metabolism by liver microsomes from rats treated with BNF.

The rate of O-dealkylation of 7ERF by rat liver microsomes was determined as described in Materials and Methods except that the assay buffer was 100 mM potassium phosphate (pH 7.4). The CYP1A2 concentrations in the liver microsomes from the four rats treated with BNF were determined by western blot densitometry (described in Materials and Methods). The liver microsomes were then pooled so that equal CYP1A2 concentrations were added from each batch of liver microsomes, and the reactions were performed using 0.05 μM CYP1A2 in incubations with the indicated concentrations of cadmium chloride. The data represent the average ± the standard error of 3 determinations for each concentration of cadmium chloride.
Metabolism of heme by cadmium microsomes in the presence and absence of 7ERF
The HO-mediated catabolism of heme by microsomes from cadmium-treated rats was also measured (Fig 5). The total rates of heme metabolism by HO-1 are much slower than the rates of CYP1A2-mediated 7ERF metabolism but are within a credible range for those expected from studies with the full-length HO-1 at subsaturating CPR concentrations [45]. Interestingly, there was a slight, but significant (P < 0.05) increase in the activity of HO-1 upon induction of CYP1A2 by BNF treatment that cannot be attributed to differences in either the levels of HO-1 induction or the CPR:HO-1 ratios. Inclusion of the CYP1A2-specific substrate, 7ERF, had no significant effect on the rate of HO-1 metabolism by BNF microsomes indicating that the putative competition of HO-1 and CYP1A2 for binding to CPR was not influenced by P450 substrate.
Figure 5. Rates of heme metabolism by liver microsomes induced for HO-1 induction in the presence and absence of 7ERF.

The rates of HO-1-mediated heme metabolism by cadmium and BNF/cadmium microsomes was measured as described in Materials and Methods. The data represent the averages ± the standard errors of at least 12 determinations for each bar. “N.D.” indicates that the rate of heme metabolism by cadmium microsomes was not determined in the presence of 7ERF.
NADPH-dependent production of hydrogen peroxide by microsomes
The rate of uncoupled metabolism by total P450 in the rat liver microsomes was determined by measuring the rate of the NADPH-dependent production of hydrogen peroxide [41]. This allows for the determination of the two main products of uncoupled metabolism by P450, hydrogen peroxide and superoxide (that also forms hydrogen peroxide by dismutation [49]).
In the absence of substrate for CYP1A2 and HO-1, the means of the rates of hydrogen peroxide production by the microsomes from the control and BNF-treated (CYP1A2-induced) animals were higher than those by the respective cadmium-treated (HO-1-induced) rats (Fig 6A). However, the differences were only statistically significant in the case of the BNF- and BNF/cadmium-treated microsomes (P < 0.01). Interestingly, heme had a slight inhibitory effect on hydrogen peroxide production by the control and CYP1A2-induced (BNF-treated) microsomes but almost no effect on hydrogen peroxide generation by the HO-1-induced microsomes. Because of these effects, the inhibition associated with HO-1 induction was not as dramatic in the presence of heme.
Figure 6. Effects of HO-1 and/or CYP1A2 induction on the production of hydrogen peroxide by rat liver microsomes in the presence and absence of P450 substrate.

The rates of hydrogen peroxide production were determined as described in Materials and Methods. Panel A shows the rates in the absence of P450 substrate. Panels B and C show the rates in the presence of 10 μM 7ERF and 200 μM phenacetin, respectively. The data represent the average ± the standard error of 24 determinations (microsomes from 4 rats × 6 replicates).
The effect of HO-1 on uncoupled metabolism associated with CYP1A2 substrate turnover initially was assessed by the addition of 7ERF to the incubations with BNF- and BNF/cadmium-treated microsomes (Fig 6B). Hydrogen peroxide production by the CYP1A2-induced microsomes was stimulated approximately 2-fold in the presence of 7ERF (compare rates by BNF and cadmium/BNF microsomes in panels 3A and 3B). The rate by the BNF/cadmium microsomes was significantly lower (P < 0.001) than that by BNF microsomes. As observed in the absence of 7ERF, the addition of heme attenuated the production of hydrogen peroxide by the BNF microsomes but not by the BNF/cadmium microsomes.
Although 7ERF has been shown to be a CYP1A2-specific substrate in rats (47), it is problematic to use this substrate to study the ROS formed as a by-product of P450-mediated metabolism because it is also involved in a CPR-catalyzed redox cycle [50]. In this cycle, the CPR directly reduces 7ERF and the reduced compound is oxidized by molecular oxygen or superoxide. Because superoxide dismutates to form hydrogen peroxide and oxygen, this cycle can contribute significantly to the hydrogen peroxide formed by microsomes in the presence of NADPH. To test the possible contribution of the 7ERF-CPR redox cycle to the production of hydrogen peroxide by the P450, we prepared a reconstituted system containing lipid, purified CPR, 7ERF, and NADPH. Under these conditions, it was found that hydrogen peroxide was formed at a rate that exceeded 150 nmol/min/nmol CPR (data not shown).
Because of the multiple possible sources of ROS production from the metabolism of 7ERF, we also analyzed microsomal ROS generation in the presence of another CYP1A2-specific substrate, phenacetin (Fig 6C). Unlike the results with 7ERF, we did not observe any ROS production by a reconstituted system of purified CPR and lipid in the presence of phenacetin (data not shown). In conjunction, the addition of phenacetin was not associated with an increase in H2O2 production by the control microsomes.
Similar to the results without substrate and with 7ERF, the induction of HO-1 was associated with slightly lower hydrogen peroxide production in the presence of phenacetin. However, the addition of heme to the phenacetin-containing incubations with BNF-treated microsomes resulted in a significant increase (P < 0.05) and not a decrease, as observed without substrate and with 7ERF, in the production of hydrogen peroxide. As a result, the decrease in H2O2 production associated with HO-1 induction was significant (P < 0.05) for the BNF-treated but not for the control microsomes.
NADPH-dependent production of hydroxyl radical by microsomes
The presence of heme in microsomal incubations was associated with lower rates of hydrogen peroxide generation under all of the conditions except one (with the CYP1A2 substrate, phenacetin). This was surprising given the evidence that heme has been shown to be a potent pro-oxidant [20]. One possible explanation for the findings was that heme may have contributed to the production of hydroxyl radicals in the presence of hydrogen peroxide and/or superoxide [21;51;52]. To test this possibility, the rate of production of hydroxyl radicals by the rat liver microsomes was measured from the hydroxyl radical-mediated oxidation of dimethyl sulfoxide to formaldehyde [53].
Figure 7 shows the rates at which hydroxyl radicals were formed by rat liver microsomes in the presence and absence of substrates for CYP1A2 and/or HO-1. Hydroxyl radical formation was detected under all conditions in the absence of P450 substrate (Fig 7A). Furthermore, the induction of HO-1 by cadmium-treatment was associated with significantly lower rates of hydroxyl radical production (P < 0.05) by both control and BNF microsomes in the absence of substrate. In contrast to its general effects on H2O2 generation, heme stimulated the rate of hydroxyl radical production greater than 2-fold by both sets of microsomes. In the presence of heme, the induction of HO-1 was associated with significantly lower rates of hydroxyl radical generation by BNF-microsomes (P < 0.05).
Figure 7. Effects of HO-1 and/or CYP1A2 induction on the production of hydroxyl radical by rat liver microsomes in the presence and absence of substrate.

The rates of hydroxyl radical production were determined as described in Materials and Methods. Panel A shows the results in the absence of P450 substrate, and panel B shows the results in the presence of 200 μM phenacetin. The data represent the average ± the standard error of 24 determinations (microsomes from 4 rats × 6 replicates).
The effect of the CYP1A2-specific substrate, phenacetin, on hydroxyl radical generation by the BNF microsomes is shown in Figure 7B. In contrast to its effects on hydrogen peroxide production by the BNF microsomes, phenacetin resulted in a 2–3-fold increase in hydroxyl radical production by both sets of microsomes (± cadmium) (P < 0.001) suggesting that the formation of this radical was partly attributable to CYP1A2-mediated metabolism. In the presence of phenacetin, the rates of hydroxyl radical production by the BNF/cadmium microsomes were significantly less than those by the BNF microsomes. The addition of heme to the incubations with phenacetin stimulated hydroxyl radical production by the BNF- but not by the BNF/cadmium-microsomes. These relative effects were also observed in the measurement of hydrogen peroxide production by the BNF and BNF/cadmium microsomes. Thus, HO-1 induction appeared to inhibit the hydroxyl radical generation that was mediated by CYP1A2 and potentiated by heme.
DISCUSSION
Cellular ROS can be produced from a number of sources [54]. Enzymes such as xanthine oxidase, cyclooxygenase, and NAD(P)H oxidases produce hydrogen peroxide and/or superoxide as part of their reaction cycles. It is generally thought that most cellular ROS is produced by the loss of electrons from oxidative phosphorylation. However, in a healthy cell, it is estimated that only 0.1–0.2 % of reducing equivalents are lost during this mitochondrial electron transport [55]. Studies with purified P450s have determined that the mixed-function oxidation of substrates is highly inefficient. In a process known as the “uncoupling of P450 metabolism”, a proportion of the reducing equivalents derived from NADPH (typically more than 50 % [56]) is used to produce ROS and not to catalyze the mixed-function oxidation of the substrate [27]. Both the degree of uncoupling that occurs and the proportions of different ROS formed during P450-mediated metabolism are dependent on both the substrate and the P450 isoform being tested [57–59]. Furthermore, the CPR alone has been shown to be capable of directly reducing molecular oxygen to superoxide [60]. The proportion of total cellular ROS derived from metabolic processes in the endoplasmic reticulum has not been clearly defined. However, given the highly inefficient nature of P450-mediated metabolism and the fact that the liver endoplasmic reticulum contains 60 % of the heme proteins (the majority of which are P450 enzymes) and 20–30 % of flavoproteins involved in total cellular electron transport [61], it is likely that the contribution of ROS resulting from metabolism by P450 is significant. In support of this assumption, HEPG2 cells expressing CYP2E1 have been shown to be more susceptible to toxicity resulting from oxidative stress [62] and inducible levels of P450-mediated oxidative stress have been detected in intact rodents [63].
The induction of HO-1 expression has been shown to afford protection from oxidative stress [5;11;12]. In general, the antioxidant effects of the enzyme can be attributed directly to its ability to scavenge heme and produce antioxidants (biliverdin and indirectly bilirubin). However, given that both HO-1 and P450 must bind to the CPR in order to be catalytically active, HO-1 also may limit the cellular exposure to ROS by modulating the activity of the P450 monooxygenase system. Because uncoupled P450-mediated metabolism appears to make a significant contribution to the total cellular production of ROS, the putative ability of HO-1 to modulate P450 metabolism could serve an important biological role in a cell undergoing oxidative stress. This study tested the ability of HO-1 to inhibit the productive and uncoupled metabolism mediated by CYP1A2 in rat liver microsomes.
Productive metabolism by CYP1A2, measured by the rate of 7ERF O-dealkylation, was significantly lower (approximately 2-fold) in BNF-treated microsomes when HO-1 was also induced in the microsomes. This was observed whether or not heme was added to the incubations, supporting our findings that the HO-1 physically interacts with CPR even in the absence of heme [45] and suggesting that the interaction of CYP1A2 with CPR is impeded when HO-1 is present. Furthermore, without exception, the means of the rates of hydrogen peroxide and hydroxyl radical production by microsomes from cadmium-treated rats were lower than the rates catalyzed by the corresponding microsomes in which HO-1 was not induced. These data support the overall hypothesis that HO-1 does modulate the activity by the P450 monooxygenase system.
Studies with the purified enzymes have shown that uncoupled metabolism by CYP1A2 produces hydrogen peroxide almost exclusively [57], whereas other P450 enzymes have been shown to produce superoxide predominantly in the uncoupled reactions [56]. Uncoupled activity by the CPR causes the direct reduction of molecular oxygen to superoxide [60]. In the absence of substrates, reconstituted systems containing the purified CPR, P450, and lipid do catalyze a low, steady rate of NADPH oxidase activity which could represent ROS formed either by electrons “leaking” from CPR or by interrupted P450 turnover events after electron transfer from the CPR to P450 [59;64]. Studies have demonstrated that P450 substrates increase the binding affinity between the P450 and CPR [59;64;65]. Thus, in the absence of P450 substrate, it may be assumed that the CPR-mediated direct production of superoxide may constitute a greater proportion of the total ROS formed by the P450 monooxygenase system. However, one peculiarity of CYP1A2 is that it apparently binds more tightly to CPR in the presence of other isoforms of P450 [35;66]. Thus, when CYP1A2 was induced by BNF, there may have been significant reduction of the P450 by CPR even in the absence of substrate resulting in the CYP1A2-mediated production of hydrogen peroxide at the expense of CPR-generated superoxide.
Interestingly, the induction of CYP1A2 was associated with slightly higher HO-1 activity in microsomes from cadmium-treated rats. These differences could not be attributed to different levels of HO-1 induction or to different CPR:HO-1 ratios. However, these data may be explained by the propensity of CYP1A2 to form mixed complexes with other P450 isoforms (discussed above) as studies have shown that the other P450s are less active in complex with CYP1A2 [35;66]. Thus, the P450s bound to CYP1A2 may have been shielded from interacting with CPR and thus, more CPR may have been available for facilitating HO-1 metabolism. Alternatively, BNF induction may have repressed another P450 isoform that has very high affinity for binding to the CPR. Whatever the cause of BNF microsomes having higher HO-1 activity than cadmium microsomes, the effect was only slight and did not challenge the hypothesis that HO-1 expression can regulate CYP1A2-mediated metabolism.
The inhibition in the rates of ROS production associated with HO-1 induction was more pronounced in the BNF microsomes, consistent with HO-1 being able to impede the induced CYP1A2 from interacting with CPR. Hydrogen peroxide production by BNF microsomes was greatly stimulated in the presence of 7ERF because the CPR-mediated production of superoxide (and subsequent dismutation to hydrogen peroxide) was stimulated by the 7ERF redox cycle [50] discussed in the Results section. HO-1 induction had only a slight inhibitory effect on hydrogen peroxide production in the presence of 7ERF, indicating that HO-1 had little effect on the 7ERF redox cycle (and possibly the ability of CPR to reduce molecular oxygen and form superoxide).
Although heme is known to be a potent pro-oxidant [20;21], the rates of hydrogen peroxide production were typically lower in its presence. It was suspected that the heme participated in Fenton and Haber-Weiss reactions in the presence of both superoxide and hydrogen peroxide to form hydroxyl radical [51;53]. Of the two CYP1A2 substrates, 7ERF metabolism would be associated with the production of both superoxide (formed from the 7ERF redox cycle) and hydrogen peroxide (formed from both superoxide dismutation and uncoupled CYP1A2 metabolism), whereas metabolism of phenacetin would be predominantly associated with the production of hydrogen peroxide (resulting mainly from uncoupled metabolism by CYP1A2). The availability of both reactants needed for Fenton and Haber-Weiss reactions would suggest that heme would be able to generate greater amounts of hydroxyl radical when 7ERF was used as a substrate. Consistent with this hypothesis, heme was associated with a dramatic decrease in hydrogen peroxide production in the presence of 7ERF. Because less superoxide would be formed during the CYP1A2-mediated metabolism of phenacetin, less reduced heme would be available to initiate the conversion of hydrogen peroxide to hydroxyl radical. In conjunction, heme did not diminish the rate of hydrogen peroxide production by BNF in the presence of phenacetin.
Consistent with our hypothesis that heme participated in a Haber-Weiss reaction, hydroxyl radical was stimulated dramatically (3- to 5-fold) by the presence of heme. HO-1 induction was associated with lower averaged rates of hydroxyl radical production under all conditions showing HO-1 is particularly effective in inhibiting the production of this destructive form of ROS. As observed with hydrogen peroxide generation, the decreases associated with HO-1 induction were more dramatic in the microsomes induced for CYP1A2 expression suggesting HO-1 was more effective in inhibiting ROS derived from CYP1A2-mediated metabolism than that originating from uncoupled CPR activity.
This study has shown that HO-1 expression was associated with lower CYP1A2 activity and lower NADPH-dependent ROS production by rat liver microsomes. Thus, the data are consistent with a hypothesis in which the HO-1 can modulate CYP1A2 activity to limit cellular exposure to ROS and deleterious, electrophilic P450 metabolites.
Acknowledgments
These studies were supported by a US Public Health Services research grants from the National Institute of Environmental Health Sciences, R01-ES004344, and P42-ES013648. We also thank Dr. Kristopher Krausz at the NIH (Bethesda, MD) for providing a CYP1A2 antibody.
Abbreviations
- HO-1
heme oxygenase 1
- P450
cytochrome P450
- CYP1A2
cytochrome P450 1A2
- CPR
cytochrome P450 reductase
- ROS
reactive oxygen species
- BNF
β-naphthoflavone
- 7ERF
7-ethoxyresorufin
References
- 1.Ryter SW, Otterbein LE, Morse D, Choi AM. Heme oxygenase/carbon monoxide signaling pathways: regulation and functional significance. Mol Cell Biochem. 2002;234–235(1–2):249–263. doi: 10.1023/A:1015957026924. [DOI] [PMC free article] [PubMed] [Google Scholar]
- 2.Parfenova H, Leffler CW. Cerebroprotective functions of HO-2. Curr Pharm Des. 2008;14(5):443–453. doi: 10.2174/138161208783597380. [DOI] [PMC free article] [PubMed] [Google Scholar]
- 3.Abraham NG, Mitrione SM, Hodgson WJ, Levere RD, Shibahara S. Expression of heme oxygenase in hemopoiesis. Adv Exp Med Biol. 1988;241:97–116. doi: 10.1007/978-1-4684-5571-7_13. [DOI] [PubMed] [Google Scholar]
- 4.Tenhunen R, Marver HS, Schmid R. Microsomal heme oxygenase. Characterization of the enzyme. J Biol Chem. 1969;244(23):6388–6394. [PubMed] [Google Scholar]
- 5.Keyse SM, Tyrrell RM. Heme oxygenase is the major 32-kDa stress protein induced in human skin fibroblasts by UVA radiation, hydrogen peroxide, and sodium arsenite. Proc Natl Acad Sci U S A. 1989;86(1):99–103. doi: 10.1073/pnas.86.1.99. [DOI] [PMC free article] [PubMed] [Google Scholar]
- 6.Shibahara S, Müller RM, Taguchi H. Transcriptional control of rat heme oxygenase by heat shock. J Biol Chem. 1987;262(27):12889–12892. [PubMed] [Google Scholar]
- 7.Chang SH, Barbosa-Tessman I, Chen C, Kilberg MS, Agarwal A. Glucose deprivation indues heme oxygenase-1 gene expression by a pathway independent of the unfloded protein response. J Biol Chem. 2002;277:1933–1940. doi: 10.1074/jbc.M108921200. [DOI] [PubMed] [Google Scholar]
- 8.Liu XM, Peyton KJ, Ensenat D, Wang H, Schafer AI, Alam J, Durante W. Endoplasmic reticulum stress stimulates heme oxygenase-1 gene expression in vascular smooth muscle. Role in cell survival. J Biol Chem. 2005;280:872–877. doi: 10.1074/jbc.M410413200. [DOI] [PubMed] [Google Scholar]
- 9.Caltabiano MM, Koestler TP, Poste G, Grieg RG. Induction of 32- and 34-kDa stress proteins bysodium arsenite, heavy metals, and thiol-reactive agents. J Biol Chem. 1986;261:13381–13386. [PubMed] [Google Scholar]
- 10.Rizzardini M, Terao M, Falcini F, Cantoni L. Cytokine induction of haem oxygenase mRNA in mouse liver. Interleukin 1 transcriptionally activates the haem oxygenase gene. Biochem J. 1993;290:343–347. doi: 10.1042/bj2900343. [DOI] [PMC free article] [PubMed] [Google Scholar]
- 11.Ryter SW, Alam J, Choi MK. Heme oxygenase-1/carbon monoxide: From basic science to therapeutic applications. Physiol Rev. 2006;86:583–650. doi: 10.1152/physrev.00011.2005. [DOI] [PubMed] [Google Scholar]
- 12.Bauer M, Bauer I. Heme oxygenase-1: Redox Regulation and Role in the Hepatic Response to Oxidative Stress. Antioxid Redox Signal. 2002;4(5):749–758. doi: 10.1089/152308602760598891. [DOI] [PubMed] [Google Scholar]
- 13.Takahashi T, Morita K, Akagi R, Sassa S. Heme oxygenase-1: A novel therapeutic target in oxidative tissue injuries. Curr Med Chem. 2004;11:1545–1561. doi: 10.2174/0929867043365080. [DOI] [PubMed] [Google Scholar]
- 14.Poss KD, Tonegawa S. Reduced stress defense in heme oxygenase-1 deficient cells. Proc Natl Acad Sci U S A. 1997;94:10925–10930. doi: 10.1073/pnas.94.20.10925. [DOI] [PMC free article] [PubMed] [Google Scholar]
- 15.Yachie A, Niida Y, Wada T, Igarashi N, Kaneda H, Toma T, Ohta K, Kasahara Y, Koizumi S. Oxidative stress causes enhanced endothelial cell injury in human heme oxygenase-1 deficiency. J Clin Invest. 1999;103(1):129–135. doi: 10.1172/JCI4165. [DOI] [PMC free article] [PubMed] [Google Scholar]
- 16.Otterbein LE, Kolls JK, Mantell LL, Cook JL, Alam J, Choi AM. Exogenous administration of heme oxygenase-1 by gene transfer provides protection against hyperoxia-induced lung injury. J Clin Invest. 1999;103:1047–1054. doi: 10.1172/JCI5342. [DOI] [PMC free article] [PubMed] [Google Scholar]
- 17.Yang L, Quan S, Abraham NG. Retrovirus-mediated HO gene transfer into endothelial cells protects against oxidant-induced injury. Am J Physiol. 1999;277(1):127–133. doi: 10.1152/ajplung.1999.277.1.L127. [DOI] [PubMed] [Google Scholar]
- 18.Amersi F, Buelow R, Kato H, Ke B, Coito AJ, Shen XD, Zhao D, Zaky J, Melinek J, Lassman CR, Kolls JK, Alam J, Ritter T, Volk HD, Farmer DG, Ghobrial RM, Busuttil RW, Kupiec-Weglinski JW. Upregulation of heme oxygenase-1 protects genetically fat Zucker rat livers from ischemia/reperfusion injury. J Clin Invest. 1999;104(11):1631–1639. doi: 10.1172/JCI7903. [DOI] [PMC free article] [PubMed] [Google Scholar]
- 19.Abraham NG, Lin JH, Schwartzmann ML, Levere RD, Shibahara S. The physiologocal significance of heme oxygenase. Int J Biochem. 1988;20:543–558. doi: 10.1016/0020-711x(88)90093-6. [DOI] [PubMed] [Google Scholar]
- 20.Vincent SH. Oxidative effects of heme and porphyrins on proteins and lipids. Semin Hematol. 1989;26:105–113. [PubMed] [Google Scholar]
- 21.Gutteridge JM, Smith A. Antioxidant protection by haemopexin of haem-stimulated lipid peroxidation. Biochem J. 1988;256:861–865. doi: 10.1042/bj2560861. [DOI] [PMC free article] [PubMed] [Google Scholar]
- 22.Stocker R, Yamamoto Y, McDonagh AF, Glazer AN, Ames BN. Bilirubin is an antioxidant of possible physiological importance. Science. 1987;235(4792):1043–1046. doi: 10.1126/science.3029864. [DOI] [PubMed] [Google Scholar]
- 23.Stocker R, Peterhans E. Antioxidant properties of conjugated bilirubin and biliverdin: biologically relevant scavenging of hypochlorous acid. Free Radical Res Commun. 1989;6:57–66. doi: 10.3109/10715768909073428. [DOI] [PubMed] [Google Scholar]
- 24.White RE, Coon MJ. Oxygen activation by cytochrome P-450. Annu Rev Biochem. 1980;49:315–356. doi: 10.1146/annurev.bi.49.070180.001531. [DOI] [PubMed] [Google Scholar]
- 25.Guengerich FP. Cytochrome P450 oxidations in the generation of reactive electrophiles: epoxidation and related reactions. Arch Biochem Biophys. 2003;409(1):59–71. doi: 10.1016/s0003-9861(02)00415-0. [DOI] [PubMed] [Google Scholar]
- 26.Guengerich FP, Ueng YF, Kim BR, Langouet S, Coles B, Iyer RS, Thier R, Harris TM, Shimada T, Yamazaki H, Ketterer B, Guillouzo A. Activation of toxic chemicals by cytochrome p450 enzymes - Regio- and stereoselective oxidation of aflatoxin B1. Advances in Experimental Medicine and Biology. 1996;387:7–15. doi: 10.1007/978-1-4757-9480-9_2. [DOI] [PubMed] [Google Scholar]
- 27.Loida PJ, Sligar SG. Molecular recognition in cytochrome P-450: mechanism for the control of uncoupling reactions. Biochem. 1993;32(43):11530–11538. doi: 10.1021/bi00094a009. [DOI] [PubMed] [Google Scholar]
- 28.Odaka Y, Takahashi T, Yamasaki A, Suzuki T, Fujiwara T, Yamada T, Hirakawa M, Fujita H, Ohmori E, Akagi R. Prevention of halothane-induced hepatotoxicity by hemin pretreatment: protective role of heme oxygenase-1 induction. Biochem Pharmacol. 2000;59(7):871–880. doi: 10.1016/s0006-2952(99)00386-x. [DOI] [PubMed] [Google Scholar]
- 29.Chiu H, Brittingham JA, Laskin DL. Differential induction of heme oxygenase-1 in macrophages and hepatocytes during acetaminophen-induced hepatotoxicity in the rat: effects of hemin and biliverdin. Toxicol Appl Pharmacol. 2002;181(2):106–115. doi: 10.1006/taap.2002.9409. [DOI] [PubMed] [Google Scholar]
- 30.Nakahira K, Takahashi T, Shimizu H, Maeshima K, Uehara K, Fujii H, Nakatsuka H, Yokoyama M, Akagi R, Morita K. Protective role of heme oxygenase-1 induction in carbon tetrachloride-induced hepatotoxicity. Biochem Pharmacol. 2003;66(6):1091–1105. doi: 10.1016/s0006-2952(03)00444-1. [DOI] [PubMed] [Google Scholar]
- 31.Gong P, Cederbaum AI, Nieto N. Heme Oxygenase-1 Protects HEPG2 Cells against Cytochrome P450 2E1-dependent Toxicity. Free Radical Biology and Medicine. 2004;36(3):307–318. doi: 10.1016/j.freeradbiomed.2003.10.017. [DOI] [PubMed] [Google Scholar]
- 32.Peterson JA, Ebel RE, O’Keeffe DH, Matsubara T, Estabrook RW. Temperature dependence of cytochrome P-450 reduction. A model for NADPH-cytochrome P-450 reductase:cytochrome P-450 interaction. J Biol Chem. 1976;251:4010–4016. [PubMed] [Google Scholar]
- 33.Huber WJ, III, Backes WL. Expression and characterization of full-length human heme oxygenase-1: the presence of intact membrane-binding region leads to increased binding affinity for NADPH cytochrome P450 reductase. Biochem. 2007;46(43):12212–12219. doi: 10.1021/bi701496z. [DOI] [PMC free article] [PubMed] [Google Scholar]
- 34.Huber WJ, III, Marohnic CC, Peters M, Alam J, Reed JR, Masters BS, Backes WL. Measurement of membrane-bound human heme oxygenase-1 activity using a chemically defined assay system. Drug Metab Dispos. 2009;37(4):857–864. doi: 10.1124/dmd.108.025023. [DOI] [PMC free article] [PubMed] [Google Scholar]
- 35.Backes WL, Batie CJ, Cawley GF. Interactions among P450 enzymes when combined in reconstituted systems: formation of a 2B4–1A2 complex with a high affinity for NADPH-cytochrome P450 reductase. Biochem. 1998;37(37):12852–12859. doi: 10.1021/bi980674a. [DOI] [PubMed] [Google Scholar]
- 36.Kutty RK, Daniel RF, Ryan DE, Levin W, Maines MD. Rat liver cytochrome P-450b, P-420b, and P-450c are degraded to biliverdin by heme oxygenase. Arch Biochem Biophys. 1988;260(2):638–644. doi: 10.1016/0003-9861(88)90492-4. [DOI] [PubMed] [Google Scholar]
- 37.Bissell DM, Hammaker LE. Cytochrome P-450 Heme and the regulation of hepatic heme oxygenase activity. Arch Biochem Biophys. 1976;176(1):91–102. doi: 10.1016/0003-9861(76)90144-2. [DOI] [PubMed] [Google Scholar]
- 38.Cawley GF, Zhang S, Kelley RW, Backes WL. Evidence supporting the interaction of CYP2B4 and CYP1A2 in microsomal preparations. Drug Metab Dispos. 2001;29(12):1529–1534. [PubMed] [Google Scholar]
- 39.Omura T, Sato R. The carbon monoxide-binding pigment of liver microsomes: II. Solubilization, purification, and properties. J Biol Chem. 1964;239(7):2379–2385. [PubMed] [Google Scholar]
- 40.Schacter BA, Nelson EB, Marver HS, Masters BS. Immunochemical evidence for an association of heme oxygenase with the microsomal electron transport system. J Biol Chem. 1972;247(11):3601–3607. [PubMed] [Google Scholar]
- 41.Hildebrandt AG, Roots I, Tjoe M, Heinemeyer G. Hydrogen peroxide in hepatic microsomes. Methods Enzymol. 1978;52:342–350. doi: 10.1016/s0076-6879(78)52037-5. [DOI] [PubMed] [Google Scholar]
- 42.Hanna IH, Reed JR, Guengerich FP, Hollenberg PF. Expression of human cytochrome P450 2B6 in Escherichia coli: characterization of catalytic activity and expression levels in human liver. Arch Biochem Biophys. 2000;376(1):206–216. doi: 10.1006/abbi.2000.1708. [DOI] [PubMed] [Google Scholar]
- 43.Klein SM, Cohen G, Cederbaum AI. Production of formaldehyde during metabolism of dimethyl sulfoxide by hydroxyl radical generating systems. Biochem. 1981;20(21):6006–6012. doi: 10.1021/bi00524a013. [DOI] [PubMed] [Google Scholar]
- 44.Burke MD, Thompson S, Elcombe JR, Halpert J, Haaparanta T, Mayer RT. Ethoxy-. Pentoxy-and Benzyloxyphenoxazones and Homologues: A Series of Substrates to Distinguish Between Different Induced Cytochromes P-450. Biochem Pharmacol. 1985;34(18):3337–3345. doi: 10.1016/0006-2952(85)90355-7. [DOI] [PubMed] [Google Scholar]
- 45.Huber WJ, III, Scruggs B, Backes WL. C-Terminal Membrane Spanning Region of Human Heme Oxygenase-1 Mediates a Time Dependent Complex Formation with Cytochrome P450 Reductase. Biochem. 2009;48(1):190–197. doi: 10.1021/bi801912z. [DOI] [PMC free article] [PubMed] [Google Scholar]
- 46.Klaassen CD. Effect of metallothionein on hepatic disposition of metals. Am J Physiol. 1978;234:E47–E53. doi: 10.1152/ajpendo.1978.234.1.E47. [DOI] [PubMed] [Google Scholar]
- 47.Immenschuh S, Kietzmann T, Hinke V, Wiederhold M, tz N, ller-Eberhard U. The rat heme oxygenase-1 gene is transcriptionally induced via the protein kinase A signaling pathway in rat hepatocyte cultures. Mol Pharmacol. 1998;53:483–491. doi: 10.1124/mol.53.3.483. [DOI] [PubMed] [Google Scholar]
- 48.Dundjerski J, Butorovic B, Kipic J, Trajkovic D, Matic G. Cadmium affects the activity of rat liver tyrosine aminotransferase and its induction by dexamethasone. Arch Toxicol. 1996;70(6):390–395. doi: 10.1007/s002040050290. [DOI] [PubMed] [Google Scholar]
- 49.Fridovich I. Superoxide radical: an endogenous toxicant. Ann Rev Pharmacol Toxicol. 1983;23:239–257. doi: 10.1146/annurev.pa.23.040183.001323. [DOI] [PubMed] [Google Scholar]
- 50.Dutton DR, Parkinson A. Reduction of 7-alkoxyresorufins by NADPH-cytochrome P450 reductase and its differential effects on their O-dealkylation by rat liver microsomal cytochrome P450. Arch Biochem Biophys. 1989;268:617–629. doi: 10.1016/0003-9861(89)90329-9. [DOI] [PubMed] [Google Scholar]
- 51.Winston GW, Cederbaum AI. NADPH-dependent production of oxy radicals by purified components of the rat liver mixed function oxidase system. II. Role in microsomal oxidation of ethanol. J Biol Chem. 1983;258(3):1514–1519. [PubMed] [Google Scholar]
- 52.Winston GW, Harvey W, Berl L, Cederbaum AI. The generation of hydroxyl and alkoxyl radicals from the interaction of ferrous bipyridyl with peroxides. Biochem J. 1983;216(2):415–421. doi: 10.1042/bj2160415. [DOI] [PMC free article] [PubMed] [Google Scholar]
- 53.Winston GW, Cederbaum AI. NADPH-dependent production of oxy radicals by purified components of the rat liver mixed function oxidase system. I. Oxidation of hydroxyl radical scavenging agents. J Biol Chem. 1983;258(3):1508–1513. [PubMed] [Google Scholar]
- 54.Cash TP, Pan Y, Simon MC. Reactive oxygen species and cellular oxygen sensing. Free Rad Biol Med. 2007;43(9):1219–1225. doi: 10.1016/j.freeradbiomed.2007.07.001. [DOI] [PMC free article] [PubMed] [Google Scholar]
- 55.Han D, Williams E, Cadenas E. Mitochondrial respiratory chain-dependent generation of superoxide anion and its release into the intermembrane space. Biochem J. 2001;353:411–416. doi: 10.1042/0264-6021:3530411. [DOI] [PMC free article] [PubMed] [Google Scholar]
- 56.Gruenke LD, Konopka K, Cadieu M, Waskell L. The Stoichiometry of the Cytochrome P-450-catalyzed Metabolism of Methoxyflurane and Benzphetamine in the Presence and Absence of Cytochrome b(5) J Biol Chem. 1995;270(42):24707. doi: 10.1074/jbc.270.42.24707. [DOI] [PubMed] [Google Scholar]
- 57.Oprian DD, Gorsky LD, Coon MJ. Properties of the oxygenated form of liver microsomal cytochrome P-450. J Biol Chem. 1983;258(14):8684–8691. [PubMed] [Google Scholar]
- 58.Gorsky LD, Koop DR, Coon MJ. On the stoichiometry of the oxidase and monooxygenase reactions catalyzed by liver microsomal cytochrome P-450. Products of oxygen reduction. J Biol Chem. 1984;259(11):6812–6817. [PubMed] [Google Scholar]
- 59.Reed JR, Hollenberg PF. Examining the mechanism of stimulation of cytochrome P450 by cytochrome b5: the effect of cytochrome b5 on the interaction between cytochrome P450 2B4 and P450 reductase. J Inorg Biochem. 2003;97(3):265–275. doi: 10.1016/s0162-0134(03)00275-7. [DOI] [PubMed] [Google Scholar]
- 60.Lyakhovich V, Mishin V, Pokrovsky A. Relationship between the reduction of oxygen, artificial acceptors and cytochrome P-450 by NADPH--cytochrome c reductase. Biochem J. 1977;168(2):133–139. doi: 10.1042/bj1680133. [DOI] [PMC free article] [PubMed] [Google Scholar]
- 61.Venditti P, Daniele CM, De Leo T, Di Meo S. Effect of phenobarbital treatment on characteristics determining susceptibility to oxidants of homogenates, mitochondria and microsomes from rat liver. Cell Physiol Biochem. 1998;8(6):328–338. doi: 10.1159/000016294. [DOI] [PubMed] [Google Scholar]
- 62.Wu DF, Cederbaum AI. Ethanol cytotoxicity to a transfected HepG2 cell line expressing human cytochrome P4502E1. J Biol Chem. 1996;271:23914–23919. doi: 10.1074/jbc.271.39.23914. [DOI] [PubMed] [Google Scholar]
- 63.Premereur N, Van den Branden C, Roels F. Cytochrome P-450-dependent H2O2 production demonstrated in vivo. Influence of phenobarbital and allylisopropylacetamide. FEBS Lett. 1986;199(1):19–22. doi: 10.1016/0014-5793(86)81215-7. [DOI] [PubMed] [Google Scholar]
- 64.French JS, Guengerich FP, Coon MJ. Interactions of cytochrome P-450: NADPH-cytochrome P-450 reductase, phospholipid, and substrate in the reconstituted liver microsomal enzyme system. J Biol Chem. 1980;255(9):4112–4119. [PubMed] [Google Scholar]
- 65.Backes WL, Eyer CS. Cytochrome P-450 LM2 reduction. Substrate effects on the rate of reductase-LM2 association. J Biol Chem. 1989;264:6252–6259. [PubMed] [Google Scholar]
- 66.Kelley RW, Cheng D, Backes WL. Heteromeric Complex Formation between CYP2E1 and CYP1A2: Evidence for the Involvement of Electrostatic Interactions. Biochem. 2006;45(51):15807–15816. doi: 10.1021/bi061803n. [DOI] [PMC free article] [PubMed] [Google Scholar]