Abstract
Grid cells recorded in medial entorhinal cortex of freely moving rats exhibit firing at regular spatial locations and temporal modulation with theta rhythm oscillations (4–11 Hz). We analyzed grid cell spatial coding during reduction of network theta rhythm oscillations caused by medial septum (MS) inactivation with muscimol. During MS inactivation, grid cells lost their spatial periodicity, whereas head direction cells maintained their selectivity. Conjunctive grid-by-head-direction cells lost grid cell spatial periodicity but retained head direction specificity. All cells showed reduced rhythmicity in autocorrelations and cross-correlations. This supports the hypothesis that spatial coding by grid cells requires theta oscillations, and dissociates the mechanisms underlying generation of entorhinal grid cell periodicity and head direction selectivity.
The role of oscillations in neural coding is controversial. Theta frequency oscillations (4–11 Hz) play an important role in memory behavior (1–4) and code spatial location by the precession of spike timing relative to theta oscillations (theta phase precession) in the hippocampus (5, 6) and medial entorhinal cortex (MEC) (7). However, disagreement remains about whether theta oscillations are critical to spatial coding by neurons. Grid cells (8, 9) in the MEC provide a powerful example for testing the theoretical role of oscillations in neural coding. Some computational models of grid cells use network theta rhythm oscillations to generate grid cell spatial periodicity (10, 11). These models simulate the phase of spike timing in grid cells (7) and have successfully predicted that the spatial scale of grid cell firing correlates with measures of intrinsic rhythmicity (12, 13). Recent models also show the potential role of theta oscillations for updating position in attractor dynamic models of grid cells (14). We tested the role of theta rhythm oscillations in the spatial coding of grid cells by testing the spatial periodicity of grid cells during pharmacological disruption of theta rhythm oscillations.
Lesions or inactivation of the MS cause a disruption of theta oscillations in the entorhinal-hippocampal system (2, 4, 15, 16) and cause spatial memory impairments (1–4, 17, 18). We performed microinfusions of muscimol to pharmacologically inactivate the MS bilaterally (1, 17). Simultaneously, we used tetrodes in MEC to monitor the spiking activity of grid cells, head direction cells, and conjunctive grid-by-head-direction cells.
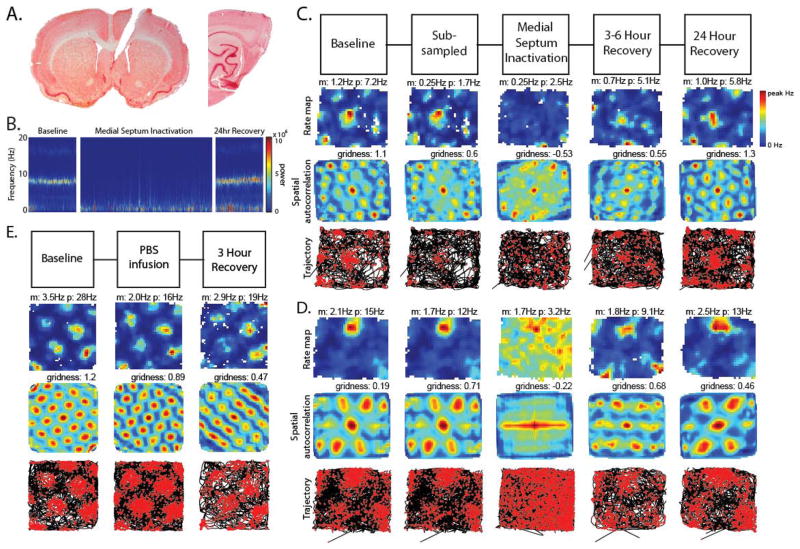
Following infusions of muscimol into the MS (Fig. 1a, left), recordings in the MEC (Fig. 1a, right) demonstrated a clear decrease in the power of theta oscillations in the MEC local field potential (Fig. 1b) and a strong reduction in the spatial periodicity of grid cells (Fig. 1 c,d, fig S3).
Fig. 1.
Loss of grid cell spatial periodicity during reduced theta rhythm oscillations. A. Left: Muscimol infusions were delivered via a cannula in MS. Right: Tetrode tracks show location of recording in MEC. B. Spectrogram of MEC local field potential showing loss of pre-infusion theta peak after infusion. C. Column 1: grid cell firing before infusion (Baseline). m:mean rate, p:peak rate. Column 2: subsampling of pre-infusion firing rate to match rate 15–75 minutes after infusion. Column 3: grid cell firing 15–75 minutes after muscimol infusion (MS Inactivation) demonstrating loss of grid cell spatial periodicity during reduced theta. Columns 4 and 5: recovery 3–6 hours (3–6 Hour Recovery) and 24 hours (24 Hour Recovery) after infusion. Row 1: Firing rate maps, Row 2: autocorrelation maps, Row 3: animal trajectory with spikes (red dots). D. Example of another grid cell before and after infusion. E. Example of grid cell firing before and after control infusion of phosphate-buffered saline (PBS).
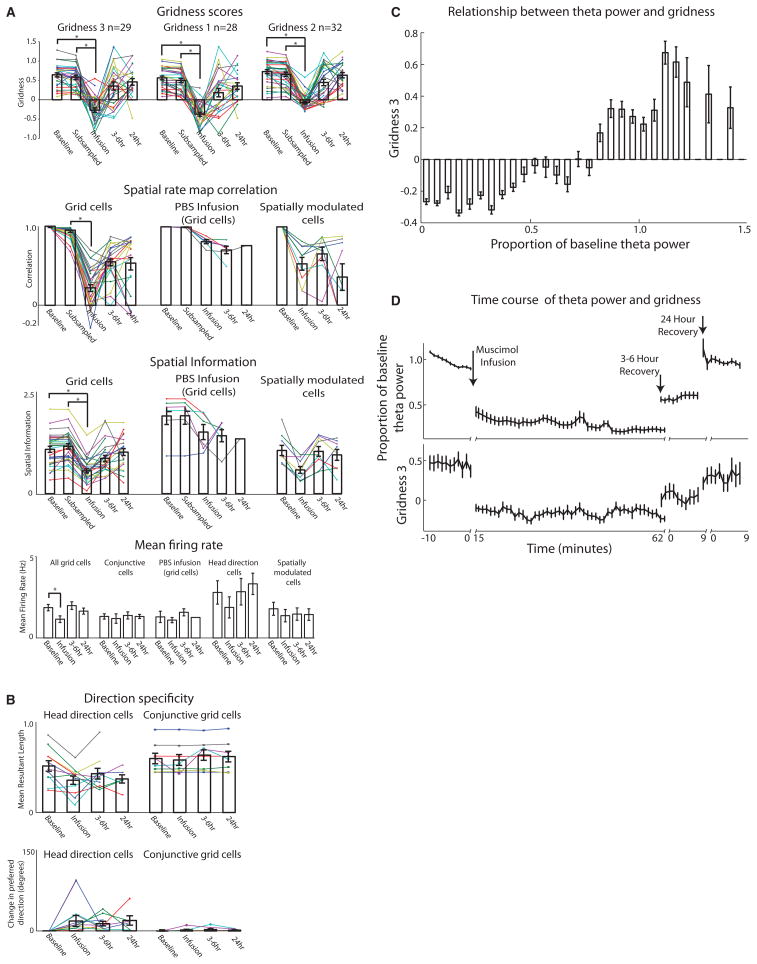
Recovery of theta rhythm and spatial periodicity occurred in recordings 3–6 hours and 24 hours after the infusion. The gridness score measured before the MS inactivation showed a significant decrease after the inactivation (n = 29, baseline: mean ± standard error: 0.64 ± 0.05 gridness score, inactivation: −0.27 ± 0.06 gridness score, p < 0.001) (Fig 3a) that recovered at 3–6 hours and 24 hours (3–6 hour: n = 26, 0.35 ± 0.10 gridness score; 24 hour: n = 21, 0.46 ± 0.09 gridness score). Because the firing rates of grid cells were also reduced (n = 29, baseline: 1.88 ± 0.20 Hz, inactivation: 1.17 ± 0.21 Hz, p < 0.001), we subsampled the spiking of the baseline recordings before infusion to match the same overall firing rate after infusion to confirm that the reduction of gridness still appeared when compared to subsampled data (n = 29, subsampled: 0.58 ± 0.05 gridness score, inactivation: −0.27 ± 0.06 gridness score, p < 0.001)(column 2 in Fig. 1c, d; fig. S3). There were no differences in running speeds between the baseline, MS inactivation, 3–6 hour or 24 hour recovery periods (Fig. 4c, fig S8). Control infusions of PBS into the MS did not alter theta oscillations or the grid cell spiking patterns in the MEC (Fig. 1e, fig. S7).
Fig. 3.
Statistics for grid cells, head direction cells, and spatially modulated cells. A. Top: Three gridness measures show a sharp reduction in gridness 15–75 minutes after muscimol infusion (MS Inactivation), with recovery at 3–6 hours (3–6hr) and 24 hours (24hr) after infusion. Middle: Spatial map correlations and spatial information for grid cells, PBS infusions, and spatially modulated cells for each period. Bottom: Average firing rate during each period for all cell types. B. Head direction cell statistics. Mean resultant length and change in head direction preference angle from baseline (in degrees) for all head direction cells and conjunctive cells during each period. C. Average gridness score at different levels of theta power. Notice the consistent relationship between gridness and theta power. D. Time course of effect of MS inactivation on theta power and gridness score computed in sliding 10 minute window at one minute intervals for each period during experiment showing similar reduction and recovery.
Fig. 4.
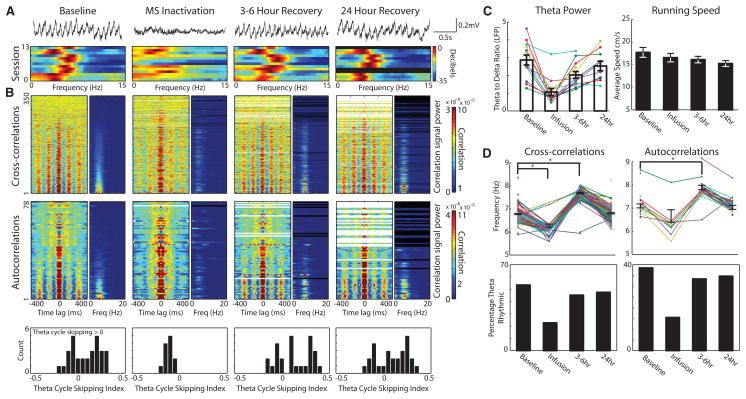
Temporal coordination of local field potential and spike-timing disrupted during MS inactivation. A. Top: Raw EEG shows reduction of theta rhythm during MS inactivation. Bottom: Power spectrum of MEC local field potential for 13 sessions during periods before (Baseline), 15–75 minutes (MS inactivation), 3–6 hours and 24 hours after infusion. B. For each period, left graph shows temporal cross-correlations ordered by the ratio Powertheta/Powersignal. Right graph shows respective power spectra. Reduction in theta power after infusion in cross-correlations suggests loss of timing relationships between cells. Note decrease in frequency during MS inactivation. Middle: Temporal autocorrelations of spiking show reduction in theta power and frequency during MS inactivation. Bottom: Theta cycle skipping index for all theta rhythmic neurons for each period. Index greater than zero indicates second peak in autocorrelation is larger than first peak. Theta skipping is lost during MS inactivation. C. Left: Theta power (ratio between power in theta and delta band) decreases during MS inactivation. Right: Average running speed for each period did not change during infusion. D. Top: Cross-correlation and autocorrelation frequency for each cell pair or cell during each period shows reduction in frequency during MS inactivation and increase 3–6 hours after infusion. Bottom: Percentage of cells showing theta rhythmicity in cross-correlations and autocorrelations during each period. Note reduction of theta rhythmic cells and cell pairs during MS inactivation.
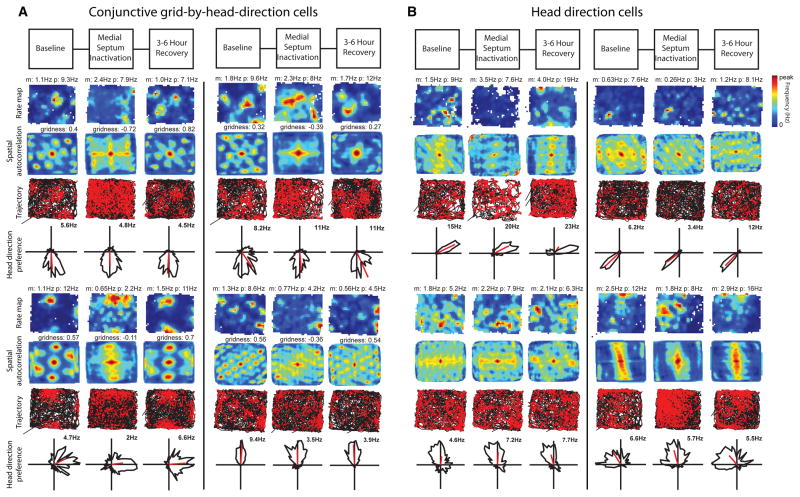
Many neurons in the MEC are conjunctive grid-by-head-direction cells (19, 20), head direction cells (19, 21), or cells showing spatial selectivity without grid cell periodicity such as border cells (22, 23). We observed a dissociation in the effect of MS inactivation on the spatial periodicity and head direction specificity of entorhinal neurons. After muscimol infusion, conjunctive grid-by-head-direction cells fired with reduced spatial periodicity (Fig. 2a, fig. S3), but retained their directional preference, φ (n = 8, 1.72 ± 1.15 |Δφ| degrees, n.s.) (Fig. 2a, fig. S3). After infusion, head direction cells retained their directionality (n = 11, baseline: 37.89 ± 8.9 Watson U2 statistic, inactivation: 39.55 ± 14.54 Watson U2 statistic, n.s.; 24.64 ± 9.17 |Δφ| degrees, n.s.) (Fig. 2b, 3b, fig. S4) and as a population retained their firing rates (n = 11, baseline: 2.7 ± 0.72 Hz, inactivation: 1.9 ± 0.65 Hz, n.s.) (Fig. 3b). Cells with positive gridness scores showed a reduction of spatial information (grid cells: n = 29, baseline: 1.08 ± 0.07 bits/spike, inactivation: 0.56 ± 0.05 bits/spike, p < 0.001) (Fig. 3a, fig. S5). Cells with negative gridness scores but high spatial information also showed a reduction of spatial information (spatially modulated non-grid cells: n = 9, baseline: 1.3 ± 0.15 bits/spike, inactivation: 0.70 ± 0.10 bits/spike).
Fig. 2.
Head direction selectivity is spared. A. Examples of four conjunctive grid-by-head-direction cells. The selectivity for head direction observed before infusion (Baseline) remains during MS inactivation despite the loss of grid cell spatial periodicity in the spatial maps. B. Four head direction selective cells without spatial periodicity before infusion (Baseline) maintain head direction preference during MS inactivation. Note that overall firing rates are not reduced in either cell type.
The slow onset and long half-life that is characteristic of muscimol effects (1, 17) permitted us to quantify the relationship between theta power and grid cell spiking. Using 10 minute sliding window calculations we found a clear similarity in the timecourse between theta power and gridness (Fig. 3d) and a consistent relationship between the power of theta and the gridness score (Fig. 3c). Could a drift in spatial phase or orientation explain the loss of the grid pattern after infusion? Across all of our recording sessions large gridness scores did not appear during periods of low theta index (Fig. 3c,d). A drifting grid cell representation would usually maintain the relative spike timing between simultaneously recorded grid cells. When multiple grid cells were recorded, they often showed rhythmic peaks in their spike time cross-correlations that were reduced or eliminated during MS inactivation (Fig. 4b) as shown by the reduction of power in the theta rhythm in cross-correlations, suggesting a reduction of temporal consistency. During MS inactivation, the cross-correlation plots reveal a reduction in percentage of theta rhythmic cells (baseline: 53%, inactivation: 23%, n = 350) and theta power ratio (baseline: 3.4 ± 0.01, inactivation: 0.23 ± 0.01, n = 187, p < 0.001). Autocorrelation plots show a reduced percentage of theta rhythmic cells (baseline: 38%, inactivation: 15%, n = 78); and autocorrelation theta power ratio (baseline: 4.1 ± 0.35, inactivation: 1.37 ± 0.21, n = 30, p < 0.001). A decrease in the frequency of remaining theta rhythmic cells appeared in both cross-correlations (n = 62, baseline: 6.83 ± 0.02, inactivation: 6.34 ± 0.06, p < 0.001) and autocorrelations (n = 10, baseline: 7.10 ± 0.08, inactivation: 6.66 ± 0.27) (Fig. 4b,d). The frequency increase at 3–6 hours (Fig. 4d) may arise from rebound of currents after inactivation. Some autocorrelation plots also exhibited theta-skipping (24) during control conditions (Fig. 4b), yet lost this attribute during MS inactivation (baseline: n = 30, 60% of theta rhythmic cells, inactivation: n = 13, 0% of theta rhythmic cells; theta skipping index, n = 12, baseline: .08 ± .03, inactivation: −.12 ± .01, p < 0.001).
These results are complementary to the results obtained independently in the companion paper (25). The use of muscimol here demonstrates the correlated reduction of theta power and gridness score over a long time course, and the use of lidocaine in the companion paper shows the relationship on a faster time course. The recording in deeper layers of entorhinal cortex here demonstrates the sparing of head direction selectivity in conjunctive cells and in pure head direction cells, and the companion paper shows the sparing of hippocampal place cell specificity consistent with previous studies (26). Our data show a reduction of rhythmicity in temporal cross-correlations between simultaneously recorded neurons during MS inactivation. The combined data suggest that grid cell spatial periodicity is not essential for place cell responses in familiar environments, consistent with studies suggesting that development of place cell responses does not depend upon development of grid cell responses (27, 28).
These data support the hypothesized role of theta rhythm oscillations in the generation of grid cell spatial periodicity (10–12) or at least a role of MS input. The loss of grid cell spatial periodicity could contribute to the spatial memory impairments caused by lesions (3, 4, 18, 29) or inactivation (1, 2, 17) of the MS. These data support a role of neuronal oscillations in the coding of spatial information.
Supplementary Material
Acknowledgments
Thanks to Chantal Stern, Stefan Leutgeb, Howard Eichenbaum, Nathan Schultheiss, Ehren Newman, Caitlin Monaghan, Jason Climer and Eric Zilli for advice and comments and to Tyler Ware for technical assistance. Research supported by NIMH R01 MH60013 and MH61492 and ONR MURI grant N00014-10-1-0936.
Footnotes
www.sciencemag.org, Materials and Methods, Supplementary Text, Figs S1-S8.
References
- 1.Givens B, Olton DS. J Neurosci. 1994 Jun;14:3578. doi: 10.1523/JNEUROSCI.14-06-03578.1994. [DOI] [PMC free article] [PubMed] [Google Scholar]
- 2.Mizumori SJ, Perez GM, Alvarado MC, Barnes CA, McNaughton BL. Brain Res. 1990 Sep 24;528:12. doi: 10.1016/0006-8993(90)90188-h. [DOI] [PubMed] [Google Scholar]
- 3.Winson J. Science. 1978 Jul 14;201:160. doi: 10.1126/science.663646. [DOI] [PubMed] [Google Scholar]
- 4.Mitchell SJ, Rawlins JN, Steward O, Olton DS. J Neurosci. 1982 Mar;2:292. doi: 10.1523/JNEUROSCI.02-03-00292.1982. [DOI] [PMC free article] [PubMed] [Google Scholar]
- 5.O’Keefe J, Recce ML. Hippocampus. 1993;3:317. doi: 10.1002/hipo.450030307. [DOI] [PubMed] [Google Scholar]
- 6.Skaggs WE, McNaughton BL, Wilson MA, Barnes CA. Hippocampus. 1996;6:149. doi: 10.1002/(SICI)1098-1063(1996)6:2<149::AID-HIPO6>3.0.CO;2-K. [DOI] [PubMed] [Google Scholar]
- 7.Hafting T, Fyhn M, Bonnevie T, Moser MB, Moser EI. Nature. 2008 Jun 26;453:1248. doi: 10.1038/nature06957. [DOI] [PubMed] [Google Scholar]
- 8.Moser EI, Moser MB. Hippocampus. 2008;18:1142. doi: 10.1002/hipo.20483. [DOI] [PubMed] [Google Scholar]
- 9.Fyhn M, Molden S, Witter MP, Moser EI, Moser MB. Science. 2004 Aug 27;305:1258. doi: 10.1126/science.1099901. [DOI] [PubMed] [Google Scholar]
- 10.Burgess N, Barry C, O’Keefe J. Hippocampus. 2007;17:801. doi: 10.1002/hipo.20327. [DOI] [PMC free article] [PubMed] [Google Scholar]
- 11.O’Keefe J, Burgess N. Hippocampus. 2005;15:853. doi: 10.1002/hipo.20115. [DOI] [PMC free article] [PubMed] [Google Scholar]
- 12.Giocomo LM, Zilli EA, Fransen E, Hasselmo ME. Science. 2007 Mar 23;315:1719. doi: 10.1126/science.1139207. [DOI] [PMC free article] [PubMed] [Google Scholar]
- 13.Jeewajee A, Barry C, O’Keefe J, Burgess N. Hippocampus. 2008;18:1175. doi: 10.1002/hipo.20510. [DOI] [PMC free article] [PubMed] [Google Scholar]
- 14.Navratilova Z, Giocomo LM, Fellous JM, Hasselmo ME, McNaughton BL. Hippocampus. 2010 doi: 10.1002/hipo.20939. in press. [DOI] [PubMed] [Google Scholar]
- 15.Rawlins JN, Feldon J, Gray JA. Exp Brain Res. 1979 Sep;37:49. doi: 10.1007/BF01474253. [DOI] [PubMed] [Google Scholar]
- 16.Jeffery KJ, Donnett JG, O’Keefe J. Neuroreport. 1995 Nov 13;6:2166. doi: 10.1097/00001756-199511000-00017. [DOI] [PubMed] [Google Scholar]
- 17.Chrobak JJ, Stackman RW, Walsh TJ. Behav Neural Biol. 1989;52:357. doi: 10.1016/s0163-1047(89)90472-x. [DOI] [PubMed] [Google Scholar]
- 18.Martin MM, Horn KL, Kusman KJ, Wallace DG. Physiol Behav. 2007 Feb 28;90:412. doi: 10.1016/j.physbeh.2006.10.007. [DOI] [PubMed] [Google Scholar]
- 19.Sargolini F, et al. Science. 2006 May 5;312:758. doi: 10.1126/science.1125572. [DOI] [PubMed] [Google Scholar]
- 20.Boccara CN, et al. Nat Neurosci. 2010 Aug;13:987. doi: 10.1038/nn.2602. [DOI] [PubMed] [Google Scholar]
- 21.Taube JS, Muller RU, Ranck JB., Jr J Neurosci. 1990 Feb;10:420. doi: 10.1523/JNEUROSCI.10-02-00420.1990. [DOI] [PMC free article] [PubMed] [Google Scholar]
- 22.Lever C, Burton S, Jeewajee A, O’Keefe J, Burgess N. J Neurosci. 2009 Aug 5;29:9771. doi: 10.1523/JNEUROSCI.1319-09.2009. [DOI] [PMC free article] [PubMed] [Google Scholar]
- 23.Solstad T, Boccara CN, Kropff E, Moser MB, Moser EI. Science. 2008 Dec 19;322:1865. doi: 10.1126/science.1166466. [DOI] [PubMed] [Google Scholar]
- 24.Deshmukh SS, Yoganarasimha D, Voicu H, Knierim JJ. J Neurophysiol. 2010 Aug;104:994. doi: 10.1152/jn.01141.2009. [DOI] [PMC free article] [PubMed] [Google Scholar]
- 25.Koenig J, Linder AN, Leutgeb JK, Leutgeb S. 2011 submitted. [Google Scholar]
- 26.Mizumori SJ, McNaughton BL, Barnes CA, Fox KB. J Neurosci. 1989;9:3915. doi: 10.1523/JNEUROSCI.09-11-03915.1989. [DOI] [PMC free article] [PubMed] [Google Scholar]
- 27.Langston RF, et al. Science. 2010 Jun 18;328:1576. doi: 10.1126/science.1188210. [DOI] [PubMed] [Google Scholar]
- 28.Wills TJ, Cacucci F, Burgess N, O’Keefe J. Science. 2010 Jun 18;328:1573. doi: 10.1126/science.1188224. [DOI] [PMC free article] [PubMed] [Google Scholar]
- 29.Pang KC, Nocera R. Behav Neurosci. 1999 Apr;113:265. doi: 10.1037//0735-7044.113.2.265. [DOI] [PubMed] [Google Scholar]
Associated Data
This section collects any data citations, data availability statements, or supplementary materials included in this article.


