Abstract
Objective
The L-type Ca2+ current (ICa,L) and the Na+/Ca2+ exchange current (INCX) are major inward currents that shape the cardiac action potential (AP). Previously, the profile of these currents during AP was determined from voltage-clamp experiments that used Ca2+ buffer. In this study, we aimed to obtain direct experimental measurement of these currents during cardiac AP with Ca2+ cycling.
Method
A newly developed AP-clamp sequential dissection method was used to record ionic currents in guinea pig ventricular myocytes under a triad of conditions: using the cell’s own AP as the voltage command, using internal and external solutions that mimic the cell’s ionic composition and, importantly, no exogenous Ca2+ buffer was used.
Results
The nifedipine-sensitive current (INIFE), which is composed of ICa,L and INCX, revealed hitherto unreported features during AP with Ca2+ cycling in the cell. We identified two peaks in the current profile followed by a long residual current extending beyond the AP, coinciding with a residual depolarization. The second peak and the residual current become apparent only when Ca2+ is not buffered. Pharmacological dissection of INIFE using SEA0400 shows that ICa,L is dominant during phase-1&2 whereas INCX contributes significantly to the inward current at phase-3&4 of AP.
Conclusion
These data provide the first direct experimental visualization of ICa,L and INCX during cardiac AP and Ca2+ cycle. The residual current reported here can serve as a potential substrate for afterdepolarizations when increased under pathologic conditions.
Keywords: Cardiac, ventricular, myocyte, action potential, L-type Ca2+ channel, Na+/Ca2+ exchanger, arrhythmia
Introduction
The L-type Ca2+ current (ICa,L) and the Na+/Ca2+ exchange current (INCX) are two major inward currents that provide the depolarization drive to shape action potential (AP) plateau and repolarization phase in cardiac myocytes. Changes in the magnitude or timing of these currents could cause development of cardiac arrhythmias. Hence, understanding the dynamic properties of these currents during the AP cycle is of great interest. However, the current knowledge on the ICa,L and INCX during AP has been largely based on model simulations derived from traditional voltage-clamp data. Previous voltage-clamp experiments often used simplified ionic solutions to isolate the currents and used exogenous Ca2+ buffer—conditions that differ from physiological milieu. In this study, we directly measured the ionic currents during AP under a triad of conditions mimicking physiological environment: (1) the cell’s own AP was recorded and used as command voltage to directly record the ICa,L and INCX during AP; (2) the physiological ionic compositions were used in both the internal and the external solutions; and (3) the intracellular Ca2+ cycling during AP was preserved by not using exogenous Ca2+ buffer in the internal solution.
We recorded the nifedipine-sensitive current (INIFE), which is the composite current of ICa,L and INCX, during AP with Ca2+ cycling. Then we used a newly developed AP-clamp Sequential Dissection technique (‘Onion-Peeling’)1 to separate ICa,L and INCX using nifedipine and SEA0400. This novel experimental approach allows us, for the first time, to directly visualize the dynamics of ICa,L and INCX currents during AP with Ca2+ cycling in the cell. Our data reveal novel and distinctive features of ICaL and INCX that occur when the cell is most vulnerable to early or delayed afterdepolarizations. Measurement of the currents during the AP with Ca2+ cycling under physiological conditions also provide realistic data to aid computational modeling and rational design of effective drug therapies for treating cardiac arrhythmias.
Methods
All laboratory procedures conform to the Guide for the Care and Use of Laboratory Animals published by the US National Institutes of Health.
Cell isolation
Hartley guinea pigs (male, 3–4 month old, purchased from Charles River Laboratories USA), were first injected with heparin (800u, I.P.) and then anesthetized with nembutal (100 mg/kg, I.P.). After achieving deep anesthesia to suppress spinal cord reflexes, a standard enzymatic technique was used to isolate ventricular myocytes. 2
Electrophysiology
AP-clamp Sequential Dissection experiments were conducted as described in our previous publication1. Cells were continuously superfused with a modified Tyrode solution (BTy) containing (in mmol/L) NaCl 120, KCl 5, CaCl2 2, MgCl2 1, HEPES 10, NaHCO3 25, Glucose 10, pH 7.3. The pipette solution contained (in mmol/L) K-Aspartate 115, KCl 45, Mg-ATP 3, HEPES 5, cAMP 0.1, pH 7.25. Depending on the experiment, 0, 2 or 10 mM EGTA was added into the pipette solution. Basic experimental steps: (1) Record the steady state AP under I-clamp (I=0) at 1 Hz pacing frequency. (2) Apply this AP as the voltage command onto the same cell under V-clamp at 1 Hz. The net current output, IBG should be zero. (3) Isolate the current of interest by using its specific blocker to remove it from the net current output, Idrug. (4) The current of interest is then obtained by subtraction: I = IBG - Idrug. (5) Next, isolate the 2nd current of interest by applying the 2nd channel blocker, and then obtained the 2nd current by subtraction: I2 = Idrug1 - Idrug2. Repeat (5) to isolate the 3rd, the 4th, and more currents by sequentially adding the specific blocker for each channel (Table-1). The currents were recorded after they reached steady state. The inhibitory coefficient of SEA0400 on blocking INCX was measured using a standard ramp V-clamp protocol 3. The inhibitory coefficient of SEA0400 on blocking ICaL was measured using a standard V-clamp protocol 2.
Table-1.
| Currents (pA/pF) |
Ca2+ cycling (0 EGTA) |
Ca2+ buffered (EGTA 10 mM) |
|---|---|---|
| IK1 | Ba2+ 50 µmol/L | |
| Diastolic | 0.306 ±0.305 | 0.281 ±0.215 |
| Peak | 1.860 ±0.386 | 1.723 ±0.541 |
| IKs | Chromanol-293B 10 µmol/L | |
| Diastolic | 0.016 ±0.064 | −0.007 ±0.138 |
| Peak | 0.340 ±0.219 | 0.374 ±0.208 |
| IKr | E4031 1 µmol/L | |
| Diastolic | 0.038 ±0.031 | 0.004 ±0.110 |
| Peak | 0.571 ±0.161 | 0.724 ±0.184* |
| INIFE | Nifedipine 10 µmol/L | |
| Diastolic | 0.072 ±0.151 | 0.103 ±0.274 |
| Peak | −1.434 ±0.302 | −2.36 ±0.262*** |
Student’s t-test p<0.05*
p<0.001*** (n=11–17 cells/group)
All experiments were conducted at 21±1°C, except those in Fig.6 were conducted at 36±0.5°C. Chemicals were purchased from SIGMA-ALDIRCH (USA), except SEA0400, 2-[4-[(2,5-difluorophenyl)methoxy]phenoxy]-5-ethoxyaniline was provided by Taisho Pharmaceutical (Japan).
Fig.6.
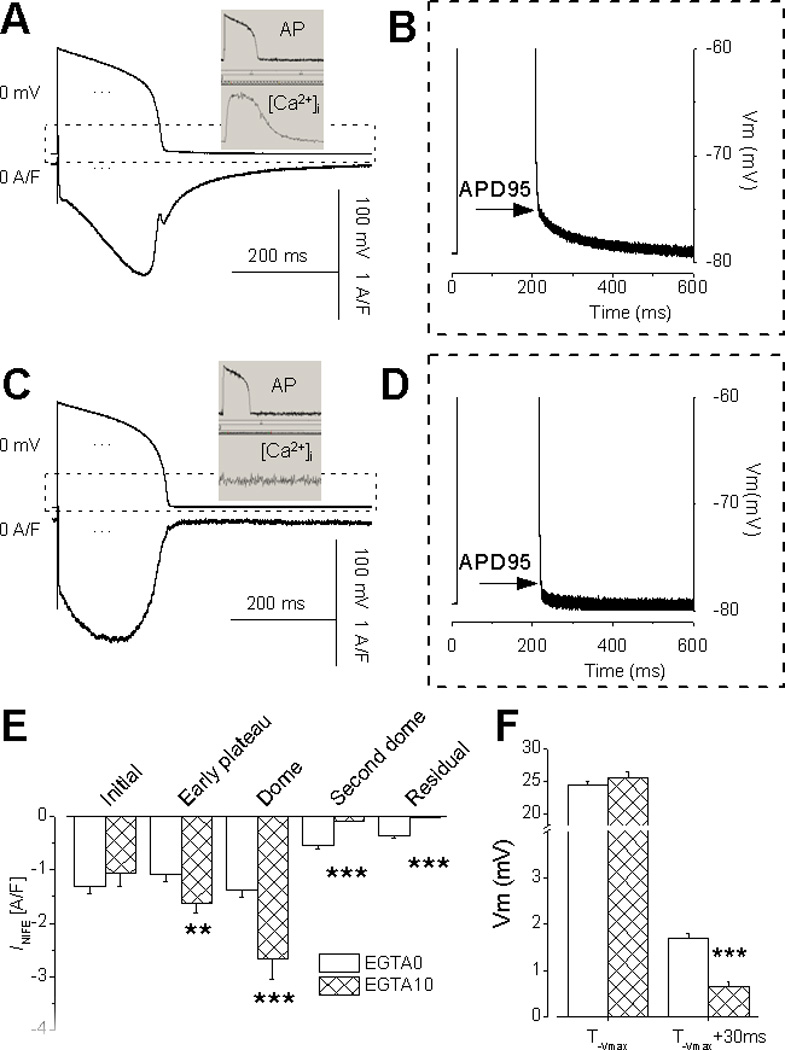
These experiments were conducted at 36°C. Panel A shows a representative INIFE recorded under AP-clamp with Ca2+ cycling (n=19 cells). Notice the presence of the second dome and the residual current (A) and the residual depolarization (B). The insert shows the Ca2+ transient measured with Fura-2. Panel C shows a representative INIFE recorded with 10 mM EGTA (n=9 cells). Notice the absence of the residual current (C) and the residual depolarization (D). Panel E and F show the Mean ±SE and statistical comparison at the features points. (t-test p<0.01**, p<0.001***)
Results
Nifedipine-sensitive current during AP with Ca2+ cycling
Ionic currents were recorded in ventricular cardiac myocytes using the Onion-Peeling technique. First, we tested the effect of 0.1% DMSO which is used as solvent of drugs. Application of DMSO resulted in no change in the zero baseline current (Fig.1A). Nifedipine at 10 µM concentration was added into the bath to dissect out INIFE, as shown in Fig.1B. INIFE displays several distinct features. There is a steep rise of the current at phase-1 of AP, which we named the initial current (“I”) and measured it at 10 ms following the AP upstroke. During phase-2, the current slows down and forms a dome, which we named the dome current and measured it at APD10 (early plateau “E”) and APD20 (dome “D”) (APD# is defined as the AP duration measured at #% repolarization.) During phase-3, the current declines but then resurges to reach a second dome (“S”). Then the current declines again and slowly diminishes during phase-4; we named this feature the residual current (“R”) and measured it at 30 ms after -Vmax (the maximum repolarization rate of AP during phase-3). While the initial phase and the dome features were seen before 4,5, the second dome and the residual current during AP phase-3&4 are novel observations that had not been reported previously.
Fig.1.
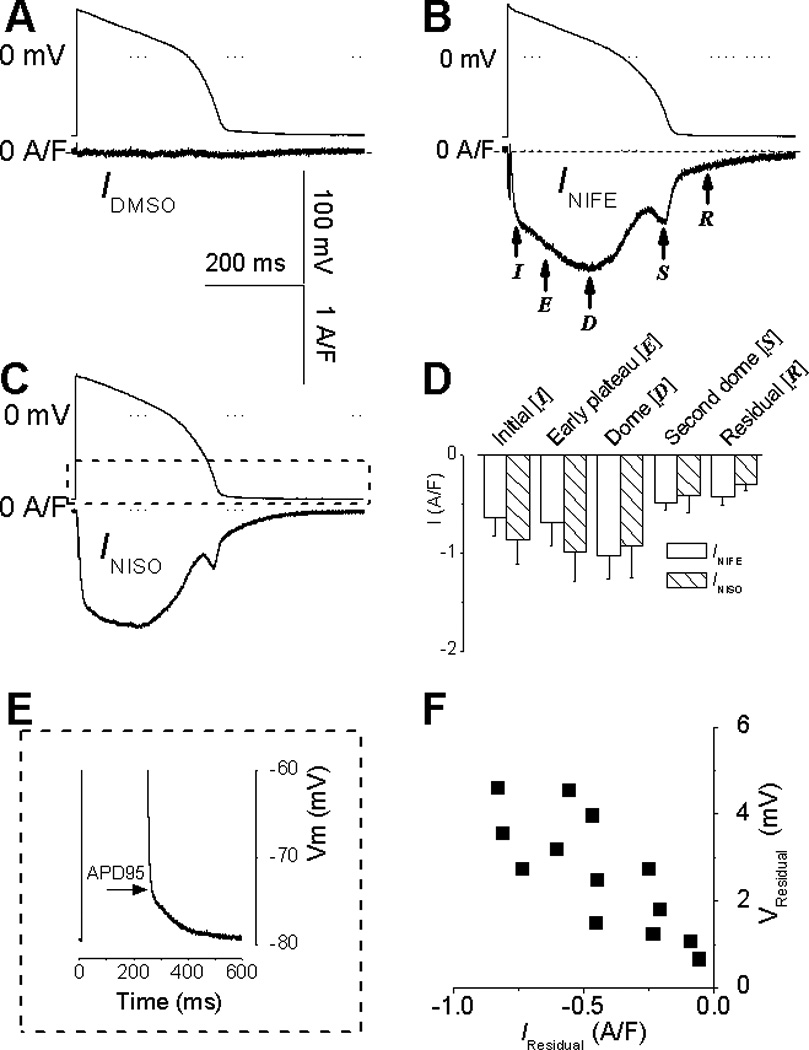
Panel A shows a representative current trace recorded with 0.1% (v/v) DMSO (used as solvent of channel blockers). The flat “zero current” indicate a lack of any DMSO effect on membrane currents (n=5 cells). Panel B and C are representative recordings of INIFE or INISO respectively. Panel D shows the statistical comparison of INIFE (n=7) and INISO (n=5), demonstrating no significant differences between the currents. Panel E shows the residual depolarization. Panel F shows a positive correlation between the residual depolarization and the residual current measured at 30 ms after −Vmax.
To confirm that INIFE originates from blocking the L-type Ca2+ channel, we used a different blocker, nisoldipine 1 µM to record the nisoldipine-sensitive current (INISO) under AP-clamp. INISO (Fig.1C, n=8 cells) displays the same distinct features and similar values as INIFE (Fig.1D, n=8 cells).
Corresponding to the residual current, we also found a slowing down of the membrane repolarization at the end of AP that extends beyond APD95 (Fig.1E), which we named residual depolarization and measured it as the voltage above the resting potential at 30 ms after -Vmax (the same time point for measuring the residual current). The residual depolarization had not been reported in the literature. However, we have consistently found this residual depolarization in both the single cell and the ventricular tissue (using sharp electrode recording of AP, data not shown), confirming its existence in vivo. Furthermore, the residual depolarization shows a strong positive correlation with the residual current (Fig.1F), indicating a connection between the two.
INIFE consists of ICa,L and INCX
INIFE is composed of not only ICa,L but also INCX and other Ca2+ sensitive currents. This is because blocking ICa,L also eliminates Ca2+ entry into the cell to trigger SR Ca2+ release, which abolishes the intracellular Ca2+ transient and its associated currents such as the inward INCX, the Ca2+-activated Cl− current, and possibly a fraction of K+ currents that is sensitive to Ca2+. We conducted all experiments at 21°C to render the Cl− current negligible.6,7 To determine the Ca2+ sensitivity of K+ currents, we used the Onion-Peeling method 1 to record IKs, IKr, IK1, and INIFE in the same cell. The currents measured with Ca2+ cycling versus with EGTA are listed in Table-1. IK1 and IKs did not show any significant difference in the peak current density; peak IKr decreased slightly (0.15 A/F). However, the average peak current of INIFE was 1.4 A/F with Ca2+ cycling and 2.4 A/F with EGTA. Hence, the Ca2+ sensitive component in K+ currents is much smaller than the magnitude of INIFE, which should cause only a slight underestimation of INIFE. Therefore, the INIFE recorded in our experiment is mainly composed of ICa,L and INCX.
The Ca2+-dependent features of INIFE
To separate the ICa,L and INCX components in INIFE, we added 10 mM EGTA to the pipette solution to buffer intracellular Ca2+ and minimize the inward INCX. A typical recording of INIFE with 10 mM EGTA is shown in Fig.2A. Now the INIFE profile displays the initial current and the dome current features, but without any discernable second dome and residual current, different from that recorded with Ca2+ cycling (Fig.1B). Moreover, the residue depolarization is also eliminated (Fig.2B).
Fig.2.
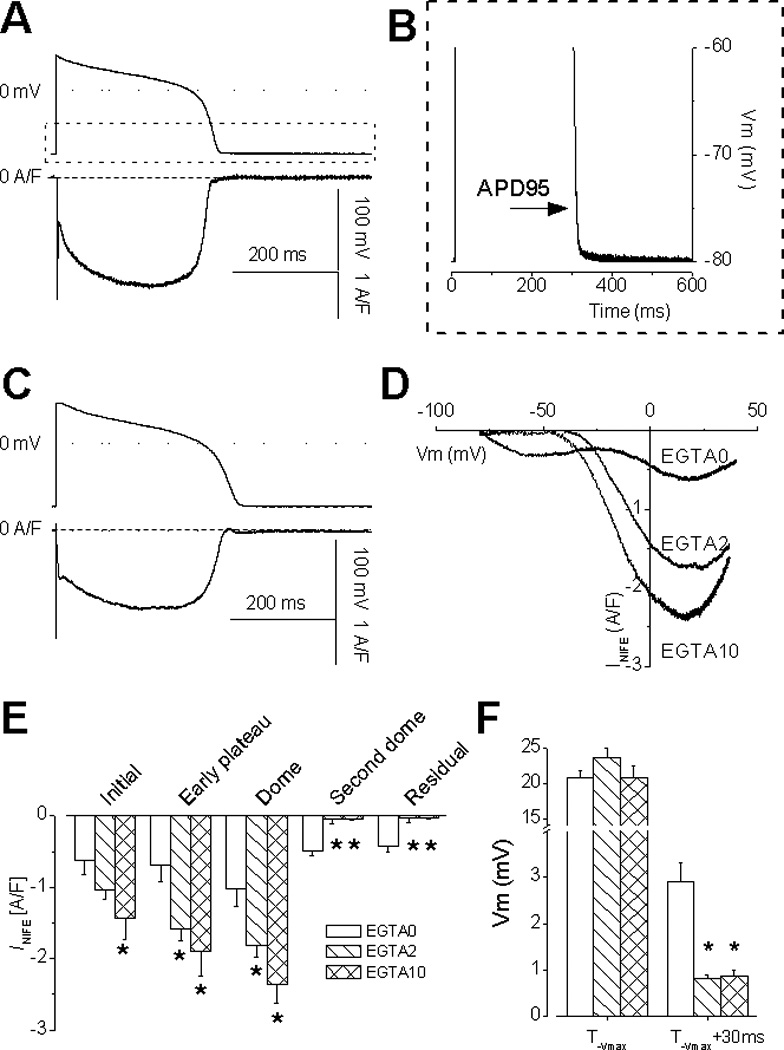
Representative INIFE recorded under AP-clamp with 10 mM EGTA in pipette (n=10 cells). Notice an absence of the second dome, the residual current (A), and the residual depolarization (B). INIFE recorded with 2 mM EGTA (C, n=14 cells), the current-voltage relationship (D), and statistical comparison between different Ca2+ buffering conditions (E) show increased current density with more EGTA buffering. Panel F demonstrates that EGTA did not affect the voltage at −Vmax but significantly reduced the residual depolarization at 30 ms after −Vmax. (t-test, p<0.05*; p<0.01**)
When EGTA concentration in the pipette was reduced from 10 mM to 2 mM, INIFE displayed the initial current and the dome current but the second dome was absent in all records. Buffering of Ca2+ eliminated the second dome and the residual current, but elevated the dome current in concentration-dependent manner (Fig.2A&C). These phenomena are visualized in the I–V relationship (Fig.2D) and confirmed in the statistical comparison of the current amplitudes along the AP time course (Fig.2E). Again, corresponding to a lack of the residual current the residual depolarization was also eliminated (Fig.2F). Note that low EGTA (2 mM) buffering can significantly affect Ca2+ and the dynamics of INIFE during AP.
Contribution of INCX to INIFE
The fact that buffering Ca2+ can eliminate the second dome and the residual current suggests that INCX might contribute to these features. To investigate this we used an INCX inhibitor, SEA0400 at 3 µM concentration to record the SEA-sensitive current (ISEA). As shown in Fig.3A, ISEA displays a small initial current at AP phase-1; gradually increases during phase-2, peaks at early phase-3 and declines; the current then turns around and reaches the second dome at late phase-3; and then declines to a residual current extending into phase-4. These data show that INCX dominates the late phases of AP. After ISEA had developed and stabilized, we added 10 µM nifedipine into the bath and recorded the ISEA+NIFE current (Fig.3B, C). Statistical comparison of the currents shows that the contribution of INCX to ISEA+NIFE is relatively small during the early phases of AP but becomes larger in later phases (Fig.3D).
Fig.3.
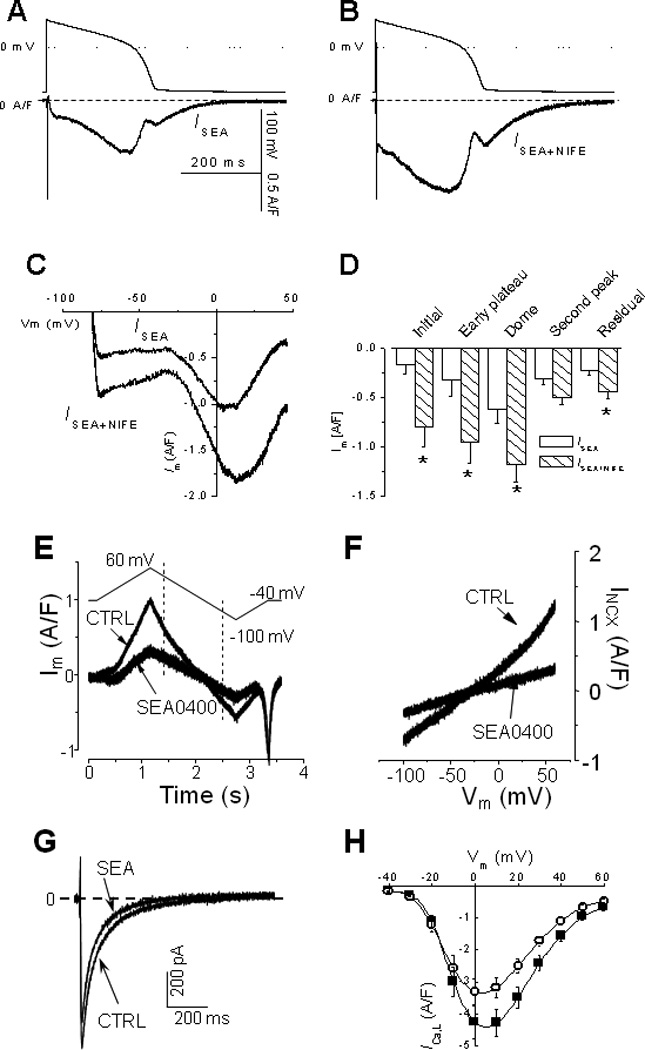
Panel A shows a representative current recorded with 3 µM SEA0400 (ISEA). When 10 µM nifedipine was added, ISEA+NIFE displays similar characteristics (B). Panel C and D show the instant current-voltage relationship of ISEA and ISEA+NIFE and statistical comparison of data (n=7 cells, t-test, p<0.05*). Standard V-clamp protocols were used to measure the inhibitory effects of 3 µM SEA. Panel E and F show current traces and the I–V relationship of INCX before and after application of SEA. Panel G and H show representative current traces and the I–V relationship of ICa,L before and after application of SEA.
Although SEA0400 is the most potent inhibitor of INCX currently available, it also partially blocks ICa,L. This means that ISEA is composed of not only INCX but also a small portion of ICa,L. To separate INCX from ICa,L, we measured the inhibitory coefficients of 3 µM SEA0400 on INCX and ICa,L, respectively. The inhibitory effect of SEA0400 on INCX is voltage-dependent, about 65% and 51% for the outward INCX measured at +30 mV and the inward INCX measured at - 75 mV (Fig.3E, F). The inhibitory effect of 3 µM SEA0400 on ICaL is about 24% at the peak and is also voltage-dependent (Fig.3G, H).
Reconstruction of ICa,L and INCX during AP
Both ICaL and INCX are heavily dependent on the local Ca2+ concentration. However, currently there is no available technique to directly measure the local Ca2+ concentrations sensed by the channel/transporter. To circumvent this problem, we took a simple approach to calculate ICaL and INCX from the paired recordings of ISEA and ISEA+NIFE (using two equations to solve for two unknowns) by utilizing the differential inhibitory coefficients of SEA versus nifedipine. This simple calculation using paired recordings provides a somewhat direct approach to disentangle ICaL and INCX Given that ICaL and INCX are the predominant currents blocked by nifedipine and SEA0400, the charge conservation gives the following equations:
where kCaL and kNCX are the voltage-dependent inhibitory coefficients of ICaL and INCX measured from the voltage-clamp experiments shown in Fig.3F&H. α is a scaling factor (ranging between 0 and 1 inclusive) that reflects the portion of INCX that is affected by changes in ICaL). Because the local Ca2+ concentration sensed by the Na+/Ca2+ exchanger is unknown, we therefore solved the equations for α =0 and 1 to calculate the boundary conditions and estimate the currents. Fig.4 show INCX and ICaL computed from paired recordings of ISEA and ISEA+NIFE during AP with Ca2+ cycling (Column A) or with EGTA (Column B). The current traces are shown in the upper row. Notice that ISEA is an inward current due to the forward mode INCX when Ca2+ is cycling, but turns into an outward current due to the reverse mode INCX when Ca2+ is buffered with 10 mM EGTA. The ICa,L and INCX calculated from ISEA and ISEA+NIFE are shown in Fig.4 (middle and lower row). The blue (α =1) and red (α =0) traces demarcate the upper and the lower boundaries of the currents, respectively. The actual current should fall within the boundaries. Note that INCX is bounded within a narrow range; hence the profile of INCX during AP is clearly defined. A probable profile of the current is highlighted with black line (calculated as an intermediate state with α=0.8).
Fig.4.
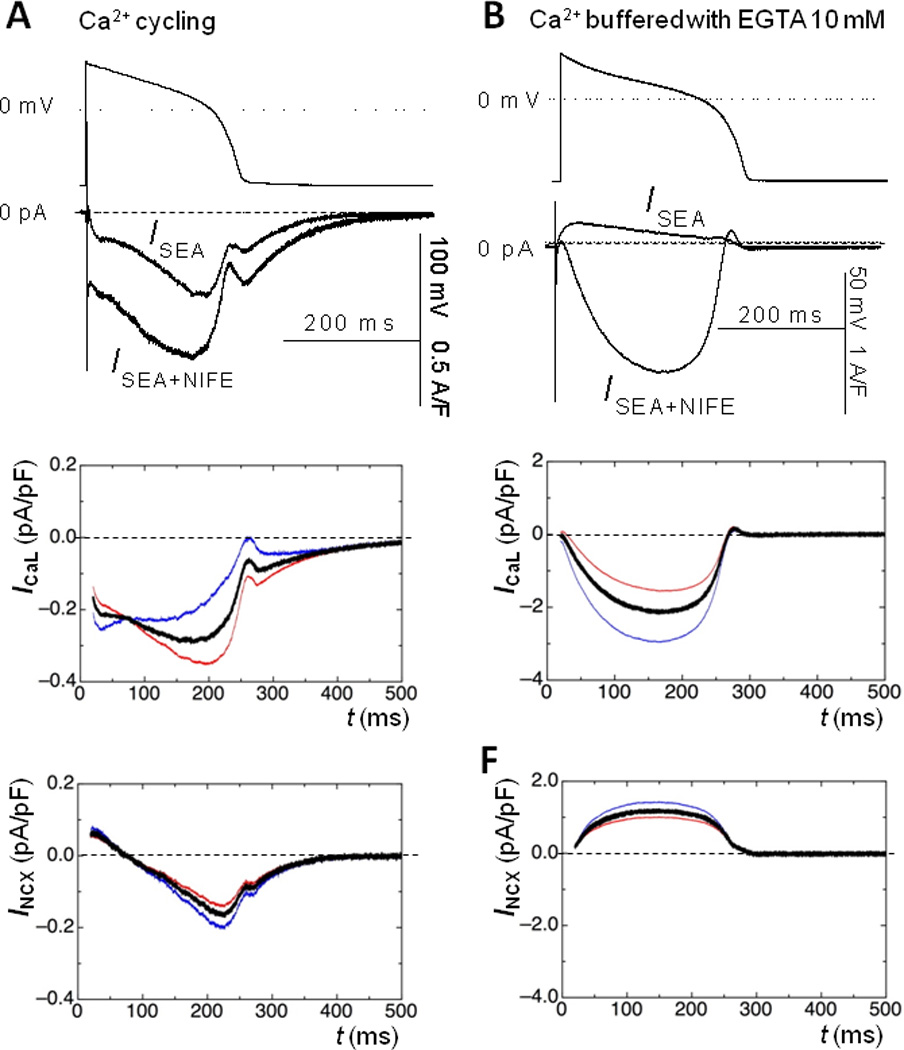
Column A and B show ISEA and ISEA+NIFE recorded in the absence and presence of EGTA, respectively. EGTA buffering of Ca2+ reversed ISEA and amplified ISEA+NIFE. Mathematical reconstruction of ICa,L and INCX assuming zero coupling (α=0, red line) or linear coupling (α=1, blue line) between ICa,L and INCX mark the boundaries of the actual currents. Black line shows an intermediate state (α=0.8), highlighting a probable profile of the currents.
The magnitude of ICaL dome current is about 0.3 A/F when Ca2+ is normally cycling (Column A, middle panel), but becomes much greater to about 2 A/F when Ca2+ is buffered (Column B, middle panel). This difference reflects a profound influence of the Ca2+-dependent inactivation of ICa,L. Note also that buffering Ca2+ completely eliminated the second dome and the residual current. When Ca2+ is cycling, INCX is briefly outward at the beginning of AP but soon becomes an inward current (Column A, lower panel), and reaches a peak of about 0.2 A/F. In contrast, when Ca2+ is buffered, INCX is always outward during AP (Column B, lower panel).
Effects of SEA0400
It has been proposed that inhibiting INCX might provide an effective therapy for some forms of arrhythmias. We predicted that using SEA0400 to treat the cell would reduce the dome current and the residual current. To test this, we pretreated cells with 3 µM SEA0400 and recorded the remaining INIFE under AP-clamp. As shown in Fig.5A, SEA0400 treatment shortened APD, in consistent with its effect on reducing the dome and the residual current.
Fig.5.
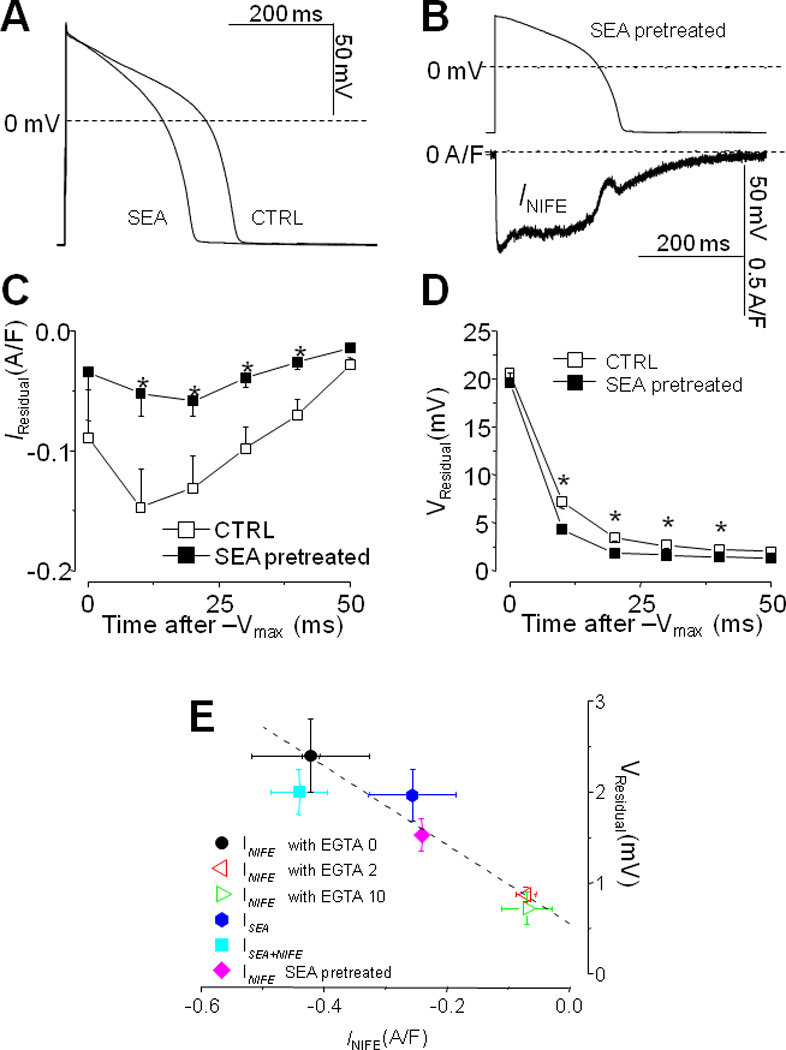
Using 3 µM SEA0400 to treat cells shortened AP duration (A) and reduced INIFE (B). The residual current (C) and the residual depolarization (D) were significantly reduced (n=7 cells, t-test, p<0.05*), demonstrating a predominant influence of INCX on these features. Panel E shows a universal correlation (R=0.917) between the magnitude of residual current and residual depolarization under all experimental conditions tested.
A representative trace of the INIFE in the SEA0400 pretreated cell is shown in Fig.5B. Recall that in the control cell (Fig.1B) the dome is larger than the initial current, here in the SEA0400 pretreated cell the dome becomes smaller than the initial current, indicating a portion of the dome current is contributed by the inward INCX. The residual current is significantly smaller after SEA0400 treatment (Fig.5C), in consistent with the INCX contribution. Meanwhile the residual depolarization is also smaller (Fig.5D). In fact, a positive correlation between the residual current and the residual depolarization exists universally for all the experimental conditions tested (Fig.5E), indicating that the residual current is responsible for the residual depolarization.
INIFE at body temperature
To establish the physiological relevance of our new findings, we also conducted AP-clamp experiments at body temperature. The INIFE at 36°C displays essentially the same features (Fig.6A). The Second dome and the residual currents are prominent, and the residual depolarization is also present (Fig.6B). The insert shows the Ca2+ transient measured with Fura-2. Using EGTA to buffer Ca2+ eliminates the residual current (Fig.6C) and the residual depolarization (Fig.6D). Statistical comparison show that with Ca2+ cycling, the dome currents is significant smaller (Fig.6E) due to Ca2+ -dependent inactivation of ICa,L (CDI), but the residual current and the residual depolarization are significantly larger (Fig.6E,F) due to the inward INCX.
Discussion
Here we present experimental measurements of ICa,L and INCX currents during the action potential with Ca2+ cycling in ventricular myocytes. This was enabled by a triad of conditions: (1) using the cell’s own AP as the voltage command; (2) using the internal and external solutions that mimic the physiological milieu; and (3) Ca2+ cycling during AP was preserved by not using exogenous Ca2+ buffer. To the best of our knowledge, it is the first time this triad of conditions has been used to record the ionic currents during cardiac AP with Ca2+ cycling.
INIFE was obtained by blocking L-type Ca2+ current under AP-clamp. However, blocking Ca2+ current also affects other Ca2+ dependent currents including INCX, Ca2+-activated Cl− current, and the Ca2+ sensitive components in K+ currents. The Cl− current was rendered negligible by conducting experiments at 21°C.6,7 We also found no significant contributions of K+ currents. Hence, INIFE mainly consists of ICa,L and INCX. The profile of INIFE during AP exhibits distinct features: an initial current at phase-1, a dome at phase-2, a resurging second dome at phase-3 and a residual current at phase-4. The second dome and the residual current had not been reported before; these novel features become apparent only when Ca2+ is not buffered. We also detected a hitherto unreported residual depolarization at the end of AP which can be attributed to the residual current. Furthermore, we found that ICa,L contributes predominantly to the initial and the dome current whereas INCX contributes significantly to the second dome and the residual current. The timing and magnitude of these currents suggest their relative roles in shaping the AP profile and generating early or delayed afterdepolarizations.
The dynamic profile of ICa,L during cardiac AP and its contribution to afterdepolarizations has been under active investigation. Previous studies used variants of the AP-clamp technique and reported the initial current and the dome current features, but never before reported the second dome and the residual current features. This discrepancy can be explained by the experimental conditions used in those studies that differed from the triad of conditions used in our experiments. First, in earlier studies the AP waveform used as voltage command was either a representative AP 5 or a reconstructed AP 8, which does not, in general, match each cell’s unique AP. Hence the current profile would be distorted from its natural state in the cell. Second, earlier experiments used non-physiological solutions (substituting Na+ and K+), but ion species and concentration are known to alter the Ca2+ channel kinetics. 9,10 Third, most earlier experiments used exogenous Ca2+ buffer, and the ICa,L profile reported in those studies 11,8,5 are similar to the INIFE profile recorded with EGTA in our study (Fig.2A&C). The second dome and the residual current in INIFE are novel features revealed only under the triad of conditions used in our AP-clamp experiments.
The dynamic profile of ICa,L during AP is determined by an interplay between the changing driving force during AP and CDI. Importantly, our data show a significant modulation of ICa,L during AP by CDI, seen as the INIFE dome current increases with EGTA in a dose-dependent manner (Fig.2E). The average dome current is 1.4 pA/pF when Ca2+ is cycling, and increases to 2.4 pA/pF when Ca2+ is buffered with10 mM EGTA. It is noteworthy that previous voltage-clamp and AP-clamp studies (using Ca2+ buffer) reported a peak ICa,L between 2–10 pA/pF 11,5,4; quantitative models based on those data also had a peak ICa,L in that range 12. Our data show a much smaller ICa,L magnitude in the cell measured under AP-clamp with Ca2+ cycling, and provide realistic experimental data for future modeling considerations.
Previously, a lack of selective blocker prevented direct measurement of INCX 13. In this study we used SEA0400 paired with nifedipine to isolate the INCX during AP with Ca2+ cycling. Our data reveal that INCX presents an outward current at the beginning of AP, which turns into a small inward current at early phase-2; the inward INCX increases and contributes significantly to the INIFE second dome and the residual current at phase-3&4. In comparison to earlier studies, Grantham and Cannell 5 had calculated an INCX profile that showed a large outward current throughout AP phase-1&2, then turned into an inward current at phase-3, and then peaked at the end of phase-3. Weber et al. 14 reconstructed the INCX during AP by correlating the Ca2+ transient with the steady-state INCX measurements at various Ca2+ concentrations. They showed that, in rabbit ventricular myocytes, INCX was a rapid outward current at phase-1, turned to inward at early phase-2, reached a peak at the end of phase-3, and then slowly declined during phase-4. The INCX profile in Fig.4 (Column A, lower panel) shows similar features as their result, but differs in the time course and the magnitude of current. Given the importance of INCX in shaping AP, our AP-clamp measurement of INCX in physiological milieu provides important data for developing more accurate quantitative models.
Increased ICa,L or INCX had been found to induce afterdepolarizations 15,16. Inhibiting ICa,L with Ca2+ channel blocker effectively eliminated early afterdepolarizations. 15, 17, 18 Inhibiting INCX with SEA0400 also effectively reduced early and delayed afterdepolarizations. 3,13 Hence, ICa,L and INCX have been proposed as therapeutic targets for treating cardiac arrhythmias (see review by Sipido et al. 13). The relative contributions of ICa,L and INCX to the depolarization drive are resolved in the current study. As we observed, ICa,L is the dominant inward current during AP phase-1&2, whereas INCX is the dominant inward current during phase-3&4. Both ICa,L and INCX contribute to the dome current, the second dome, and the residual current. Given the intertwined nature of ICa,L and INCX, it is the combination of these two currents, not just one or the other, determines the total depolarization drive that shapes AP profile and afterdepolarizations. 19 Importantly, the newly observed second dome and the residual current occurring at phase-3&4 have the right timing and the shape to generate afterdepolarizations if not counterbalanced by repolarization currents. Our data clearly show that the second dome coincides with the vulnerable phase of AP where early afterdepolarizations may develop, while delayed afterdepolarizations may occur at where we observed the residual current. The current study provides useful and physiologically relevant data to aid quantitative modeling of cardiac AP and rational design of anti-arrhythmia drug therapies.
Acknowledgement
We thank Shaden Khabbaz, Charles Payne, and Stephanie E. Edelmann for their excellent work in isolating cardiac cells. We are grateful to Dr. Robert Hadley (University of Kentucky) for kindly providing cells for our early experiments. We are also grateful to Drs. Donald M Bers and Kenneth Ginsburg and Taisho Pharmaceutical (Tokyo, Japan) for the generous gift of SEA0400. Our gratitude also goes to Dr. Donald M Bers (University of California, Davis) and Dr. Mark E Anderson (University of Iowa) for reading early manuscripts and contributing insightful comments.
Funding: This work was supported by NIH R01 grant (HL90880) to LTI, YC and TB, NIH R03 grant (AG031944) to YC, American Heart Association National Center Scientist Development Award (0335250N) to YC, European Society of Cardiology Visiting Scientist Award to BH, and funds from the University of California to LTI and YC.
Footnotes
Publisher's Disclaimer: This is a PDF file of an unedited manuscript that has been accepted for publication. As a service to our customers we are providing this early version of the manuscript. The manuscript will undergo copyediting, typesetting, and review of the resulting proof before it is published in its final citable form. Please note that during the production process errors may be discovered which could affect the content, and all legal disclaimers that apply to the journal pertain.
Conflict of Interest: none.
References
- 1.Banyasz T, Horvath B, Jian Z, Izu LT, Chen-Izu Y. Sequential dissection of multiple ionic currents in single cardiac myocytes under action potential-clamp. J Mol Cell Cardiol. 2011;50(3):578–581. doi: 10.1016/j.yjmcc.2010.12.020. [DOI] [PMC free article] [PubMed] [Google Scholar]
- 2.Chen-Izu Y, Chen L, Banyasz T, et al. Hypertension-induced remodeling of cardiac excitation-contraction coupling in ventricular myocytes occurs prior to hypertrophy development. Am J Physiol Heart Circ Physiol. 2007;293:H3301–H3310. doi: 10.1152/ajpheart.00259.2007. [DOI] [PubMed] [Google Scholar]
- 3.Birinyi P, Acsai K, Banyasz T, et al. Effects of SEA0400 and KB-R7943 on Na+/Ca2+ exchange current and L-type Ca2+ current in canine ventricular cardiomyocytes. Naunyn Schmiedebergs Arch Pharmacol. 2005;372(1):63–70. doi: 10.1007/s00210-005-1079-x. [DOI] [PubMed] [Google Scholar]
- 4.Linz KW, Meyer R. Profile and kinetics of L-type calcium current during the cardiac ventricular action potential compared in guinea-pigs, rats and rabbits. Pflügers Archiv European Journal of Physiology. 2000;439(5):588–599. doi: 10.1007/s004249900212. [DOI] [PubMed] [Google Scholar]
- 5.Grantham CJ, Cannell MB. Ca2+ Influx During the Cardiac Action Potential in Guinea Pig Ventricular Myocytes. Circulation Research. 1996;79(2):194. doi: 10.1161/01.res.79.2.194. [DOI] [PubMed] [Google Scholar]
- 6.Nakajima I, Watanabe H, Iino K, Saito T, Miura M. Ca2+ overload evokes a transient outward current in guinea-pig ventricular myocytes. Circ J. 2002;66(1):87–92. doi: 10.1253/circj.66.87. [DOI] [PubMed] [Google Scholar]
- 7.Puglisi JL, Yuan W, Bassani JWM, Bers DM. Ca2+ Influx Through Ca2+ Channels in Rabbit Ventricular Myocytes During Action Potential Clamp: Influence of Temperature. Circ Res. 1999;85(6):e7–e16. doi: 10.1161/01.res.85.6.e7. [DOI] [PubMed] [Google Scholar]
- 8.Linz KW, Meyer R. Control of L-type calcium current during the action potential of guinea-pig ventricular myocytes. J Physiol. 1998;513(2):425–442. doi: 10.1111/j.1469-7793.1998.425bb.x. [DOI] [PMC free article] [PubMed] [Google Scholar]
- 9.Linz KW, Meyer R. Modulation of L-type calcium current by internal potassium in guinea pig ventricular myocytes. Cardiovasc Res. 1997;33(1):110–122. doi: 10.1016/s0008-6363(96)00184-8. [DOI] [PubMed] [Google Scholar]
- 10.Hess P, Lansman JB, Tsien RW. Calcium channel selectivity for divalent and monovalent cations. Voltage and concentration dependence of single channel current in ventricular heart cells. J Gen Physiol. 1986;88(3):293–319. doi: 10.1085/jgp.88.3.293. [DOI] [PMC free article] [PubMed] [Google Scholar]
- 11.Arreola J, Dirksen RT, Shieh RC, Williford DJ, Sheu SS. Ca2+ current and Ca2+ transients under action potential clamp in guinea pig ventricular myocytes. Am J Physiol. 1991;261:C393–C397. doi: 10.1152/ajpcell.1991.261.2.C393. [DOI] [PubMed] [Google Scholar]
- 12.Faber GM, Silva J, Livshitz L, Rudy Y. Kinetic properties of the cardiac L-type Ca2+ channel and its role in myocyte electrophysiology: a theoretical investigation. Biophys J. 2007;92(5):1522–1543. doi: 10.1529/biophysj.106.088807. [DOI] [PMC free article] [PubMed] [Google Scholar]
- 13.Sipido KR, Bito V, Antoons G, Volders PG, Vos MA. Na/Ca Exchange and Cardiac Ventricular Arrhythmias. Annals of the New York Academy of Sciences. 2007;1099:339–348. doi: 10.1196/annals.1387.066. [DOI] [PubMed] [Google Scholar]
- 14.Weber CR, Piacentino V, Ginsburg KS, Houser SR, Bers DM. Na-Ca Exchange Current and Submembrane [Ca2+] During the Cardiac Action Potential. Circ Res. 2002;90(2):182–189. doi: 10.1161/hh0202.103940. [DOI] [PubMed] [Google Scholar]
- 15.January CT, Riddle JM. Early afterdepolarizations: mechanism of induction and block. A role for L-type Ca2+ current. Circ Res. 1989;64(5):977–990. doi: 10.1161/01.res.64.5.977. [DOI] [PubMed] [Google Scholar]
- 16.Pogwizd SM, Qi M, Yuan W, Samarel AM, Bers DM. Upregulation of Na+/Ca2+ Exchanger Expression and Function in an Arrhythmogenic Rabbit Model of Heart Failure. Circ Res. 1999;85(11):1009–1019. doi: 10.1161/01.res.85.11.1009. [DOI] [PubMed] [Google Scholar]
- 17.Anderson ME, Braun AP, Wu Y, et al. KN-93, an inhibitor of multifunctional Ca/calmodulin-dependent protein kinase, decreases early afterdepolarizations in rabbit heart. J Pharmacol Exp Ther. 1998;287(3):996–1006. [PubMed] [Google Scholar]
- 18.Yamada MOK, Niwa A, Tsujino N, Nakada T, Hirose M. Contribution of L-type Ca2+ channels to early afterdepolarizations induced by I Kr and I Ks channel suppression in guinea pig ventricular myocytes. J Membr Biol. 2008;222(3):151–166. doi: 10.1007/s00232-008-9113-9. [DOI] [PubMed] [Google Scholar]
- 19.Weiss JN, Garfinkel A, Karagueuzian HS, Chen P-S, Qu Z. Early afterdepolarizations and cardiac arrhythmias. Heart Rhythm. 2010;7(12):1891–1899. doi: 10.1016/j.hrthm.2010.09.017. [DOI] [PMC free article] [PubMed] [Google Scholar]


