

Abstract
BACKGROUND AND PURPOSE
Intracellular pharmacokinetics of anticancer drugs in multi-drug resistance (MDR) cancer cells is hugely important in the evaluation and improvement of drug efficacy. By using adriamycin as a probe drug in MDR cancer cells, we developed a cellular pharmacokinetic-pharmacodynamic (PK-PD) model to reveal the correlation between cellular pharmacokinetic properties and drug resistance. In addition, the ability of 20(S)-ginsenoside Rh2 (20(S)-Rh2) to reverse MDR was further investigated.
EXPERIMENTAL APPROACH
The cellular pharmacokinetics of adriamycin were analysed visually and quantitatively in human breast cancer cells MCF-7 and in adriamycin-resistant MCF-7 (MCF-7/Adr) cells. Mitochondria membrane potential was assayed to evaluate the apoptotic effect of adriamycin. Subsequently, a PK-PD model was developed via MATLAB.
KEY RESULTS
Visual and quantitative data of the dynamic subcellular distribution of adriamycin revealed that it accumulated in cells, especially nuclei, to a lesser and slower extent in MCF-7/Adr than in MCF-7 cells. 20(S)-Rh2 increased the rate and amount of adriamycin entering cellular/subcellular compartments in MCF-7/Adr cells through inhibition of P-glycoprotein (P-gp) activity, in turn augmenting adriamycin-induced apoptosis. The integrated PK-PD model mathematically revealed the pharmacokinetic mechanisms of adriamycin resistance in MCF-7/Adr cells and its reversal by 20(S)-Rh2.
CONCLUSIONS AND IMPLICATIONS
P-gp, which is overexpressed and functionally active at cellular/subcellular membranes, influences the cellular pharmacokinetic and pharmacological properties of adriamycin in MCF-7/Adr cells. Inhibition of P-gp activity represents a key mechanism by which 20(S)-Rh2 attenuates adriamycin resistance. Even more importantly, our findings provide a new strategy to explore the in-depth mechanisms of MDR and evaluate the efficacy of MDR modulators.
Keywords: cellular pharmacokinetic, adriamycin resistance, 20(S)-ginsenoside Rh2, P-gp inhibition, mechanisms
Introduction
Multi-drug resistance (MDR) has always been closely associated with clinical cancer therapy. MDR is associated with cellular pharmacokinetic alterations, such as decreased drug accumulation, increased detoxification capacity, subcellular redistribution and increased efflux (Serrone and Hersey, 1999; Stavrovskaya, 2000; Meijerman et al., 2008). In particular, ATP-binding cassette (ABC) transporters have received a great deal of attention in the study of MDR for a long time. One such transporter that has been investigated in great detail is P-glycoprotein (P-gp). Many anticancer drugs have been demonstrated to be P-gp substrates, causing their efflux, which directly leads to a decrease in intracellular drug concentration in tumour cells and results in MDR. Recently, it has been demonstrated that these transporters are also expressed in intracellular compartments such as nuclei, mitochondria and Golgi apparati, which play a potential role in altered intracellular distribution of anticancer drugs in MDR cancer cells (Baldini et al., 1995; Ferrao et al., 2001; Gong et al., 2003; Munteanu et al., 2006). As many anticancer drugs interact with targets localized in cells, such as DNA in nuclei, the intracellular distribution of drugs and the concentrations around the binding site are determinants of efficacy (Larsen et al., 2000; Meschini et al., 2000; Duvvuri and Krise, 2005). Therefore, there is a pressing need to clarify the intracellular pharmacokinetics of chemotherapeutic agents in MDR cancer cells, and thus evaluate or improve their efficacy.
Cellular pharmacokinetics is an emerging branch of traditional pharmacokinetics, and has attracted much attention recently for the evaluation and improvement of anticancer and antibiotic drugs (Jung and Zamboni, 2001; Siebert et al., 2004; Barcia-Macay et al., 2008; Hoffmann et al., 2008). The unique angle of this field is using the target cell as a whole subject to analyse the dynamic profiles of drug uptake, distribution, metabolism and efflux in the cellular environment, and then develop mathematical models to reflect the intracellular target binding and efficacy of the drug (Zhou et al., 2011). In this way, pharmacokinetic research can be transported from the macrocosm into the microcosm, facilitating the development of strategies to overcome inappropriate cellular pharmacokinetics of drugs and thus promoting efficacy in drug discovery. However, in most cases results from intracellular uptake and subcellular distribution studies are used only for predicting the intracellular activities of drugs, and few studies refer to the kinetic process and parameters of intracellular pharmacokinetics. Only a few pharmacokinetic models have been developed to determine the disposition of some types of drugs, and without the combination of pharmacodynamic properties (Hung et al., 2005; Zhang et al., 2006). More effort is now being made to develop a pharmacokinetic-pharmacodynamic (PK-PD) model to better describe the relationship between cellular pharmacokinetic processes and drug efficacy.
20(S)-ginsenoside Rh2 is a trace active ingredient of ginseng with a 20(S)-protopanaxadiol dammarane skeleton aglycone, which was first isolated from red ginseng in 1983 (Kitagawa et al., 1983). In recent investigations, 20(S)-Rh2 (non-toxic dosage) has been shown to have a marked synergistic effect with anticancer agents in tumour models, both in vitro and in vivo (Kikuchi et al., 1991; Jia et al., 2004; Xie et al., 2006). In preliminary experiments, we have systemically demonstrated that 20(S)-Rh2 non-competitively inhibits P-gp in vitro and in vivo, which could account for at least one of the mechanisms by which it produces a synergistic effect (Zhang et al., 2010).
In the present study, adriamycin was used as a probe drug to develop a cellular PK-PD model to determine the correlation between cellular pharmacokinetic properties and drug resistance. In parallel, the ability of 20(S)-Rh2 to reverse MDR was further investigated.
Methods
Reagents
20(S)-ginsenoside Rh2 (purity > 98%) was purchased from Jilin University (Changchun, China). Verapamil and adriamycin were purchased from Sigma-Aldrich (St. Louis, MO). Azithromycin was purchased from the Chinese National Institute for the Control of Pharmaceutical and Biological Products (Beijing, China). Hoechst 33342 and Mito-Tracker Green were purchased from Beyotime Institute of Biotechnology (Nantong, China). HPLC-grade methanol was purchased from Sigma-Aldrich (St. Louis, MO). Deionized water was prepared by Milli-Q system (Millipore Corporation, Billerica, MA) and was used throughout. All other reagents and solvents were commercially available and of analytical grade.
Cell culture
Human breast cancer cells MCF-7 and adriamycin-resistant cells derived from MCF-7 (MCF-7/Adr) were obtained from the Institute of Hematology and Blood Diseases Hospital (Tianjin, China), and cultured in RPMI 1640 supplemented with 10% fetal bovine serum, and 100 U·mL−1 penicillin and streptomycin (Invitrogen, Carlsbad, CA) at 37°C with 5% CO2.
Cell growth inhibition assay
The effects of 20(S)-Rh2 on the sensitivity of MCF-7/Adr cells to adriamycin were determined by measuring cell growth inhibition via 3-(4,5-dimethyl-2-thiazolyl)-2,5-diphenyl-2H-tetrazolium bromide (MTT) colorimetric assay after incubation with various concentrations of adriamycin (0.01, 0.03, 0.1, 0.3, 1, 3, 10, 30, 100 µM) in the absence or presence of 20(S)-Rh2 (1, 5, 10 µM) at 37°C for 72 h. The concentrations required to inhibit growth by 50% (IC50) were calculated from survival curves using the Bliss method.
Cellular retention assay
MCF-7 and MCF-7/Adr cells were seeded on 24-well cell culture plates. After ∼90% confluence, cultured cells were treated with 20(S)-Rh2 (1, 5, 10 µM) or 1% ethanol (solvent control) for 1 h, followed by addition of 5 µM adriamycin. Verapamil (10 µM) was used as a positive control. After incubation for another 2 h, the retention was stopped. Cells were lysed by three freeze-thaw cycles, and protein concentrations were measured by the method of Bradford (Bradford, 1976). Adriamycin was determined by LC-MS/MS. All experiments were conducted in triplicate.
Subcellular distribution of adriamycin in fixed and live cells
For fixed cell analysis, cells were treated as in the cellular retention assay. Then the cells were fixed with 4% paraformaldehyde, stained with Hoechst 33342 (5 µM) for nuclei, and loaded onto Cellomics ArrayScan® VTI HCS (Thermo, USA) for crude detection of adriamycin subcellular distribution. Blue and red fluorescence were monitored through different channels for nuclei and adriamycin, respectively. Quantification was performed by use of accessory image analysis software.
For live cell analysis, MCF-7/Adr cells were subcultured into Lab-Tek II-chamber slides (Nalge Nunc International, Rochester, NY). Before the experiment, the cells were stained with 5 µM Hoechst 33342 for nuclei and 50 nM Mito-Tracker Green for mitochondria. Then, the cells were treated as in the cellular retention assay. Images were collected 10, 20, 30, 40 min after the addition of adriamycin using an Olympus FluoView FV10i laser scanning confocal microscope system with a 60×/1.35 NA oil-immersion objective (Olympus, Japan) with identical settings for each confocal study. The fluorescence of adriamycin (red), Hoechst 33342 (blue) or Mito-Tracker green (green) was excited and collected at 559/574, 405/455 or 473/516 nm, respectively.
Cell fractionation approach for quantification of adriamycin subcellular distribution kinetics
MCF-7 and MCF-7/Adr cells were subcultured in 75 cm2 cell culture flasks. When ∼90% confluent, cultured cells were treated as in the cellular retention assay. After incubation for a designated time (10, 20, 30, 45, 60 min for MCF-7 cells, and 30, 60, 90, 120, 180 min for MCF-7/Adr cells), the nuclei and mitochondria of the cells were isolated according to KeyGen Mitochondria/Nuclei Isolation Kit (Nanjing Keygen Biotech. Co., LTD, China). The concentration of adriamycin in each subcellular compartment was determined by LC-MS/MS, and further adjusted to the concentrations based on initial dosing volume. All experiments were conducted in triplicate.
Analysis of apoptosis by phosphatidylserine (PS) and mitochondrial membrane potential (MMP) detection
MCF-7/Adr cells were treated with adriamycin (5 µM) in the absence or presence of 20(S)-Rh2 (1, 5, 10 µM) for various times (30, 60, 90, 120, 180 min). For PS detection, the cells were harvested and stained with FITC-Annexin V and 7-Amino-Actinomycin D (7-AAD) (BD Biosciences, San Jose, CA), and then immediately analysed by flow cytometry (FACS Calibur, Becton Dickinson, USA). For MMP detection, the cells were incubated with 5,5′,6,6′-tetrachloro-1,1′,3,3′-tetraethyl-imidacarbocyanine iodide (JC-1, JC-1 Apoptosis Detection Kit, Nanjing Keygen Biotech. Co., LTD, China), and then analysed by fluorescence microscopy (Olympus IX51, Japan) or harvested for flow cytometry analysis.
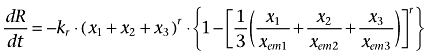
PK-PD modelling of adriamycin
Using the above data (Cell Fractionation and MMP Determination), an integrated PK-PD model was developed to characterize the uptake and distribution profiles of adriamycin in MCF-7 and MCF-7/Adr cells. A brief schematic presentation of this PK-PD model is presented in Figure 1, of which x1, x2, x3 are the concentrations of adriamycin in cytosol, nuclei and mitochondria, respectively, and R is the pharmacodynamic effect indicated by MMP. As the concentrations of adriamycin in cytosol, nuclei and mitochondria are based on the same initial dosing volume, in our PK-PD model drug concentrations could be assumed identical to drug mass.
Figure 1.
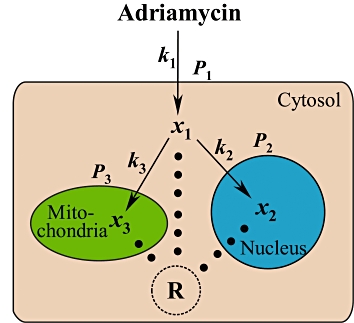
Schematic presentation of an integrated PK-PD model describing the uptake and distribution of adriamycin in cells, coupled with the related apoptotic effect induced by adriamycin. x1, x2, x3 are the concentrations of adriamycin in cytosol, nuclei and mitochondria respectively, k1, k2, k3 are the transport rate constant of adriamycin across the cell membrane of cytosol, nuclei and mitochondria, respectively, P1, P2 and P3 are the permeability coefficients across the membranes of the cell, nucleus and mitochondria, respectively, and R is the pharmacodynamic effect indicated by MMP.
Furthermore, results from the Cell Fractionation assay indicated that the amount of adriamycin in nuclei/mitochondria accumulates with time. Therefore, it can be assumed that there is a single direction of adriamycin net transport from the cytosol to nuclei/mitochodria. In addition, it is accepted that the velocity of adriamycin entering the cell compartment is positively correlated with the concentration difference between the inside and outside of the compartment in a first order manner. Meanwhile, it is also assumed that the amount of adriamycin entering into the cell is extremely small compared to the total amount of adriamycin outside the cell; hence the amount of adriamycin outside the cell can be kept constant. The pharmacokinetics of adriamycin could be described using a logistic model (Peleg, 1997), defined as follows:
 |
(1) |
where ΔC1 indicates the difference of adriamycin concentration between the cytosol and extracellular compartment considering the permeability of the cell membrane. k1 and P1 are the transport rate constant and the permeability coefficient across the cell membrane, respectively. xm1 is defined as the threshold value (carrying capacity) of adriamycin in the cytosol. dx2/dt and dx3/dt represent the transport of adriamycin from cytosol to the nuclei and mitochondria compartment, respectively, which could be described as follows:
 |
(2) |
 |
(3) |
where k2 and k3 are the transport rate constants of adriamycin entering the nuclei and mitochondria, respectively. P2 and P3 indicate the relative permeability coefficient of adriamycin from cytosol to the nuclei and mitochondria, respectively. Similar to xm1, the adriamycin threshold value (carrying capacity) in the nuclei and mitochondria are described by xm2 and xm3, respectively. ΔC2 represents the concentration difference of adriamycin in the cytosol compared to the nuclei considering the permeability of nuclei membrane, while ΔC3 indicates the concentration difference of adriamycin in the cytosol compared to the mitochondria considering the permeability of mitochondria membrane.
As for pharmacodynamics, different types of PD models were attempted to evaluate the effect of adriamycin on MMP in MCF-7/Adr cells, and the final model is depicted in Equation 4.
 |
(4) |
where kr denotes the attenuation rate of MMP and r is the Hill coefficient. xem1, xem2 and xem3 are the threshold values of adriamycin reflecting MMP alterations in cytosol, nuclei and mitochondria, respectively. The initial value of R was 3.
The model was constructed in two steps: (a) by fitting the pharmacokinetic data to the concentration–time profiles of adriamycin; (b) by fitting the pharmacodynamic data to the concentration–effect profiles of adriamycin. The model fittings were conducted by nonlinear regression analysis using the maximum likelihood algorithm in MATLAB (The Mathworks Inc., USA). Akaike Information Criterion (AIC) was adopted for model selection. Objective function and visual inspection of various diagnostic plots were used as the criteria for goodness of fit for both PK and PD. Model evaluation was carried out using nonparametric bootstrap analysis as reported previously (Chen et al., 2009).
Functions and expressions of subcellular P-gp
Nuclei and mitochondria of both MCF-7 and MCF-7/Adr cells were isolated according to KeyGen Mitochondria/Nuclei Isolation Kit, and suspended in nuclei incubation buffer (Kitazono et al., 1999) and mitochondria incubation buffer (Solazzo et al., 2006), respectively. Fractions were then incubated with 5 µM adriamycin in the absence or presence of 20(S)-Rh2 (1, 5, 10 µM) for 10, 20, 30 min for MCF-7 cells or for 15, 30, 45 min for MCF-7/Adr cells at room temperature, avoiding light exposure. Verapamil (10 µM) was used as a positive control. The intra-nuclei and intra-mitochondria concentrations of adriamycin were quantified by LC-MS/MS. Protein concentrations of nuclei and mitochondria were measured by the Bradford method.
To detect intracellular P-gp expression in situ, MCF-7 and MCF-7/Adr cells were seeded on coverslips overnight. After fixation, permeabilization and blocking, the cells were incubated with primary monoclonal antibody to P-gp (1:100, clone MM4.17, Millipore, USA) overnight at 4°C. After being washed, the cells were incubated with secondary antibody TRITC-conjugated goat anti-mouse IgG (1:200, Bioworld, USA) for 1 h at 37°C and then were washed again. For the triplex-labelling of nuclei, mitochondria and P-gp, the cells were first labelled for P-gp as described above. Then Hoechst 33342 and Mito-Tracker Green were added and incubated for 30 min at 37°C. After being washed, the cells were imaged by a Carl Zeiss LSM 710 laser scanning confocal microscope system (Zeiss, Germany) with identical settings for each confocal study.
For Western blotting analysis, crude membranes were prepared as described previously (Zhang et al., 2010). Nuclei and mitochondria were isolated according to KeyGen Mitochondria/Nuclei Isolation Kit. Protein concentrations were measured by the bicinchoninic acid method (Smith et al., 1985) using BCA protein assay kit (Pierce Chemical, Rockford, IL, USA). Protein samples were separated on an 8% SDS-PAGE and transferred onto a PVDF membrane (Millipore, USA). The membrane was blocked with 5% non-fat milk in Tris-buffered saline/Tween 20 (TBS/T) for 1 h at 37°C, and then incubated with the primary monoclonal antibody to P-gp (1:800, clone3C3.2, Millipore, USA), β-actin (1:200, Boster Biological Technology, China), Lamin B (1:200, Boster Biological Technology, China) or COX IV (1:1000, Beyotime Institute of Biotechnology, China) overnight at 4°C. After being washed, the membrane was incubated with secondary antibody horseradish peroxidase-conjugated goat anti-mouse IgG (1:8000, Boster Biological Technology, China) for 1 h at 37°C. The signals were detected by an enhanced chemiluminescence kit (Pierce Chemical, Rockford, IL, USA). The chemiluminescent signal was captured by Bio-Rad ChemiDoc™ XRS+ System (Bio-Rad, USA).
LC-MS/MS method for adriamycin quantification
Briefly, a 50 µL aliquot of the sample was protein-precipitated with 150 µL methanol (containing azithromycin as internal standard). After centrifugation, 10 µL of the supernatant was injected into Finnigan TSQ LC-MS/MS (Thermo Electron, San Jose, CA, USA) for analysis with a Luna C18 column (150 × 2.0 mm, 5 µm, Phenomenex, USA). The column and autosampler tray temperatures were at 40 and 4°C, respectively. The mobile phase consisted of solvent A (0.1 % formic acid) and solvent B (methanol) with the following gradient: 0 min; 20% B→0.5 min; 20% B→0.8 min; 80% B→4 min; 80% B→5.5 min; 20% B→8 min; 20% B. The flow rate was 0.2 mL·min−1. The mass spectrometer was operated in positive electrospray ionization (ESI) mode. MS parameters were as follows: spray voltage, 4.8 kV; sheath gas/auxiliary gas, nitrogen; sheath gas pressure, 42 × 105 Pa; auxiliary gas pressure, 6 × 10⁵ Pa; ion transfer capillary temperature, 285°C. Quantification was performed using selective reaction monitoring mode: m/z 544.7→361.0 at 24 eV for adriamycin; m/z 749.7→591.4 at 27 eV for azithromycin (internal standard).
Data analysis
Data are expressed as mean ± SEM (or mean ± SD for PK-PD modelling data). Statistical analysis included two-tailed Student's t-test, one-way anovaand non-parametric Kruskal–Wallis test. The difference was considered to be statistically significant if the probability value was less than 0.05 (P < 0.05).
Results
Reversal of P-gp-mediated adriamycin resistance in MCF-7/Adr cells by 20(S)-Rh2
In the present study, the IC50 values of MCF-7 cells and their derivatives MCF-7/Adr cells were 0.42 µM and 87.72 µM, respectively, which showed that MCF-7/Adr cells were highly resistant to the effects of adriamycin. When more than 90% of cells were viable, co-incubation of MCF-7/Adr cells with various concentrations of 20(S)-Rh2 (1, 5, 10 µM) for 72 h decreased the IC50 of adriamycin in MCF-7/Adr cells concentration-dependently (Figure 2A).
Figure 2.
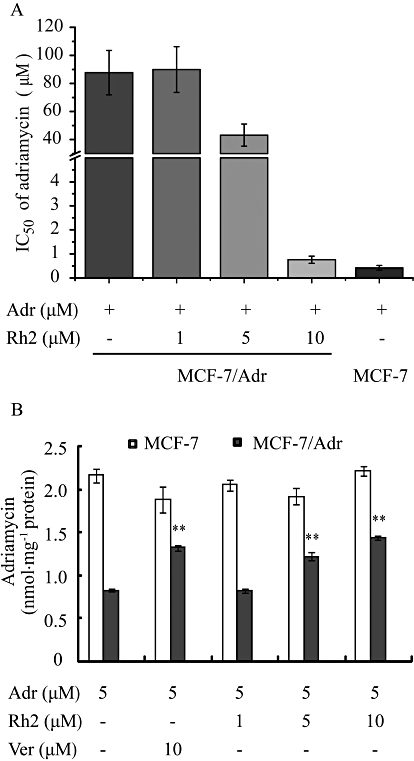
(A) Reversal effects of 20(S)-Rh2 on P-gp-mediated adriamycin resistance. MCF-7 and MCF-7/Adr cells were cultured for 72 h in the absence or presence of 20(S)-Rh2 (1, 5, 10 µM) with various concentrations of adriamycin (0.01, 0.03, 0.1, 0.3, 1, 3, 10, 30, 100 µM). (B) Effects of 20(S)-Rh2 on the accumulation of adriamycin in MCF-7 and MCF-7/Adr cells. Cells were pre-incubated with 20(S)-Rh2 for 1 h followed by a further 2 h incubation in the presence of 5 µM adriamycin. Data are the mean ± SEM of three independent experiments. **P < 0.01 versus control.
20(S)-Rh2 enhanced intracellular accumulation of adriamycin in MCF-7/Adr cells
The accumulation of adriamycin in MCF-7/Adr cells was 2.6-fold lower than that in MCF-7 cells, which is one of the major reasons for adriamycin-resistance in MCF-7/Adr cells. To correlate the reversal effect of 20(S)-Rh2 on MDR with its P-gp inhibitory effect, the cellular accumulation of adriamycin in the absence or presence of 20(S)-Rh2 (1, 5, 10 µM) was assessed in both MCF-7 and MCF-7/Adr cells using LC-MS/MS analysis. In MCF-7/Adr cells, 20(S)-Rh2 significantly increased adriamycin accumulation in a concentration-dependent manner (P < 0.01), and the potency of 20(S)-Rh2 (10 µM) was comparable to that of the established P-gp inhibitor verapamil at the same concentration. However, neither 20(S)-Rh2 nor verapamil had any effect in MCF-7 cells (Figure 2B).
20(S)-Rh2 increased the subcellular distribution of adriamycin in fixed and live MCF-7/Adr cells
As the nucleus is the target of adriamycin, we monitored the nuclear accumulation of adriamycin qualitatively and quantitatively in fixed MCF-7 and MCF-7/Adr cells by use of High Content Screening technology. As shown in Figure 3A, adriamycin (red fluorescence) was primarily located in the nuclei (blue fluorescence) of MCF-7 cells, which consequently leads to purple fluorescence. In contrast, much less adriamycin entered into MCF-7/Adr cells, and adriamycin was mainly located at the periphery of nuclei. With increasing concentrations of 20(S)-Rh2, both the cellular accumulation of adriamycin was increased and the accumulation of adriamycin in nuclei was augmented. Verapamil, used as positive control, showed similar effects. Fluorescence quantification (Figure 3B) showed that the accumulation of adriamycin in nuclei in MCF-7 cells was fourfold higher than that in MCF-7/Adr cells, and 20(S)-Rh2 enhanced the accumulation of adriamycin in nuclei in MCF-7/Adr cells concentration-dependently, which was comparable to verapamil at the same concentration. Neither 20(S)-Rh2 nor verapamil had an effect on adriamycin accumulation in MCF-7 cells.
Figure 3.
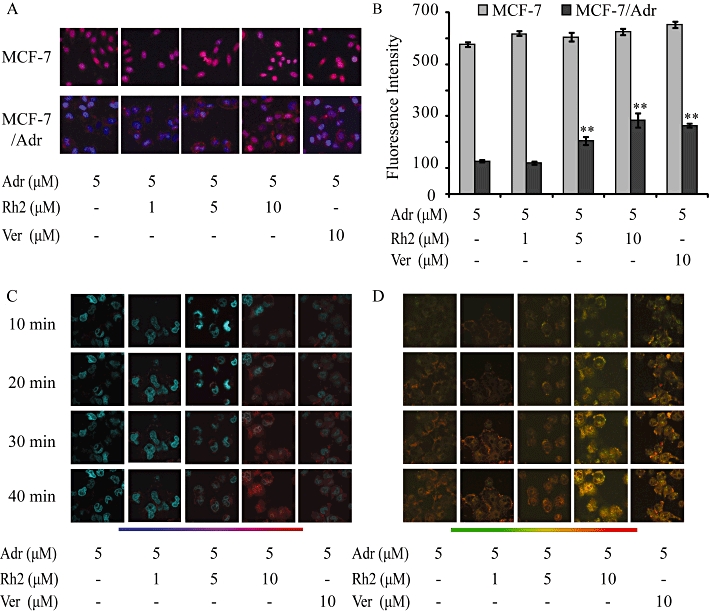
Effects of 20(S)-Rh2 on the subcellular distribution of adriamycin in fixed and live cells. (A)Representative images of MCF-7 and MCF-7/Adr cells treated with 5 µM adriamycin for 2 h with or without 20(S)-Rh2, followed by fixation, staining and observation on Cellomics ArrayScan® VTI HCS (red and blue fluorescence represent adriamycin and nuclei, respectively. Purple fluorescence is an overlay of red and blue fluorescence). (B)Fluorescence quantification of the accumulation of adriamycin in nuclei acquired from accessory image analysis software are presented as mean ± SEM. **P < 0.01 versus control. (C, D) Time-course analysis of adriamycin accumulation in nuclei (C) and mitochondria (D) in the absence or presence of 20(S)-Rh2 for 10, 20, 30, 40 min in live MCF-7/Adr cells obtained by laser scanning confocal microscopy (400 magnification), after prestaining of nuclei and mitochondria with Hoechst 33342 and Mito-Tracker Green, respectively.
To further confirm the subcellular distribution of adriamycin in live cells, Laser Scanning Confocal Microscopy (LSCM) was used for detection of adriamycin in specific organelles. In MCF-7/Adr cells, there was little adriamycin in the nuclei until 40 min, but an obvious amount of adriamycin in the mitochondria (reddish brown fluorescence). In the presence of 20(S)-Rh2 (1, 5, 10 µM), both the rate and extent of adriamycin which was distributed into the nuclei and mitochondria were significantly enhanced. 20(S)-Rh2 (10 µM) obviously accelerated the penetration of adriamycin into nuclei (purple fluorescence) and mitochondria (flaming yellow fluorescence) 20 min after adriamycin addition, and effected a significant increase in adriamycin accumulation in the nuclei and mitochondria at 40 min, which was comparable to the effect of verapamil (10 µM).
20(S)-Rh2 altered the kinetic profiles for the subcellular distribution of adriamycin
To quantitatively analyse the time course for the subcellular distribution of adriamycin in the absence or presence of 20(S)-Rh2, a cell fraction approach was used to separate nuclei and mitochondria from MCF-7 and MCF-7/Adr cells. As shown in Figure 4, in MCF-7 cells, the maximum amount of adriamycin accumulated in nuclei was achieved as early as 30 min (approximately 100 nM). Adriamycin accumulation in mitochondria was linear for the first 45 min, and was boosted at 60 min. Meanwhile, adriamycin increased linearly in the cytosol throughout the 60 min. There was no difference between the control group and 20(S)-Rh2-treated groups. However, in MCF-7/Adr cells the nuclear uptake rate of adriamycin was quite slow; it took 90 min to reach the maximum (only approximately 40 nM). Furthermore, in MCF-7/Adr cells adriamycin accumulation in mitochondria and cytosol were not increased linearly throughout 180 min and in the presence of 20(S)-Rh2, the uptake rate and accumulation of adriamycin in nuclei, mitochondria and cytosol were all elevated significantly in a concentration-dependent manner.
Figure 4.
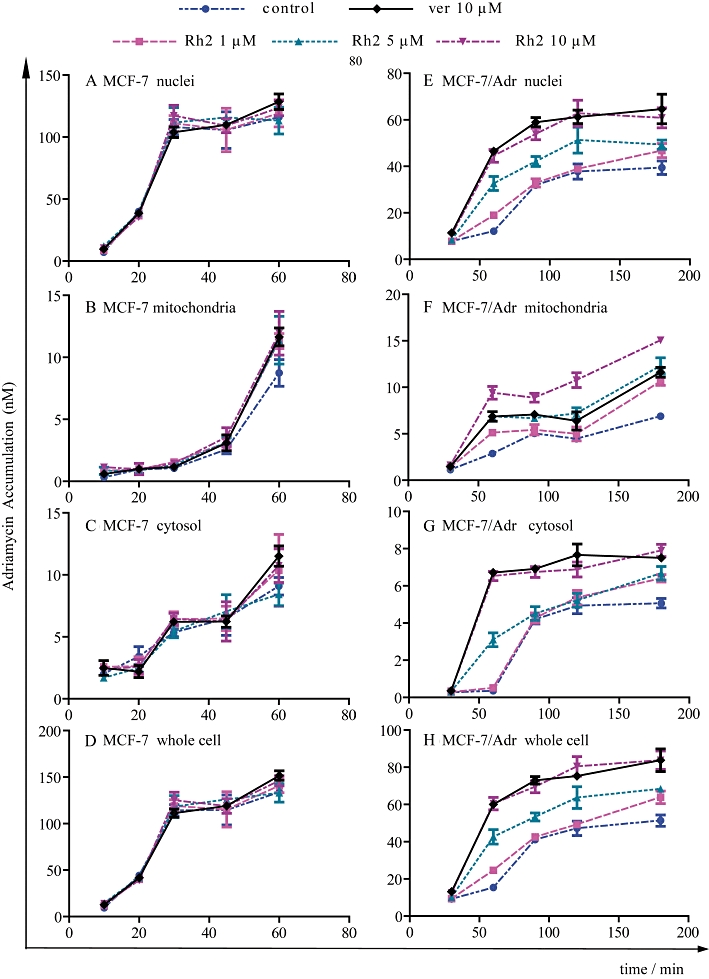
Time-course analysis of the subcellular accumulation of adriamycin in MCF-7 cells and MCF-7/Adr cells obtained with the cell fraction approach. Cells were incubated with 5 µM adriamycin in the absence or presence of 20(S)-Rh2 for 10, 20, 30, 45, 60 min in MCF-7 cells (A–D) or 30, 60, 90, 120, 180 min in MCF-7/Adr cells (E–H). Then nuclei, mitochondria and cytosol were extracted and adriamycin concentrations were quantifed by LC-MS/MS. Data are the mean ± SEM of three independent experiments.
20(S)-Rh2 potentially promoted adriamycin-induced early apoptosis in MCF-7/Adr cells
In our experiments, the early apoptosis indicator Annexin V/7-AAD was not altered markedly with time, while the 3 h treated group showed that 20(S)-Rh2 tended to promote adriamycin-induced apoptosis in a concentration-dependent manner (Figure 5A). Adriamycin (5 µM) plus 20(S)-Rh2 (10 µM) cells showed an obvious increase in FITC fluorescence, which indicated an increased population of early apoptotic cells (Annexin V+/7-AAD-). As the time period for monitoring apoptosis in this experiment was too short (the longest was 3 h) to measure significant apoptosis, the indicator of apoptosis should be sensitive enough to detect the trace levels of early apoptosis.
Figure 5.
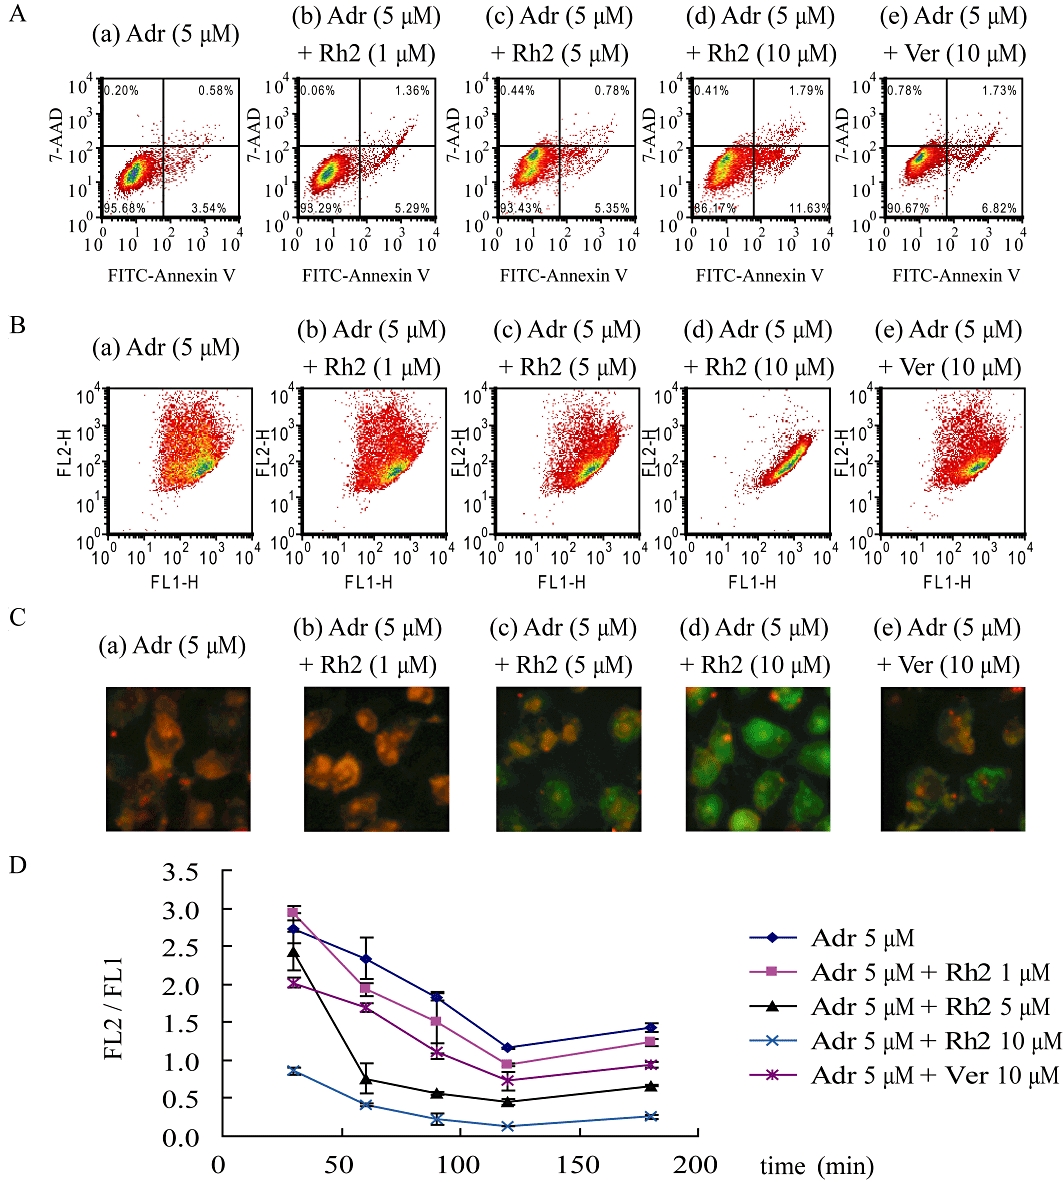
Adriamycin-induced apoptosis in the absence or presence of 20(S)-Rh2 in MCF-7/Adr cells. MCF-7/Adr cells were treated with adriamycin or adriamycin plus various concentrations of 20(S)-Rh2 for 30, 60, 90, 120, 180 min, respectively. (A) The representative flow cytometry diagrams of MCF-7/Adr cells treated with adriamycin minus or plus 20(S)-Rh2 for 3 h, stained with Annexin V/7-AAD and analysed on flow cytometry (viable cells are in the lower left quadrant, early apoptotic cells are in the lower right quadrant, late apoptotic cells are in the upper right quadrant and non-viable necrotic cells are in the upper left quadrant.). The representative flow cytometry diagrams (B), and fluorescence microscopy images (C) of MCF-7/Adr cells treated with adriamycin minus or plus 20(S)-Rh2 for 2 h, and stained with JC-1. (D) Quantitative analysis of JC-1-stained cells by flow cytometry presented as the ratio of red fluorescence intensity to green fluorescence intensity. Data are the mean ± SEM of three independent experiments.
The loss of MMP is a hallmark for apoptosis, which is an early event preceding PS externalization and caspase activation. As shown in Figure 5B,C, adriamycin induced a decrease in MMP (an increased green fluorescence signal and a decreased red fluorescence signal) in MCF-7/Adr cells in a time-dependent manner. When co-treated with 20(S)-Rh2, MCF-7/Adr cells exhibited an augmented decrease in MMP in a 20(S)-Rh2 concentration-dependent manner.
20(S)-Rh2 altered PK/PD parameters of adriamycin in MCF-7/Adr cells
The PK-PD model reasonably described the PK and PD profiles of adriamycin in MCF-7/Adr and/or MCF-7 cells with or without 20(S)-Rh2. As shown in Figure 6, the fitting results matched the measured values reasonably well.
Figure 6.
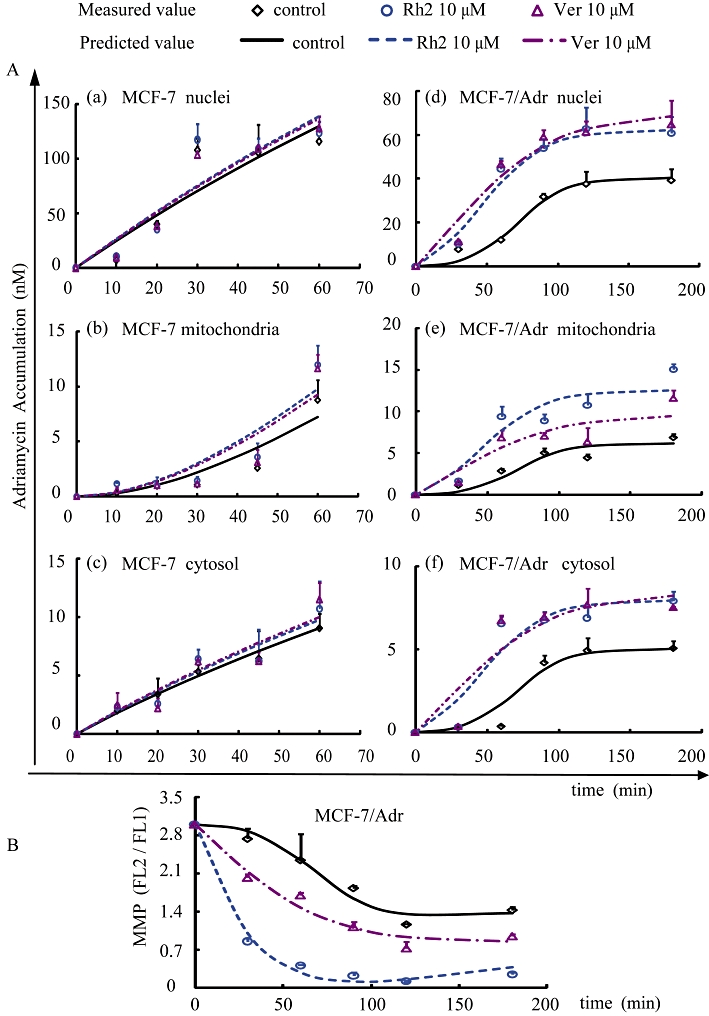
(A) Concentration–time curves for the accumulation of adriamycin in the MCF-7 cells and MCF-7/Adr cells with or without 20(S)-Rh2 are shown in panels a–c and d–f, respectively. (B) The MMP–time profiles induced by adriamycin in the absence or presence of 20(S)-Rh2 in MCF-7/Adr cells. Observations are reported as mean ± SD (n= 3), and the lines are depicted using the parameters obtained from the original data.
The model simulation results indicate that adriamycin passively diffuses into MCF-7 cells, as the adriamycin concentration in each compartment increased linearly with time. However, a saturation of adriamycin accumulation appeared in MCF-7/Adr cells with a marked platform in the concentration–time curve, suggesting the involvement of P-gp. As indicated in Table 1, the permeability of adriamycin through cytosol (P1), nuclei (P2) and mitochondria (P3) in MCF-7 cells were significantly higher than that in MCF-7/Adr cells, while the threshold values (xm) for each cellular compartment in MCF-7/Adr cells were lowered compared to those in parent MCF-7 cells. Meanwhile, the marked differences in the transport rate constants (k) of adriamycin across each cellular compartment between the two cell lines could also be observed: elevated k1 and k3, while k2 decreased in MCF-7/Adr cells.
Table 1.
Pharmacokinetic and pharmacodynamic parameters of adriamycin in MCF-7 and MCF-7/Adr cells with or without 20(S)-Rh2
| MCF-7 | MCF-7/Adr | |||||||||||
|---|---|---|---|---|---|---|---|---|---|---|---|---|
| Adr 5 µM | Adr 5 µM + 20(S) Rh2 10 µM | Adr 5 µM + Ver 10 µM | Adr 5 µM | Adr 5 µM + 20(S)-Rh2 10 µM | Adr 5 µM + Ver 10 µM | |||||||
| Parameter | Originala dataset | Bootstrapb dataset | Originala dataset | Bootstrapb dataset | Originala dataset | Bootstrapb dataset | Originala dataset | Bootstrapb dataset | Original a dataset | Bootstrapb dataset | Originala dataset | Bootstrapb dataset |
| Pharmacokinetics | ||||||||||||
| P1 (×10−3, \) | 6.26 ± 0.75 | 6.39 ± 0.64 | 7.49 ± 1.92 | 6.87 ± 1.13 | 7.49 ± 1.06 | 7.08 ± 0.50 | 1.00 ± 0.00 | 1.00 ± 0.01 | 1.58 ± 0.08** | 1.59 ± 0.03 | 1.67 ± 0.10** | 1.69 ± 0.04 |
| k1 (min−1) | 0.12 ± 0.01 | 0.12 ± 0.01 | 0.12 ± 0.03 | 0.12 ± 0.01 | 0.11 ± 0.01 | 0.12 ± 0.01 | 0.62 ± 0.004 | 0.61 ± 0.01 | 0.47 ± 0.01** | 0.47 ± 0.02 | 0.32 ± 0.05** | 0.28 ± 0.01 |
| xm1 (nM) | 123.9 ± 1.9 | 124.19 ± 1.26 | 118.6 ± 8.5 | 116.74 ± 3.15 | 117.91 ± 0.53 | 117.70 ± 1.10 | 5.08 ± 0.01 | 5.09 ± 0.02 | 9.02 ± 0.03** | 8.97 ± 0.13 | 12.48 ± 0.75** | 13.11 ± 0.22 |
| P2 (\) | 14.8 ± 1.5 | 14.58 ± 0.64 | 14.1 ± 0.6 | 14.20 ± 0.86 | 13.52 ± 0.75 | 13.80 ± 0.35 | 8.30 ± 0.46 | 8.06 ± 0.27 | 8.06 ± 0.34 | 7.93 ± 0.26 | 8.30 ± 0.49 | 8.29 ± 0.27 |
| k2(min−1) | 1.76 ± 0.14 | 2.07 ± 0.44 | 3.25 ± 1.43 | 2.46 ± 0.59 | 2.26 ± 0.12 | 2.31 ± 0.32 | 0.98 ± 0.08 | 0.97 ± 0.14 | 3.84 ± 0.11** | 3.82 ± 0.23 | 2.15 ± 0.73** | 1.70 ± 0.52 |
| xm2 (nM) | 111.6 ± 0.2 | 111.66 ± 0.65 | 111.7 ± 0.000 | 111.77 ± 1.09 | 111.7 ± 0.006 | 111.6 ± 0.8 | 38.32 ± 0.00 | 38.4 ± 0.35 | 61.43 ± 0.06** | 61.50 ± 1.12 | 38.19 ± 0.20 | 38.4 ± 0.66 |
| P3 (\) | 4.12 ± 0.25 | 4.11 ± 0.31 | 4.29 ± 0.54 | 4.43 ± 0.38 | 4.03 ± 0.09 | 4.14 ± 0.20 | 1.26 ± 0.03 | 1.23 ± 0.03 | 1.60 ± 0.07** | 1.59 ± 0.04 | 1.12 ± 0.11 | 1.14 ± 0.04 |
| k3 (min−1) | 0.0079 ± 0.0008 | 0.0080 ± 0.0001 | 0.0098 ± 0.001 | 0.0095 ± 0.0001 | 0.0091 ± 0.0004 | 0.0096 ± 0.0001 | 2.49 ± 0.02 | 2.5 ± 0.20 | 3.11 ± 0.02** | 3.07 ± 0.28 | 1.86 ± 0.31 | 1.51 ± 0.41 |
| xm3 (nM) | 182.6 ± 0.05 | 182.59 ± 0.92 | 182.7 ± 0.04 | 182.73 ± 0.66 | 182.78 ± 0.006 | 182.75 ± 0.32 | 12.43 ± 0.00 | 12.4 ± 0.27 | 15.2 ± 0.07** | 15.2 ± 0.37 | 12.38 ± 0.21 | 12.4 ± 0.08 |
| Pharmacodynamics | ||||||||||||
| kr (×10−3, min−1) | 5.78 ± 6.38 | 3.81 ± 2.95 | 486.31 ± 30.08** | 541.98 ± 87.49 | 34.35 ± 12.16* | 27.57 ± 4.23 | ||||||
| r (\) | 0.87 ± 0.38 | 0.94 ± 0.24 | 0.06 ± 0.00* | 0.05 ± 0.01 | 0.32 ± 0.04 | 0.34 ± 0.03 | ||||||
| xem1 (nM) | 5.82 ± 0.92 | 5.28 ± 0.56 | 8.46 ± 0.46* | 8.56 ± 0.65 | 8.18 ± 0.09* | 8.21 ± 0.26 | ||||||
| xem2 (nM) | 34.91 ± 0.36 | 35.2 ± 0.81 | 56.05 ± 0.15** | 56.3 ± 1.96 | 55.82 ± 0.40** | 56.0 ± 0.41 | ||||||
| xem3 (nM) | 6.38 ± 0.61 | 6.46 ± 0.41 | 9.46 ± 0.41** | 10.00 ± 0.75 | 12.45 ± 0.47** | 12.11 ± 0.38 | ||||||
Abbreviations: Adr, adriamycin; Ver, verapamil.
Estimates from the fit of original data are expressed as mean ± SD (n= 3 in each group).
Values are reported as mean ± SD of individual estimates (n= 200).
P < 0.05
P < 0.01 versus Adr 5 µM group in MCF-7/Adr cells (based on Student's two-tailed t-test).
In the presence of 20(S)-Rh2 or verapamil, the threshold values for both PK (xm) and PD (xem) models in MCF-7/Adr cells were increased. It was also found that in MCF-7/Adr cells 20(S)-Rh2 not only enhanced the permeability of adriamycin through cytosol (P1) and mitochondria (P3), but also increased the transport rate constant of adriamycin across nuclei (k2) and mitochondria (k3). It is interesting to note that, 20(S)-Rh2 decreased the transport rate constant of adriamycin from extracellular compartment to cytosol (k1) in MCF-7/Adr cells. Correspondingly, 20(S)-Rh2 significantly enhanced the attenuation rate of MMP (kr) induced by adriamycin in MCF-7/Adr cells.
Analysis of the functions and expressions of subcellular P-gp
As shown in Figure 7A, adriamycin accumulation in isolated nuclei of MCF-7 cells was significantly higher than that in MCF-7/Adr cells (Figure 7A-a,c), while adriamycin accumulation in isolated mitochondria of MCF-7 cells was lower than that in MCF-7/Adr cells (Figure 7A-b,d); this might be one cause of adriamycin resistance. In MCF-7/Adr cells, adriamycin accumulation in isolated nuclei was increased with time and increased concentrations of 20(S)-Rh2 (Figure 7A-c). In contrast, adriamycin accumulation in isolated mitochondria was decreased with increasing concentrations of 20(S)-Rh2 (Figure 7A-d). However, no such effect of 20(S)-Rh2 occurred in MCF-7 cells (Figure 7A-a,b).
Figure 7.
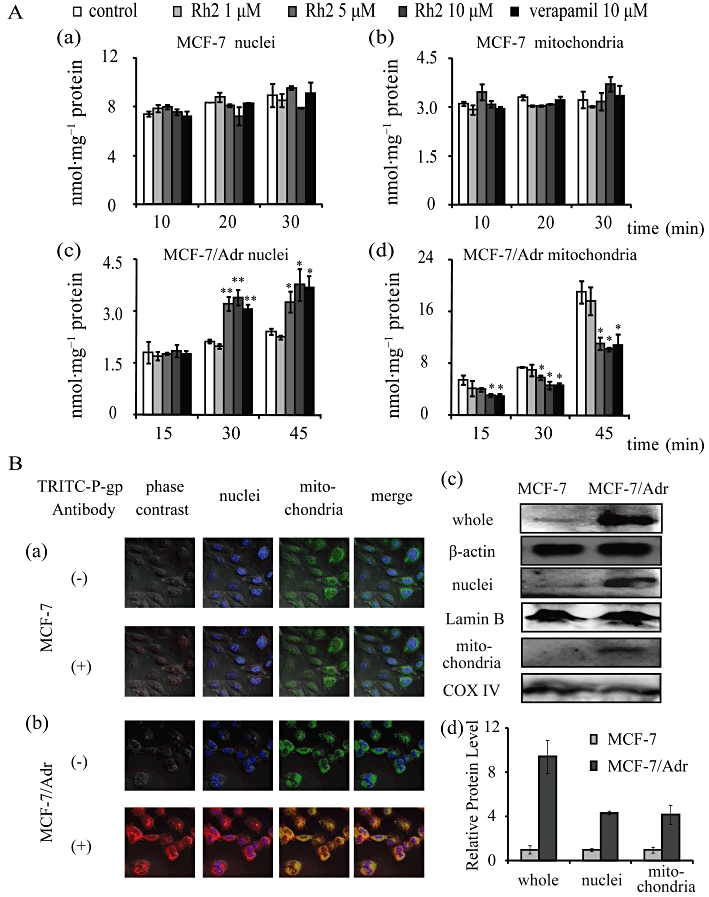
(A) Adriamycin accumulation in isolated nuclei and mitochondria of MCF-7 and MCF-7/Adr cells. The isolated nuclei or mitochondria were incubated with 5 µM adriamycin minus or plus 20(S)-Rh2 (1, 5, 10 µM) for 10, 20, 30 min for MCF-7 cells (a and b) or for 15, 30, 45 min for MCF-7/Adr cells (c and d) at room temperature, avoiding light exposure. Data are the mean ± SEM of three independent experiments. *P < 0.05, **P < 0.01 versus control. (B) Detection of intracellular P-gp expression in MCF-7 and MCF-7/Adr cells. For immunofluorescence analysis, after washing and cell fixation, P-gp was labelled with primary antibody and TRITC-tagged secondary antibody, and then nuclei and mitochondria were stained by Hoechst 33342 and Mito-Tracker Green, respectively. Co-localization analysis of P-gp intracellular distribution in MCF-7 cells (a) and MCF-7/Adr cells (b) was achieved by laser scanning confocal microscopy (400 magnification). Red, blue and green fluorescence indicates P-gp, nuclei and mitochondria, respectively. The overlay between red fluorescence (P-gp) and blue fluorescence (nuclei)/green fluorescence (mitochondria) suggests a high expression of P-gp in nuclei and mitochondria of MCF-7/Adr cells. For Western blot analysis, proteins from whole cell, nuclei lysates or mitochondrial lysates were resolved by SDS-PAGE (c) and quantified as mean ± SEM of three independent experiments for relative protein level (d).
Immunofluorescence staining was used to determine whether an alteration in the intracellular distribution of P-gp is involved in MDR. As shown in Figure 7B, P-gp is overexpressed not only in the cytomembrane, but also in nuclei and mitochondria of MCF-7/Adr cells. Western blot analysis further verified our initial observation.
Discussion and conclusions
Breast cancer is the most common cancer for women throughout the world (Althuis et al., 2005; Rivera, 2010), and the classic treatment with anthracyclines often encounters MDR. Among the many factors involved in anthracycline resistance, P-gp is the protein most studied for drug resistance (Kroger et al., 1999). DNA is the target of anthracyclines (Arcamone et al., 1997), therefore, cellular pharmacokinetic strategies have focused on the relationship between anthracycline resistance, P-gp and the drug target.
As demonstrated in our MTT assay, MCF-7/Adr cells were 200-fold more resistant to adriamycin than MCF-7 cells (Figure 2A). Correspondingly, Western blot analysis showed that the expression of P-gp in MCF-7/Adr cells is extremely high compared to MCF-7 cells (Figure 7B-c). These results are similar to those found previously (Yu et al., 2007; Tao et al., 2009; Hien et al., 2010) and assure us that the cell model used in our experiment is credible.
In our previous studies, we demonstrated that 20(S)-Rh2 is a non-competitive inhibitor of P-gp (Zhang et al., 2010). In this study, we found that the cellular retention of adriamycin in MCF-7/Adr cells, which was less than half of that in MCF-7 cells (Figure 2B), was increased significantly by 20(S)-Rh2. However, 20(S)-Rh2 had no effect on the accumulation of adriamycin in MCF-7 cells. Therefore, we hypothesize that the decreased cellular accumulation of adriamycin in MCF-7/Adr cells might be the cause of adriamycin resistance, and the inhibitory effect of 20(S)-Rh2 on P-gp possibly leads to the synergistic effect of non-toxic concentrations of 20(S)-Rh2 with adriamycin in the MTT assay.
As the accumulation of adriamycin into its target nuclei governs its cytotoxic effect, the accumulation of adriamycin in nuclei in the absence and presence of 20(S)-Rh2 was qualitatively and quantitatively analysed by use of a Cellnomics High Content Screening platform in fixed cells. The contrast between nuclei accumulation of adriamycin in the control group of MCF-7 with that of MCF-7/Adr cells indicated that the prevention of the uptake of adriamycin into nuclei is the major cause of adriamycin resistance in MCF-7/Adr cells. In addition, 20(S)-Rh2 enhanced the amount of adriamycin present in the nuclear fraction by inhibition of P-gp (Figure 3A). As the mitochondria is also an important organelle in cellular structure and function, and has been reported to be linked with adriamycin resistance (Munteanu et al., 2006), we monitored the accumulation of adriamycin in both nuclei and mitochondria using a staining technique. Direct optical observation (Figure 3C,D) suggested that 20(S)-Rh2 also promoted subcellular accumulation of adriamycin. Similar investigations were conducted by Fei Shen and colleagues, in which they found that several P-gp modulators could increase nuclei and cytoplasm accumulation of adriamycin and mitoxantrone (Shen et al., 2008; 2009).
However, the dynamic profiles obtained from LSCM do not indicate absolute drug concentrations but fluorescent intensities. Metabolites of adriamycin or other substances might interfere with adriamycin fluorescence, which could affect the interpretation of the results. It is also possible that the cells themselves are affected by length of time that they are kept in nonsterile conditions with LSCM. In contrast, with the cell fraction approach, the subcellular localization of small molecule compounds can be quantitatively evaluated (Duvvuri et al., 2004), and the cells can be kept in sterile conditions until the isolation of organelles is complete.
From our findings, the time–concentration curves illustrate that there are significant differences in cellular pharmacokinetic behaviour of adriamycin between MCF-7 and MCF-7/Adr cells. This is in good agreement with our optical observations, and further provides more accurate quantitative results. We further determined if the ability of 20(S)-Rh2 to increase the cellular/subcellular accumulation of adriamycin directly strengthens the cytotoxic effect of adriamycin. Cell apoptosis was determined using the same time point and doses as the cellular pharmacokinetic study. With increasing concentrations of 20(S)-Rh2, the cellular/subcellular accumulations of adriamycin were increased, and MMP reduced correspondingly. But the augmented early apoptosis denoted by PS in the presence of 20(S)-Rh2 was only observed at the end of the experiment. This is because the early apoptosis indicator PS was not as sensitive as the previous early apoptosis indicator MMP when the treatment time is short (Korper et al., 2003; Halder et al., 2008; Guha et al., 2011). Thus, a marked link between cytotoxic effect and subcellular accumulation of adriamycin was observed, and an integrated PK-PD model was further established.
Initially, a compartment model, Michaelis–Menten model and logistic model were tried for PK modelling. However, neither the compartment model nor the Michaelis–Menten model fitted or matched our results well. Only the logistic model could describe the cellular pharmacokinetic behaviours of adriamycin in cells. This is because: (i) the amount of adriamycin in each subcellular organelle accumulated with time, which is a monotony course; (ii) with the decrease in concentration differences, the net transport of adriamycin also slowed down; and (iii) the concentration–time curves in each subcellular organelle were characterized as sigmoid curves. These three characteristics mentioned above are in high accordance with a logistic model (Peleg, 1997).
The PK/PD parameters calculated mathematically revealed the mechanisms of adriamycin resistance and the reversal effect of 20(S)-Rh2 from a cellular pharmacokinetic view (Figure 8). The threshold value of adriamycin in each cellular compartment (xm) determined the content of adriamycin in that compartment. When the content of adriamycin was beyond xm, adriamycin would flow out of the compartment. As to the permeability parameter (P), it is an apparent permeability, which is directly linked to the net retention of adriamycin. In MCF-7/Adr cells, both xm and P were all much lower than those in MCF-7 cells, which reflected the nature of MDR in MCF-7/Adr cells. Also, the transport rate constant (k) of adriamycin into nuclei (k2) of MCF-7/Adr cells was lower than that in MCF-7 cells, while it was just the opposite for the transport rate constant of adriamycin in the cytosol (k1) or mitochondria (k3). The increased k might be compensating for the sharply decreased P in MCF-7/Adr cells. As the membrane structure of nuclei is different from that of the cytomembrane or mitochondrial membrane, which are lipid bilayers, there might be no compensation occurring at the nuclear membrane resulting in a decreased k2. In the presence of 20(S)-Rh2, xm and P were all elevated except for P2. There could be a few reasons for this increase. For one, 20(S)-Rh2 inhibits P-gp, causing more net retention of adriamycin. Secondly, 20(S)-Rh2 interacts with the lipid bilayer membranes, influencing the physical properties of the membrane such as membrane fluidity (Yi et al., 2009; Jiang et al., 2010). As for the unchanged P2, this might be linked to the uniqueness of the nuclear membrane structure. As k is related to the content of adriamycin in each compartment, the enhanced adriamycin accumulation in nuclei and mitochondria induced by 20(S)-Rh2 are coupled with an augmented k2 and k3. However, in the cytosol a redistribution of adriamycin into other subcellular compartments occurred, decreasing k1.
Figure 8.
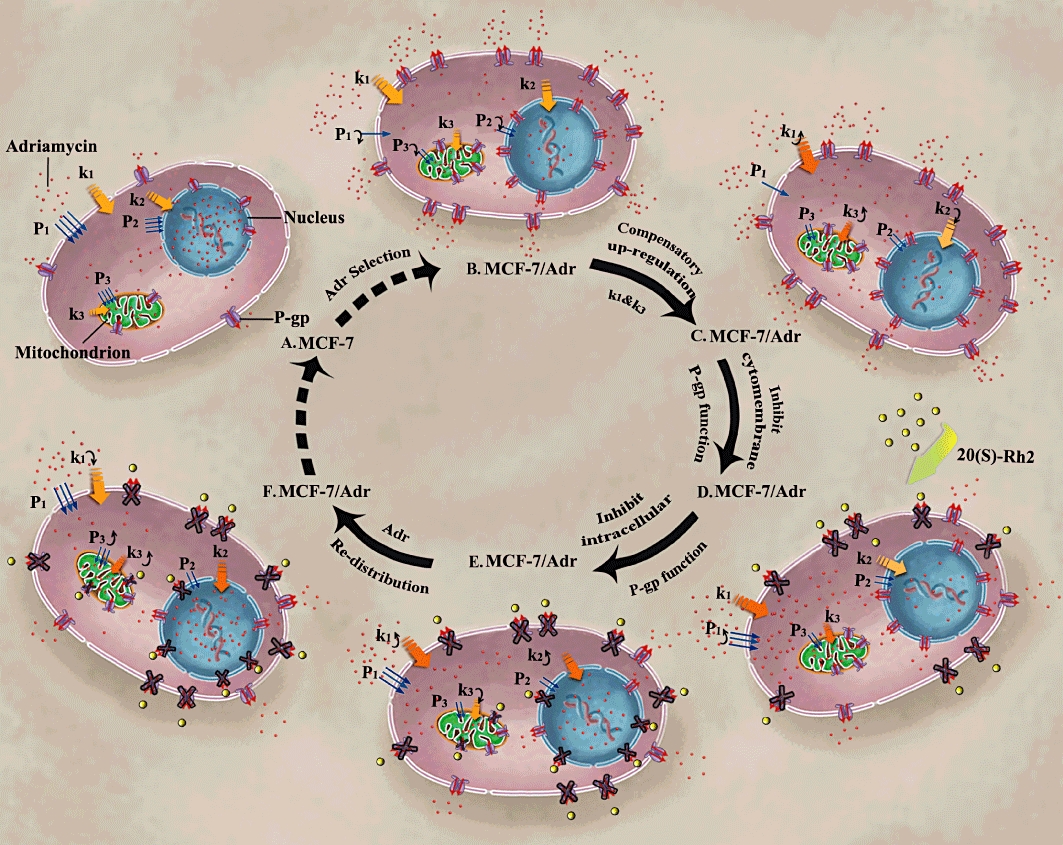
Proposed cellular pharmacokinetic mechanisms of adriamycin resistance in MCF-7/Adr cells (B,C) compared to MCF-7 cells (A), and the reversal effect of 20(S)-Rh2 in MCF-7/Adr cells (D–F). (A) Adriamycin-sensitive cells; (B) adriamycin-resistant cells, with decreased permeability; (C) adriamycin-resistant cells, with increased transport rate constant (k1, k3) for compensation; (D) 20(S)-Rh2-treated adriamycin-resistant cells, with inhibited P-gp in cytomembrane; (E) 20(S)-Rh2-treated adriamycin-resistant cells, with inhibited P-gp in mitochondria and nuclei membrane; (F) 20(S)-Rh2-treated adriamycin-resistant cells, redistribution of adriamycin with complete inhibition of P-gp at all levels.
All the above results suggest the existence of intracellular P-gp in MCF-7/Adr cells, so the function and expression of subcellular P-gp was subsequently analysed. Uptake assays in isolated nuclei and mitochondria were performed. Unexpectedly, 20(S)-Rh2 and verapamil decreased adriamycin accumulation in isolated mitochondria of MCF-7/Adr cells (Figure 7A), which was opposite to our results from previous experiments. This phenomenon has also been observed in isolated mitochondria of K562/MDR cells and cadmium-exposed oyster gills (Munteanu et al., 2006; Ivanina and Sokolova, 2008). Previous investigators have suggested that mitochondrial P-gp orientates in a direction opposite to that of cytomembrane P-gp, pumping drugs from the cytoplasm into mitochondria thus protecting nuclear targets from adriamycin, which might be another possible mechanism of adriamycin resistance (Munteanu et al., 2006). With regard to the different effect of the P-gp inhibitor 20(S)-Rh2 on adriamycin accumulation between mitochondria of intact live cells and isolated mitochondria, it may be due to 20(S)-Rh2 inhibiting cytomembrane P-gp, which would lead to large amounts of adriamycin entering the cells and causing mitochondria to be exposed to more adriamycin than those in the control group. Therefore, even if 20(S)-Rh2 inhibited the inverted P-gp in mitochondria, the decreased level of adriamycin induced by mitochondrial P-gp inhibition would be overwhelmed by an increased amount of adriamycin entering the mitochondria as a result of cytomembrane P-gp inhibition. Hence, P-gp inhibitors would cause an increased amount of adriamycin to be accumulated in mitochondria. Another cause of the discrepancy could be differences in the concentrations of adriamycin between the organelles and cytosol in intact live cells.
The high subcellular expression of P-gp in the cytomembrane, nuclei and mitochondria of MCF-7/Adr cells was further confirmed by immunocytochemistry and Western blot assays. These results linked the sequestration of adriamycin away from its target mediated by P-gp and the MDR reversal effect of 20(S)-Rh2 through P-gp inhibition. Moreover, the organic cation transporter SLC22A16 was recently reported to induce an influx of adriamycin, which might also cause adriamycin resistance (Ota et al., 2007; Sato et al., 2007). The expression of SLC22A16 and its role in adriamycin resistance in MCF-7/Adr cells is currently under investigation.
In conclusion, in the present study a key cellular pharmacokinetic mechanism of adriamycin resistance was identified in MCF-7/Adr cells: P-gp, expressed in cellular/subcellular membranes, modulates the cellular pharmacokinetic behaviour and pharmacological responses of adriamycin in MCF-7/Adr cells. Meanwhile, 20(S)-Rh2 attenuates adriamycin resistance by inhibiting P-gp. This provides a strategy for exploring the in-depth mechanisms of MDR and effectively evaluating the efficacy of MDR modulators.
Acknowledgments
This work was supported by China National Nature Science Foundation No.30973583 (G.W.) and No.30801411 (F.Z.); China ‘Creation of New Drugs’ Key Technology Projects no. 2009ZX09304-001 (H.H.) and 2009ZX09502-004 (G.W.); Jiangsu Province Nature Science Foundation No. BK2008038 (G.W.) and No.BK2010437 (F.Z.).
The authors wish to sincerely thank Dr Weibin Zha (Key Lab of Drug Metabolism and Pharmacokinetics, China Pharmaceutical University, Nanjing, China) for his kind assistance and hard work in the revision of the paper.
Glossary
Abbreviations
- ESI
electrospray ionization
- LSCM
laser scanning confocal microscopy
- MDR
multi-drug resistance
- MMP
mitochondrial membrane potential
- P-gp
P-glycoprotein
- PS
phosphatidylserine
- TBS/T
Tris-buffered saline/Tween 20
Conflicts of interest
The authors declare no conflicts of interest.
References
- Althuis MD, Dozier JM, Anderson WF, Devesa SS, Brinton LA. Global trends in breast cancer incidence and mortality 1973-1997. Int J Epidemiol. 2005;34:405–412. doi: 10.1093/ije/dyh414. [DOI] [PubMed] [Google Scholar]
- Arcamone F, Animati F, Capranico G, Lombardi P, Pratesi G, Manzini S, et al. New developments in antitumor anthracyclines. Pharmacol Ther. 1997;76:117–124. doi: 10.1016/s0163-7258(97)00096-x. [DOI] [PubMed] [Google Scholar]
- Baldini N, Scotlandi K, Serra M, Shikita T, Zini N, Ognibene A, et al. Nuclear immunolocalization of P-glycoprotein in multidrug-resistant cell lines showing similar mechanisms of doxorubicin distribution. Eur J Cell Biol. 1995;68:226–239. [PubMed] [Google Scholar]
- Barcia-Macay M, Mouaden F, Mingeot-Leclercq MP, Tulkens PM, Van Bambeke F. Cellular pharmacokinetics of telavancin, a novel lipoglycopeptide antibiotic, and analysis of lysosomal changes in cultured eukaryotic cells (J774 mouse macrophages and rat embryonic fibroblasts) J Antimicrob Chemother. 2008;61:1288–1294. doi: 10.1093/jac/dkn120. [DOI] [PMC free article] [PubMed] [Google Scholar]
- Bradford MM. A rapid and sensitive method for the quantitation of microgram quantities of protein utilizing the principle of protein-dye binding. Anal Biochem. 1976;72:248–254. doi: 10.1016/0003-2697(76)90527-3. [DOI] [PubMed] [Google Scholar]
- Chen Y, Cao Y, Zhou J, Liu X. Mechanism-based pharmacokinetic-pharmacodynamic modeling of bidirectional effect of danshensu on plasma homocysteine in rats. Pharm Res. 2009;26:1863–1873. doi: 10.1007/s11095-009-9899-x. [DOI] [PubMed] [Google Scholar]
- Duvvuri M, Krise JP. Intracellular drug sequestration events associated with the emergence of multidrug resistance: a mechanistic review. Front Biosci. 2005;10:1499–1509. doi: 10.2741/1634. [DOI] [PubMed] [Google Scholar]
- Duvvuri M, Feng W, Mathis A, Krise JP. A cell fractionation approach for the quantitative analysis of subcellular drug disposition. Pharm Res. 2004;21:26–32. doi: 10.1023/b:pham.0000012148.12516.3f. [DOI] [PubMed] [Google Scholar]
- Ferrao P, Sincock P, Cole S, Ashman L. Intracellular P-gp contributes to functional drug efflux and resistance in acute myeloid leukaemia. Leuk Res. 2001;25:395–405. doi: 10.1016/s0145-2126(00)00156-9. [DOI] [PubMed] [Google Scholar]
- Gong Y, Duvvuri M, Krise JP. Separate roles for the Golgi apparatus and lysosomes in the sequestration of drugs in the multidrug-resistant human leukemic cell line HL-60. J Biol Chem. 2003;278:50234–50239. doi: 10.1074/jbc.M306606200. [DOI] [PubMed] [Google Scholar]
- Guha P, Dey A, Sen R, Chatterjee M, Chattopadhyay S, Bandyopadhyay SK. Intracellular GSH depletion triggered mitochondrial Bax translocation to accomplish resveratrol-induced apoptosis in the U937 cell line. J Pharmacol Exp Ther. 2011;336:206–214. doi: 10.1124/jpet.110.171983. [DOI] [PubMed] [Google Scholar]
- Halder B, Bhattacharya U, Mukhopadhyay S, Giri AK. Molecular mechanism of black tea polyphenols induced apoptosis in human skin cancer cells: involvement of Bax translocation and mitochondria mediated death cascade. Carcinogenesis. 2008;29:129–138. doi: 10.1093/carcin/bgm233. [DOI] [PubMed] [Google Scholar]
- Hien TT, Kim HG, Han EH, Kang KW, Jeong HG. Molecular mechanism of suppression of MDR1 by puerarin from Pueraria lobata via NF-kappaB pathway and cAMP-responsive element transcriptional activity-dependent up-regulation of AMP-activated protein kinase in breast cancer MCF-7/adr cells. Mol Nutr Food Res. 2010;54:918–928. doi: 10.1002/mnfr.200900146. [DOI] [PubMed] [Google Scholar]
- Hoffmann J, Vitale I, Buchmann B, Galluzzi L, Schwede W, Senovilla L, et al. Improved cellular pharmacokinetics and pharmacodynamics underlie the wide anticancer activity of sagopilone. Cancer Res. 2008;68:5301–5308. doi: 10.1158/0008-5472.CAN-08-0237. [DOI] [PubMed] [Google Scholar]
- Hung DY, Siebert GA, Chang P, Roberts MS. Hepatic pharmacokinetics of taurocholate in the normal and cholestatic rat liver. Br J Pharmacol. 2005;145:57–65. doi: 10.1038/sj.bjp.0706148. [DOI] [PMC free article] [PubMed] [Google Scholar]
- Ivanina AV, Sokolova IM. Effects of cadmium exposure on expression and activity of P-glycoprotein in eastern oysters, Crassostrea virginica Gmelin. Aquat Toxicol. 2008;88:19–28. doi: 10.1016/j.aquatox.2008.02.014. [DOI] [PubMed] [Google Scholar]
- Jia WW, Bu X, Philips D, Yan H, Liu G, Chen X, et al. Rh2, a compound extracted from ginseng, hypersensitizes multidrug-resistant tumor cells to chemotherapy. Can J Physiol Pharmacol. 2004;82:431–437. doi: 10.1139/y04-049. [DOI] [PubMed] [Google Scholar]
- Jiang YS, Jin ZX, Umehara H, Ota T. Cholesterol-dependent induction of dendrite formation by ginsenoside Rh2 in cultured melanoma cells. Int J Mol Med. 2010;26:787–793. doi: 10.3892/ijmm_00000526. [DOI] [PubMed] [Google Scholar]
- Jung LL, Zamboni WC. Cellular, pharmacokinetic, and pharmacodynamic aspects of response to camptothecins: can we improve it? Drug Resist Updat. 2001;4:273–288. doi: 10.1054/drup.2001.0222. [DOI] [PubMed] [Google Scholar]
- Kikuchi Y, Sasa H, Kita T, Hirata J, Tode T, Nagata I. Inhibition of human ovarian cancer cell proliferation in vitro by ginsenoside Rh2 and adjuvant effects to cisplatin in vivo. Anticancer Drugs. 1991;2:63–67. doi: 10.1097/00001813-199102000-00009. [DOI] [PubMed] [Google Scholar]
- Kitagawa I, Yoshikawa M, Yoshihara M, Hayashi T, Taniyama T. [Chemical studies of crude drugs (1). Constituents of Ginseng radix rubra] Yakugaku Zasshi. 1983;103:612–622. [PubMed] [Google Scholar]
- Kitazono M, Sumizawa T, Takebayashi Y, Chen ZS, Furukawa T, Nagayama S, et al. Multidrug resistance and the lung resistance-related protein in human colon carcinoma SW-620 cells. J Natl Cancer Inst. 1999;91:1647–1653. doi: 10.1093/jnci/91.19.1647. [DOI] [PubMed] [Google Scholar]
- Korper S, Nolte F, Rojewski MT, Thiel E, Schrezenmeier H. The K+ channel openers diazoxide and NS1619 induce depolarization of mitochondria and have differential effects on cell Ca2+ in CD34+ cell line KG-1a. Exp Hematol. 2003;31:815–823. doi: 10.1016/s0301-472x(03)00199-1. [DOI] [PubMed] [Google Scholar]
- Kroger N, Achterrath W, Hegewisch-Becker S, Mross K, Zander AR. Current options in treatment of anthracycline-resistant breast cancer. Cancer Treat Rev. 1999;25:279–291. doi: 10.1053/ctrv.1999.0137. [DOI] [PubMed] [Google Scholar]
- Larsen AK, Escargueil AE, Skladanowski A. Resistance mechanisms associated with altered intracellular distribution of anticancer agents. Pharmacol Ther. 2000;85:217–229. doi: 10.1016/s0163-7258(99)00073-x. [DOI] [PubMed] [Google Scholar]
- Meijerman I, Beijnen JH, Schellens JH. Combined action and regulation of phase II enzymes and multidrug resistance proteins in multidrug resistance in cancer. Cancer Treat Rev. 2008;34:505–520. doi: 10.1016/j.ctrv.2008.03.002. [DOI] [PubMed] [Google Scholar]
- Meschini S, Calcabrini A, Monti E, Del Bufalo D, Stringaro A, Dolfini E, et al. Intracellular P-glycoprotein expression is associated with the intrinsic multidrug resistance phenotype in human colon adenocarcinoma cells. Int J Cancer. 2000;87:615–628. [PubMed] [Google Scholar]
- Munteanu E, Verdier M, Grandjean-Forestier F, Stenger C, Jayat-Vignoles C, Huet S, et al. Mitochondrial localization and activity of P-glycoprotein in doxorubicin-resistant K562 cells. Biochem Pharmacol. 2006;71:1162–1174. doi: 10.1016/j.bcp.2006.01.006. [DOI] [PubMed] [Google Scholar]
- Ota K, Ito K, Akahira J, Sato N, Onogawa T, Moriya T, et al. Expression of organic cation transporter SLC22A16 in human epithelial ovarian cancer: a possible role of the adriamycin importer. Int J Gynecol Pathol. 2007;26:334–340. doi: 10.1097/01.pgp.0000236951.33914.1b. [DOI] [PubMed] [Google Scholar]
- Peleg M. Modeling microbial populations with the original and modified versions of the continuous and discrete logistic equations. Crit Rev Food Sci Nutr. 1997;37:471–490. doi: 10.1080/10408399709527785. [DOI] [PubMed] [Google Scholar]
- Rivera E. Management of metastatic breast cancer: monotherapy options for patients resistant to anthracyclines and taxanes. Am J Clin Oncol. 2010;33:176–185. doi: 10.1097/COC.0b013e3181931049. [DOI] [PubMed] [Google Scholar]
- Sato N, Ito K, Onogawa T, Akahira J, Unno M, Abe T, et al. Expression of organic cation transporter SLC22A16 in human endometria. Int J Gynecol Pathol. 2007;26:53–60. doi: 10.1097/01.pgp.0000225845.67245.b3. [DOI] [PubMed] [Google Scholar]
- Serrone L, Hersey P. The chemoresistance of human malignant melanoma: an update. Melanoma Res. 1999;9:51–58. doi: 10.1097/00008390-199902000-00007. [DOI] [PubMed] [Google Scholar]
- Shen F, Chu S, Bence AK, Bailey B, Xue X, Erickson PA, et al. Quantitation of doxorubicin uptake, efflux, and modulation of multidrug resistance (MDR) in MDR human cancer cells. J Pharmacol Exp Ther. 2008;324:95–102. doi: 10.1124/jpet.107.127704. [DOI] [PubMed] [Google Scholar]
- Shen F, Bailey BJ, Chu S, Bence AK, Xue X, Erickson P, et al. Dynamic assessment of mitoxantrone resistance and modulation of multidrug resistance by valspodar (PSC833) in multidrug resistance human cancer cells. J Pharmacol Exp Ther. 2009;330:423–429. doi: 10.1124/jpet.109.153551. [DOI] [PMC free article] [PubMed] [Google Scholar]
- Siebert GA, Hung DY, Chang P, Roberts MS. Ion-trapping, microsomal binding, and unbound drug distribution in the hepatic retention of basic drugs. J Pharmacol Exp Ther. 2004;308:228–235. doi: 10.1124/jpet.103.056770. [DOI] [PubMed] [Google Scholar]
- Smith PK, Krohn RI, Hermanson GT, Mallia AK, Gartner FH, Provenzano MD, et al. Measurement of protein using bicinchoninic acid. Anal Biochem. 1985;150:76–85. doi: 10.1016/0003-2697(85)90442-7. [DOI] [PubMed] [Google Scholar]
- Solazzo M, Fantappie O, Lasagna N, Sassoli C, Nosi D, Mazzanti R. P-gp localization in mitochondria and its functional characterization in multiple drug-resistant cell lines. Exp Cell Res. 2006;312:4070–4078. doi: 10.1016/j.yexcr.2006.09.005. [DOI] [PubMed] [Google Scholar]
- Stavrovskaya AA. Cellular mechanisms of multidrug resistance of tumor cells. Biochem (Mosc) 2000;65:95–106. [PubMed] [Google Scholar]
- Tao LY, Liang YJ, Wang F, Chen LM, Yan YY, Dai CL, et al. Cediranib (recentin, AZD2171) reverses ABCB1- and ABCC1-mediated multidrug resistance by inhibition of their transport function. Cancer Chemother Pharmacol. 2009;64:961–969. doi: 10.1007/s00280-009-0949-1. [DOI] [PubMed] [Google Scholar]
- Xie X, Eberding A, Madera C, Fazli L, Jia W, Goldenberg L, et al. Rh2 synergistically enhances paclitaxel or mitoxantrone in prostate cancer models. J Urol. 2006;175:1926–1931. doi: 10.1016/S0022-5347(05)00891-8. [DOI] [PubMed] [Google Scholar]
- Yi JS, Choo HJ, Cho BR, Kim HM, Kim YN, Ham YM, et al. Ginsenoside Rh2 induces ligand-independent Fas activation via lipid raft disruption. Biochem Biophys Res Commun. 2009;385:154–159. doi: 10.1016/j.bbrc.2009.05.028. [DOI] [PubMed] [Google Scholar]
- Yu ST, Chen TM, Tseng SY, Chen YH. Tryptanthrin inhibits MDR1 and reverses doxorubicin resistance in breast cancer cells. Biochem Biophys Res Commun. 2007;358:79–84. doi: 10.1016/j.bbrc.2007.04.107. [DOI] [PubMed] [Google Scholar]
- Zhang X, Shedden K, Rosania GR. A cell-based molecular transport simulator for pharmacokinetic prediction and cheminformatic exploration. Mol Pharm. 2006;3:704–716. doi: 10.1021/mp060046k. [DOI] [PMC free article] [PubMed] [Google Scholar]
- Zhang J, Zhou F, Wu X, Gu Y, Ai H, Zheng Y, et al. 20(S)-ginsenoside rh2 noncompetitively inhibits p-glycoprotein in vitro and in vivo: a case for herb-drug interactions. Drug Metab Dispos. 2010;38:2179–2187. doi: 10.1124/dmd.110.034793. [DOI] [PubMed] [Google Scholar]
- Zhou F, Zhang J, Li P, Niu F, Wu X, Wang G, et al. Toward a new age of cellular pharmacokinetics in drug discovery. Drug Metab Rev. 2011;43:335–345. doi: 10.3109/03602532.2011.560607. [DOI] [PubMed] [Google Scholar]