

Abstract
Hydrogen exchange mass spectrometry (HX-MS) is an experimental technique that can be used to examine solvent accessibility and conformational mobility in biological macromolecules. This chapter summarizes studies using HX-MS to examine the regulation of conformation, protein mobility, and ligand binding to MAP kinases. We describe how HX-MS experiments are planned and designed, strategies for data analysis and interpretation, and available software.
Keywords: Extracellular signal-regulated kinase, hydrogen-deuterium exchange, mass spectrometry, conformational mobility
1. INTRODUCTION
Hydrogen-deuterium exchange methods have provided useful approaches for exploring conformational and dynamic properties of biomolecules. Although often performed by nuclear magnetic resonance (NMR), hydrogen-deuterium exchange coupled with mass spectrometry has increased in popularity over the last fifteen years (1,2). Advances in the resolution and speed of mass spectrometry instrumentation allow experiments to be performed readily on macromolecules. Early publications provided the basic strategy for HX-MS of proteins, which are still prevalent among current studies of protein folding, macromolecular interactions, ligand binding, enzyme activation, and conformational mobility (3,4).
A sizeable body of work has used HX-MS to examine properties of enzyme activation, regulated conformational mobility, and substrate binding in MAP kinases, including ERK2, p38 MAPK, and MKK1 (5-11). Studies of ERK2 showed distinct differences in regional hydrogen exchange rates between inactive (unphosphorylated) and active (diphosphorylated) states of the enzyme (5). For example, altered HX was observed in the activation lip, as expected from the dramatic conformational reorganization which follows lip phosphorylation. Also observed were increased HX within the glycine-rich ATP binding loop, and within the hinge between N- and C-terminal domains. These could not readily be accounted for by differences in X-ray structure between active and inactive ERK2, suggesting that phosphorylation and activation of this enzyme regulates backbone conformational mobility in key regions of this enzyme. For example, increased conformational mobility at the hinge might enable domain closure needed for catalysis.
Follow up experiments were conducted to test this hypothesis. First, site-directed spin label electron paramagnetic resonance spectroscopy (SDSL-EPR) was carried out on ERK2, in which cysteine residues were individually engineered at different regions of the hinge onto which nitroxide spin label groups were added (12). Residues at the hinge showed significant changes in correlation rate without evidence for conformational perturbations, consistent with altered side chain dynamics at the hinge upon ERK2 activation. Second, HX-MS was used to monitor binding of a nonhydrolyzable nucleotide analog between active and inactive ERK2 (8). In inactive ERK2, Mg2+-AMP-PNP binding caused steric protection from deuteration in regions within the N-terminal domain that were known to interact with nucleotide, including the glycine-rich loop, sheet β3/helix αC, and the hinge region, but little protection within the C-terminal domain. In contrast, nucleotide binding to active ERK2 led to comparable protection in N-terminal regions and the hinge, but increased protection around the DFG motif in the C-terminal domain. Both forms of ERK2 bound Mg2+-AMP-PNP with similar affinity as measured by isothermal titration calorimetry. The findings led to novel insight into the solution conformation of ERK2, by demonstrating that the inactive enzyme is constrained from forming a closed domain solution conformation needed for catalysis, which the active state is able to adopt (Figure 1). This result implies that closure of domains in order to form a competent catalytic site represents a barrier to enzyme activation, which may be overcome by regulating conformational mobility at the hinge.
Figure 1.

(A) A proposed model for domain closure as revealed by differential binding of Mg2+-AMP-PNP to inactive unphosphorylated (0P) ERK2 and active phosphorylated (2P) ERK2. Both forms bind Mg2+-AMP-PNP comparably within the N-terminal domain and the hinge, but 2P-ERK2 shows increased protection of the C-terminal domain, suggesting a closed domain solution conformation. (B) HX-MS time courses for the C-terminal domain peptide, KICDFGL, used in this interpretation. The lower deuterium incorporation in 2P-ERK2 upon Mg2+-AMP-PNP binding reveals greater protection from solvent in the C-terminal domain compared to 0P-ERK2. (Reproduced with permission from ref. 8)
HX-MS has also been used to understand binding interactions between ERK2 and substrate as well as with MAP kinase phosphatases (MKP) (11, 13, 14). One study used HX-MS to identify binding sites for docking motifs, sequences within substrates and scaffolds, phosphatases and MAP kinase kinases, which confer high affinity binding to MAP kinases (11). Binding of a DEJL docking motif (consensus sequence Arg/Lys-X2-4-Φ-X-Φ interacted with a hydrophobic groove previously identified in X-ray co-crystal structures, while a DEF docking motif (consensus Phe-X-Phe) interacted with a novel binding pocket formed upon rearrangement of the activation lip following phosphorylation. In studies of the binding interface between ERK2 and MKP3 (13, 14), HX-MS was used to map regions within kinase and phosphatase that were protected from exchange in the heterodimeric complex. Site-directed mutagenesis confirmed that binding of MKP3 involved the DEJL and DEF docking motif binding sites and the activation lip of ERK2, while binding of ERK2 involved corresponding docking motif sequences in MKP3, revealing that two distinct domains in the MKP3 interact with distally spaced regions in ERK2. These studies highlighted the importance of structural changes in ERK2 following activation and how they direct the binding of substrates and phosphatase regulators.
These studies illustrate how HX-MS can be effective for understanding the regulation of protein mobility and its importance for MAP kinase activation, as well as protein interactions involved in MAP kinase enzymatic function and regulation. Additional studies showed that activation of p38 MAPK and MKK1 also caused changes in HX that were consistent with regulated conformational mobility (7, 9). Such changes occur within distinctive regions of each enzyme, suggesting that regulated motions vary significantly across related MAP kinases. Further investigations are needed to understand how changes in protein motions control kinase activation and how backbone flexibility is controlled by phosphorylation. Undoubtedly HX-MS will play a valuable role in future experiments which address these questions.
2. MATERIALS
Studies of MAP kinases (5-9) provide useful examples describing the design of HX-MS experiments for kinases and other proteins. A basic strategy compares proteins in two or more states (e.g., active vs inactive kinase, kinase bound vs unbound to nucleotide or substrate). In order to obtain information about localized changes in hydrogen exchange rate, proteins are incubated in D2O for varying times, then proteolyzed, and the resulting deuterated peptides are analyzed by mass spectrometry (Figure 2). In this way, the degree of regional hydrogen-deuterium exchange is reported by the increased mass of peptides following deuteration of the intact protein. An effort is made to achieve maximal sequence coverage, in order to monitor HX behavior over the entire protein (see Notes 1, 2 and 3). Different mass spectrometry strategies have been used successfully, including electrospray ionization mass spectrometry coupled to liquid chromatography (LC-ESI-MS) and matrix-assisted laser desorption ionization mass spectrometry (MALDI-MS) (15, 16). We favor LC-ESI-MS, due to its advantages in separating highly complex peptide mixtures by liquid chromatography which yields greater sequence coverage, and its reduced back-exchange of deuterated residues in water. Here we discuss steps useful for the design and implementation of a successful HX-MS experiment by LC-ESI-MS.
Figure 2.

Schematic of the HX-MS experiment. Proteins are incubated in D2O for varying times, in-exchange is quenched by lowering temperature and pH, and proteins are rapidly proteolyzed by pepsin addition. Peptides are then resolved and masses measured by LC-MS.
2.1. Equipment and Instrumentation
Materials listed are those used in our lab, but can vary according to instrument availability, sample type, and experimental design.
Ice-water bath able to fit a reverse-phase HPLC column, a six-port injector valve, polyether ether ketone (PEEK) solvent cooling lines and sample loop. Constant column temperature at 0°C is needed to maintain low back-exchange during chromatography.
Water bath for deuteration reactions. We generally set the incubation temperature to 10°C, in order to measure increases in hydrogen exchange over the timescale of minutes to hours.
A ethanol/water bath (1:2 v/v) is maintained at −10°C by adding dry ice.
Blunt end HPLC injection syringes (50 μL, 250 μL, 1 mL, from Hamilton or Scientific Glass Engineering). The syringes are wrapped with Parafilm to 5 mm thickness, in order to minimize heat transfer to the solution when handling the syringe.
PEEK HPLC injector six-port valve (Rheodyne), outfitted with a PEEK sample loop (1 mL) for loading sample and forming the acetonitrile gradient in the loop.
PEEK tubing (we use a 3 mL sample loading loop) for precooling the solvent from the pump entering the six-port valve.
Agilent 1100 capillary HPLC pump. Any HPLC capable of delivering solvent at 20-40 μL/min will suffice.
HPLC columns (~150 mm length, 0.5 mm i.d.). We pack these manually with POROS 20 R1 resin (Applied Biosystems). The columns are made from fused silica tubing (Polymicro Technologies), with zero or low dead volume fittings (Upchurch Scientific), Teflon or PEEK sleeves, and PEEK or stainless steel frits (e.g. Upchurch Scientific). This allows for smooth control of flow and pressure at the column outlet.
A quadrupole time-of-flight mass spectrometer. Any instrument with a capillary electrospray source will work, but TOF instruments provide high mass resolution which facilitates data analysis. We currently use a QSTAR Pulsar QqTOF (Applied Biosystems) with standard electrospray source.
2.2. Reagents
Deuterium oxide (D2O)
Nucleotide analogue, AMP-PNP (Roche)
Acid quench buffer containing 25 mM citric acid, 25 mM succinic acid, titrated to pH 2.40, passed through a 0.22 μm syringe filter, and stored in 5 mL aliquots at −20°C. All experiments are carried out using the same solution of quench buffer.
Pepsin (0.4 mg/mL) dissolved in water, passed through a 0.22 μm syringe filter, and stored in 50 μL aliquots at −80°C. Each day, a new aliquot is thawed and clarified by microcentrifugation at 10,000 × g for 10 min at 4°C.
- HPLC buffers:
- Buffer A: 0.05% v/v trifluoroacetic acid (TFA) in HPLC grade water
- Buffer B: 0.05% TFA v/v in HPLC grade acetonitrile
- Step gradient buffers: 5, 7.5, 10, 12.5, 15, 17.5, 20, 22.5, 25, 30, 35, 40, and 50% Buffer B in Buffer A. Buffers are stored at −20°C in 1-2 mL tubes outfitted with O-ring caps.
Protein sample: The purity of the protein should be ≥ 95%. Studies with the ABI QSTAR require protein concentrations that yield 1-5 μM in a 100 μL deuteration reaction mixture. The protein should be stored frozen in aliquots. Buffers which catalyze hydrogen exchange (e.g. amines, Lewis bases) should be avoided, because these enhance back exchange.
3. METHODS
3.1. ERK2 Identification
Here we illustrate an experiment designed to identify regions of ERK2 which form interfaces for binding nucleotides or other ligands (8, 11). The experiment involves pre-incubation of kinase with ligand to achieve equilibrium binding, prior to addition of D2O. The protocol can be adapted to compare the behavior of active vs inactive MAP kinases by HX-MS, with minor changes in reaction solution (5, 7, 9).
Set up the HPLC to pass a steady flow of 3:97 acetonitrile:water in 0.05% v/v TFA at 40 μL/min. This can be done using isocratic flow through a single pump, or by mixing 97% Buffer A and 3% Buffer B using a dual pump. Solvent is precooled to 0°C by inserting a 3 mL sample loading loop between the mixer and injector valve, which is buried in the ice-water mixture. The injector valve is outfitted with a 1 mL sample loading loop and reverse-phase column, the latter of which is initially uncoupled from the mass spectrometer. All components (3 mL precooling loop, 1 mL sample loading loop, reverse-phase column, injector valve) are immersed in the ice-water mixture, leaving only the needle injection port above the ice.
Prepare the ethanol/water/dry ice bath to achieve constant temperature at −10°C. Prepare a separate ice bucket containing stock solutions (protein, ligand, D2O, pepsin, acid quench buffer, step gradient solvents) and syringes, We also find it useful to chill the necessary P200 and P20 pipettors outfitted with tips by inserting them into 15 mL conical tubes on ice. It is important to pre-chill the solutions, syringes, and pipettors in order to minimize back-exchange.
Place 8 μL (~100 pmol, ~4 μg) of ERK2 in a low protein binding tube (e.g. 1 mL titer tubes) in a water bath at 10°C. Incubate for 30 s.
Add 7 μL of ligand solution or control solution to the protein sample (e.g. to achieve final concentrations of 1 mM AMP-PNP, 10 mM Mg2+ in the pre-incubation, and 10 mM MgCl2 in the control). Incubate at 10°C for 10 min to achieve equilibrium binding.
Initiate the deuteration reaction by adding to the binding reaction 85 μL D2O ligand (containing 1 mM AMP-PNP, 10 mM MgCl2) or control solution (containing 10 mM MgCl2) which has been preincubated at 10 °C. The final volume is 100 μL.
Incubate at 10°C for varying times (see Notes 4 and 5).
Transfer the tube to the ethanol/water/dry ice bath for 5 s. The timing should allow rapid cooling of the sample to 0°C, while avoiding freezing.
Add 90 μL of 25 mM citrate/25 mM succinate pH 2.40 to the mixture.
Incubate in ethanol/water/dry ice for an additional 15 s.
Add 10 μL of pepsin (~4 μg, approximately 1:1 w/w). The amount of pepsin needed for optimal proteolysis may vary, and should be determined for each protein in preliminary trials (see Note 2).
Immediately load the sample (200 μL) into the PEEK injector loop using a pre-chilled 250 μL syringe, wrapped with Parafilm to minimize heat transfer from fingers. Allow the sample to digest in the sample loading loop for 1 min following pepsin addition.
Switch the valve from Load to Inject, in order to inject the sample onto the column at 40 μL/min. A 200 μL sample requires 5 min for complete injection. After 5 min, switch the injector back to the Load position.
Wash the sample on the column for 6 min after returning the valve to the Load position.
While the column is washing, rinse the injector loop with Buffer A using the 1 mL HPLC syringe (2 mL is needed to wash the 1 mL loop) in order to remove air bubbles or D2O crystals that may remain in the loop.
Load the step gradient buffers (stored on ice) into the injector loop using the 50 μL HPLC syringe. Begin by adding 40 μL of 100% Buffer B, and then load 17.5 μL of each step gradient buffer in descending order of concentration. Because the loop is last-on-first-off, the last solution injected (5% Buffer B) is the first to be added onto the column. The gradient is formed in the injector loop rather than the mixer, in order to minimize the dead time for peptide elution and reduce back-exchange.
After washing, connect the column outlet to the electrospray source on the mass spectrometer. Immediately reduce the flow rate to 20 μL/min and begin data acquisition on the mass spectrometer.
After 1 min, switch the valve position from Load to Inject. The gradient flows rapidly onto the column and peptides are eluted to the mass spectrometer over 15 min.
At the end of the gradient, switch the injector to Load, and apply 200 μL of 100% Buffer B, in order to further wash the column. Allow the column to re-equilibrate with 3% Buffer B for the next run.
3.2. DATA ANALYSIS
Instrument-specific software is used for data collection and analysis. For each ion, intensities are measured for each isotope peak, and used to calculate weighted average mass. After correcting for back-exchange, the level of deuteration can be plotted as a function of incubation time. Observed exchange rate constants are obtained by nonlinear least squares fitting of time courses to a sum of exponentials. Our studies use Analyst QS (version 1.1) for analysis of .wiff data files collected on the ABI QSTAR instrument.
3.2.1. Calculation of weighted average mass
Open a data files collected at each time point and condition.
Display the total ion chromatogram (TIC) and enter the mass range of each ion of interest to display its extract ion chromatogram (XIC). Highlight the extract ion peak and show its corresponding mass spectrum, summed over all scans within the highlighted time window.
Zoom in on the desired ion and measure m/z and intensities for each of the isotopic peaks. In some software, these measurements can be automatically determined and saved to a separate text file or spreadsheet, generating lists of all isotope peaks and their corresponding intensities for each. Separately calculate m/z values for each isotope peak, based on the peptide sequence and charge, and match the calculated m/z values to their corresponding intensities.
- In a spreadsheet calculate the weighted average mass (WAM) for each ion at each time point, using the measured intensities and calculated m/z values for each isotope peak in the following equation:
Note that calculated m/z values are used instead of the observed m/z, in order to avoid variance due to calibration error.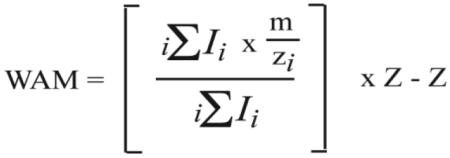
Repeat steps 1-4, calculating WAM for each peptide ion at each HX time point, under each experimental condition.
3.2.2. Correction for Artifactual In-Exchange
Artifactual in-exchange occurs at the t=0 time point, due to deuterium incorporation during proteolysis. The degree of artifactual in-exchange varies with time as the peptide deuteration increases, and can be calculated as follows:
| (1) |
| (2) |
where Mt,corr (IE) is the peptide mass corrected for artifactual in-exchange, Mt,wa is the weighted average mass at time t, and M∞,85 is the peptide mass at infinite time in 85% D2O. L is a correction factor normalizing the fractional of artifactual in-exchange under the deuteration conditions in the experiment. M0,wa is the weighted average mass at time zero while Mcalc is the calculated average mass of the peptide.
3.2.3. Correction for Back-Exchange
During proteolysis and LC separation, deuterons will back-exchange with protons in aqueous solution, leading to underestimates of the extent of deuteration. Back-exchange is rapid with deuterated side chains, but slower with deuterated amides, thus HX-MS measurements mainly report deuteration at backbone amide groups. We measure the back-exchange of peptides using three approaches.
In a first approach experimental measurement of back-exchange is carried out by fully deuterating peptides and then measuring their decrease in mass with exchange back to hydrogen. This is accomplished by modifying the HX protocol outlined earlier. Perform steps 1-18 from the Methods section, substituting 50 μL of protein and 50 μL of H2O in the reaction mixture, generating peptides which are loaded onto the reverse-phase column. Instead of eluting peptides with a step gradient, elute with 30 μL 40% Buffer B and collect the eluate off-line. Lyophilize and re-dissolve the sample in 15 μL of the buffer used in the exchange experiment, add 85 μL D2O and heat at 90°C for 90 min. This leads to complete deuteration of all peptides, which are then cooled on ice and injected onto the sample loading loop. After 1 min, proceed with Step 11 in the Methods section and analyze the sample by LC-MS. The back-exchange for each peptide is calculated as follows:
| (3) |
where M∞,85 is the calculated peptide mass after deuteration in 85% D2O, MBE is the observed peptide mass following back-exchange during LC-MS, and Mcalc is the calculated average mass of the peptide in water.
In a second approach estimated back-exchange for different peptides can be calculated using an empirical equation previously determined by our laboratory, based on back-exchange vs elution time.
| (4) |
L is the same fraction of artifactual in-exchange from Eq. 2, and the equation assumes 1% back-exchange for the peptide per minute of elution.
A third approach estimates back exchange based on the HX rates of model peptides. Amide backbone hydrogen-deuterium exchange rate constants for tri-amino acid peptides in solution were previously determined by NMR (17). The program HXPep (created by Dr. Zhongqi Zhang, Amgen, Thousand Oaks, CA) uses these experimentally measured rate constants to estimate HX rates for amides located between different flanking amino acids. Rates are determined from the peptide sequence, temperature (0°C), and pH/pD (2.4). For an individual backbone amide hydrogen:
| (5) |
where BEamide is the estimated back-exchange for a given backbone amide, and kHXPep is the exchange rate estimated by HXPep for a particular backbone amide. The fractional back exchange for the entire peptide can be calculated by:
| (6) |
where Σ(BEamide) sums all amide hydrogens in the peptide from Equation 5, M∞ is the calculated peptide mass if every amide hydrogen were exchanged to deuterium in 100% D2O, and Mcalc is the calculated average mass of the peptide.
3.2.4. Deuteration Corrected for Back-Exchange and Artifactual In-Exchange
Following estimation of the back-exchange, the data are corrected by the following equation:
| (7) |
in which Mt,corr(BE) is the corrected mass of the peptide at time t, BE is the fractional back-exchange, Mt,corr(IE) is the mass at time t, corrected for artifactual in-exchange as in Equation (1), and Mcalc is the calculated average mass of the peptide. The number of deuterons incorporated (Ndeuterons) is then calculated as Mt,corr(BE) - Mcalc.
3.2.5. Data Fitting
Once the data are collected and corrected, they are fit to a multiple exponential rate curve in order to estimate apparent rate constants. Typically, time courses can be fit to sums of three exponential terms, which allows the number and rates of fast, intermediate, and slow exchanging amides to be estimated. We use SigmaPlot (Systat Software, v. 9, www.sigmaplot.com) for this purpose, but any nonlinear least squares program can be used (Figure 3).
Figure 3.

Time courses comparing HX of a peptide from 0P-p38 and 2P-p38, fit by nonlinear least squares to a sum of exponentials as in Equation 8. Best fits to parameters Nmax, A, B, C, k1, k2 and k3 with standard deviations (parentheses), and residual sum of squares are indicated. NE indicates the number of amides that are non-exchanging over the time window of the experiment Significant changes in parameters are indicated in bold. The decreased HX in 2P-p38 relative to 0P-p38 can be explained by conversion of one amide from an intermediate (0.14 min−1) to slow (0.01 min−1) rate constant, and a second amide from intermediate to non-exchanging (NE) on the experimental time scale. (Reproduced with permission from ref. 9.)
- Enter the time vs number of deuterons (Ndeuterons) into the NLSQ spreadsheet. For the example of nucleotide binding, four columns are used, which report time vs Ndeuterons for control and nucleotide-bound samples of 0P-ERK2 and 2P-ERK2. Fit the curve to one, two, or three exponentials, using the general equation:
Where Ndeuterons is the extent of deuteration at time t, Nmax is the number of deuterons after maximal in-exchange, and A, B, and C are the number of amides which exchange with rate constants k1, k2 and k3, respectively. Input parameters are used to provide starting estimates of numbers of amides and rate constants. Nmax is estimated as the asymptote of the time course, and constrained by Nmax = A + B + C. For time courses ranging from 0 – 240 min, reasonable initial estimates for k1, k2 and k3 range from 0.1 min−1 to 10 min−1.(8)
3.2.6. Software for Semi-Automated Data Analysis
Manual HX-MS data analysis can be tedious, therefore several computer programs have been developed to automate this process. Errors arise when isotopic peaks are improperly chosen, therefore most programs display raw data in order to allow manual inspection and selection of isotope peaks that are then used for the weighted average mass calculations.
HXExpress (http://www.hxms.com/HXExpress/) is built on a Microsoft Excel file, using macros to enable semi-automated analysis of datasets (18). Users import peptide isotope m/z for each time point from any MS output, and the software calculates weighted average mass. Additional masses measured under conditions of no deuteration or complete deuteration enable calculation of percent deuteration at each time point. The software operates with MS Excel ’97 and higher, using Windows 2000 and XP.
HX-Analyzer is an interactive tool for identifying isotope peaks and calculating weighted average mass from HX-MS datasets, developed in-house and implemented in Visual Basic. The program requires local installation of Analyzer QS 1.1, Microsoft Office 2003, and Microsoft Windows XP software library modules (9; request free software from authors). The software inputs a list of LC-MS/MS files (.wiff format) and a user-generated Excel spreadsheet with information about peptide ion mass and approximate elution times. It then links to Analyzer QS modules which display isotopic peaks for each ion for manual inspection to detect anomalous peaks, and compares ions across multiple datasets. Isotopic masses for each peptide ion are captured and weighted average masses calculated and output in an Excel file.
Hydra (http://www.ucalgary.ca/~dschriem) allows automated data capture and analysis for HX-MS. Different versions are built for .wiff files, requiring local installation of Analyst QS v.1.1, or for mzXML files (19). The software requires an input Excel file summarizing sequence, m/z, charge state, and retention time for each peptide, a project tree which associates raw data files with experiments, and a file specifying the data analysis workflow. The software can analyze MS or MS/MS data, enables manual inspection of isotope peaks, outputs calculated weighted average masses and deuterium incorporation, and displays time courses.
HD Desktop (http://deuterator.florida.scripps.edu/) is a web-based platform built on previously described Deuterator software (20), with calculations performed on the HD Desktop server at Scripps. The software inputs mzXML data files and files containing protein sequence and peptide ion information (e.g., sequence, mass, retention time, charge state). The software estimates weighted average mass and calculates deuterium incorporation. The program also consolidates results from peptides with overlapping sequences, for displaying localized HX information onto secondary and tertiary structures.
4. NOTES
The first step involves proteolyzing undeuterated proteins followed by peptide identification by LC-MS/MS, in order to determine the cleavage sites of peptides produced by proteolysis. The goal is to maximize sequence coverage, measured by the number of amides contained within the observed peptides (Figure 4). Thus, sequence coverage is optimized with respect to peptide size and recovery, by adjusting proteolysis and LC gradient conditions. We recommend performing six or more replicate LC-MS/MS runs in order to sample high numbers of identified peptides (9). Not every identified peptide can be analyzed for deuteration in the HX datasets, therefore, the number of analyzable peptides is enhanced by increasing the number of identified peptides.
Pepsin is usually preferred for proteolysis because it is active at pH and temperatures which minimize back-exchange (0°C, pH 2.4). Other proteases can be used in parallel with or in place of pepsin, and have been shown to enhance peptide recovery and improve sequence coverage (21). Pepsin catalyzes nonspecific and incomplete cleavages, which requires high confidence peptide identifications. It also generates overlapping peptides, which can often be compared in order to localize deuteration events within narrower areas of sequence.
Accurate peptide identification is very important for data analysis and interpretation. We initially match MS/MS spectra to peptide sequences using automated search programs (e.g. Mascot), and applying score thresholds corresponding to low false discovery rates (FDR ≤ 0.01%) (22, 23). Later, every peptide assignment is confirmed by manual analysis, using well established rules for chemical plausibility. Manual validation is possible for HX datasets which typically include 100-200 peptides. Together, these steps ensure high confidence peptide assignments.
Our HX-MS experiments on MAP kinases typically involve 10-20 time points collected between 5 s and 4 h. Incubation of enzymes in D2O for long times can sometimes lead to partial unfolding, and should be monitored for the appearance of bimodal deuteration patterns in certain regions, where unfolded proteins undergo faster HX, yielding higher deuteration and mass. Each day, t=0 measurements should be made by adding acid quench buffer to the reaction prior to addition of D2O and pepsin in order to correct for artifactual in-exchange of deuterium during proteolysis (see below). Errors in deuterium incorporation largely result from variations in sample handling, back-exchange, and temperature control. We find it useful to quantify errors and assess reproducibility by measuring mass after deuteration for 1 min and 10 min, with each time point measured in triplicate or more over the course of several days. This allows standard deviations in mass to be calculated for different peptides at times when deuteration changes rapidly. Typically, we observe standard deviations in peptide mass of 0.1 Da or lower. Changes in mass of 0.5 Da or higher are accepted as true differences if they occur systematically over consecutive time points.
Data collection over an HX time course is carried out by randomizing deuteration time points and experimental conditions. Data quality should be monitored by examining two or three ions in each dataset over the days required for data collection. We often choose ions corresponding to peptides where the exchange behavior can be predicted, for example, peptides from the protein surface might exchange rapidly and completely, and peptides from the protein interior might exchange slowly or not at all. By plotting the weighted average mass (WAM) vs time for each ion, outliers can be detected which reflect non-uniform back-exchange or protein denaturation, and often systematically affect all peptides within the same dataset. Such time points can then be repeated, if necessary.
Figure 4.

Sequence coverage map of p38 MAP kinase, indicating peptides that were identified by sequencing and analyzed by HX-MS. Peptide identification and determination of cleavage sites is the first step in a HX-MS experiment to evaluate sequence coverage and experiment feasibility. (Reproduced with permission from ref. 9.)
REFERENCES
- 1.Hoofnagle AN, Resing KA, Ahn NG. Protein analysis by hydrogen exchange mass spectrometry. Annu. Rev. Biophys. Biomol. Struct. 2003;32:1–25. doi: 10.1146/annurev.biophys.32.110601.142417. [DOI] [PubMed] [Google Scholar]
- 2.Englander SW. Hydrogen exchange and mass spectrometry: A historical perspective. J Am. Soc. Mass Spectrom. 2006;17:1481–1489. doi: 10.1016/j.jasms.2006.06.006. [DOI] [PMC free article] [PubMed] [Google Scholar]
- 3.Zhang Z, Smith DL. Determination of amide hydrogen exchange by mass spectrometry: a new tool for protein structure elucidation. Protein Sci. 1993;2:522–531. doi: 10.1002/pro.5560020404. [DOI] [PMC free article] [PubMed] [Google Scholar]
- 4.Johnson RS, Walsh KA. Mass-spectrometric measurement of protein amide hydrogen-exchange rates of apo-myoglobin and holo-myoglobin. Protein Sci. 1994;3:2411–2418. doi: 10.1002/pro.5560031224. [DOI] [PMC free article] [PubMed] [Google Scholar]
- 5.Hoofnagle AN, Resing KA, Goldsmith EJ, Ahn NG. Changes in protein conformational mobility upon activation of extracellular regulated protein kinase-2 as detected by hydrogen exchange. Proc. Natl. Acad. Sci. USA. 2001;98:956–961. doi: 10.1073/pnas.98.3.956. [DOI] [PMC free article] [PubMed] [Google Scholar]
- 6.Resing KA, Hoofnagle AN, Ahn NG. Modeling deuterium exchange behavior of ERK2 using pepsin mapping to probe secondary structure. J. Am. Soc. Mass Spectrom. 1999;10:685–702. doi: 10.1016/S1044-0305(99)00037-9. [DOI] [PubMed] [Google Scholar]
- 7.Resing KA, Ahn NG. Deuterium exchange mass spectrometry as a probe of protein kinase activation: analysis of wild-type and constitutively activate mutants of MAP kinase kinase-1. Biochemistry. 1998;37:463–475. doi: 10.1021/bi971750x. [DOI] [PubMed] [Google Scholar]
- 8.Lee T, Hoofnagle AN, Resing KA, Ahn NG. Hydrogen exchange solvent protection by an ATP analogue reveals conformational changes in ERK2 upon activation. J Mol Biol. 2005;353:600–612. doi: 10.1016/j.jmb.2005.08.029. [DOI] [PubMed] [Google Scholar]
- 9.Sours KM, Kwok SC, Rachidi T, Lee T, Ring A, Hoofnagle AN, Resing KA, Ahn NG. Hydrogen-exchange mass spectrometry reveals activation-induced changes in the conformational mobility of p38alpha MAP kinase. J Mol Biol. 2008;379:1075–1093. doi: 10.1016/j.jmb.2008.04.044. [DOI] [PMC free article] [PubMed] [Google Scholar]
- 10.Hamuro Y, Coales SJ, Morrow J, Griffin PR, Southern MR, Weber PC. Application of hydrogen/deuterium-exchange to p38 mitogen-activated protein kinase. Am. Biotech. Lab. 2007 Feb;:28–30. [Google Scholar]
- 11.Lee T, Hoofnagle AN, Kubuyama Y, Stroud J, Min X, Goldsmith EJ, Chen L, Resing KA, Ahn NG. Docking motif interactions in MAP kinases revealed by hydrogen exchange mass spectrometry. Mol Cell. 2004;14:43–55. doi: 10.1016/s1097-2765(04)00161-3. [DOI] [PubMed] [Google Scholar]
- 12.Hoofnagle AN, Stoner JW, Lee T, Eaton SS, Ahn NG. Phosphorylation-dependent changes in structure and dynamics in ERK2 detected by SDSL and EPR. Biophys. J. 2004;86:395–403. doi: 10.1016/S0006-3495(04)74115-6. [DOI] [PMC free article] [PubMed] [Google Scholar]
- 13.Zhou B, Zhang J, Liu S, Reddy S, Wang F, Zhang Z. Mapping ERK2-MKP3 binding interfaces by hydrogen/deuterium exchange mass spectrometry. J. Biol. Chem. 2006;281:38834–38844. doi: 10.1074/jbc.M608916200. [DOI] [PubMed] [Google Scholar]
- 14.Zhou B, Zhang Z. Application of hydrogen/deuterium exchange mass spectrometry to study protein tyrosine phosphatase dynamics, ligand binding, and substrate specificity. Methods. 2007;42:227–233. doi: 10.1016/j.ymeth.2007.02.020. [DOI] [PMC free article] [PubMed] [Google Scholar]
- 15.Truhlar SM, Croy CH, Torpey JW, Koeppe JR, Komives EA. Solvent accessibility of protein surfaces by amide H/2H exchange MALDI-TOF mass spectrometry. J. Am. Soc. Mass Spectrum. 2006;17:1490–1497. doi: 10.1016/j.jasms.2006.07.023. [DOI] [PubMed] [Google Scholar]
- 16.Sabo TM, Brasher PB, Maurer MC. Perturbations in factor XIII resulting from activation and inhibition examined by solutions based methods and detected by MALDI-TOF MS. Biochemistry. 2007;46:10089–10101. doi: 10.1021/bi700579z. [DOI] [PubMed] [Google Scholar]
- 17.Bai Y, Milne JS, Mayne L, Englander SW. Primary Structure effects on peptide group hydrogen exchange. Proteins. 1993;17:75–86. doi: 10.1002/prot.340170110. [DOI] [PMC free article] [PubMed] [Google Scholar]
- 18.Weis DD, Kass IJ, Engen JR. Semi-automated analysis of hydrogen exchange mass spectra using HX-Express. J. Amer. Soc. Mass Spectrom. 2006;17(12):1700–1703. doi: 10.1016/j.jasms.2006.07.025. [DOI] [PubMed] [Google Scholar]
- 19.Slysz GW, Baker CAH, Bozsa BM, Dang A, Percy AJ, Bennett M, Schriemer DC. Hydra: software for tailored processing of H/D exchange data from MS or tandem MS analyses. BMC Bioinformatics. 2009;10:162. doi: 10.1186/1471-2105-10-162. [DOI] [PMC free article] [PubMed] [Google Scholar]
- 20.Pascal BD, Chalmers MJ, Busby SA, Griffin PR. HD Desktop: an integrated platform for the analysis and visualization of H/D exchange data. J Am Soc Mass Spectrom. 2009;20:601–610. doi: 10.1016/j.jasms.2008.11.019. [DOI] [PMC free article] [PubMed] [Google Scholar]
- 21.Cravello L, Lascoux D, Forest E. Use of different proteases in acidic conditions to improve sequence coverage and resolution in hydrogen/deuterium exchange of large proteins. Rapid Commun. Mass Spectrom. 2003;17:2387–2393. doi: 10.1002/rcm.1207. [DOI] [PubMed] [Google Scholar]
- 22.Perkins DN, Pappin DJ, Creasy DM, Cottrell JS. Probability-based protein identification by searching sequence databases using mass spectrometry data. Electrophoresis. 1999;20:3551–3567. doi: 10.1002/(SICI)1522-2683(19991201)20:18<3551::AID-ELPS3551>3.0.CO;2-2. [DOI] [PubMed] [Google Scholar]
- 23.Elias JE, Gygi SP. Target-decoy search strategy for increased confidence in large-scale protein identifications by mass spectrometry. Nat. Methods. 2007;4:207–214. doi: 10.1038/nmeth1019. [DOI] [PubMed] [Google Scholar]