

Abstract
Training with limited carbohydrate availability can stimulate adaptations in muscle cells to facilitate energy production via fat oxidation. Here we investigated the effect of consistent training in the fasted state, vs. training in the fed state, on muscle metabolism and substrate selection during fasted exercise. Twenty young male volunteers participated in a 6-wk endurance training program (1–1.5 h cycling at ∼70% V̇o2max, 4 days/wk) while receiving isocaloric carbohydrate-rich diets. Half of the subjects trained in the fasted state (F; n = 10), while the others ingested ample carbohydrates before (∼160 g) and during (1 g·kg body wt−1·h−1) the training sessions (CHO; n = 10). The training similarly increased V̇o2max (+9%) and performance in a 60-min simulated time trial (+8%) in both groups (P < 0.01). Metabolic measurements were made during a 2-h constant-load exercise bout in the fasted state at ∼65% pretraining V̇o2max. In F, exercise-induced intramyocellular lipid (IMCL) breakdown was enhanced in type I fibers (P < 0.05) and tended to be increased in type IIa fibers (P = 0.07). Training did not affect IMCL breakdown in CHO. In addition, F (+21%) increased the exercise intensity corresponding to the maximal rate of fat oxidation more than did CHO (+6%) (P < 0.05). Furthermore, maximal citrate synthase (+47%) and β-hydroxyacyl coenzyme A dehydrogenase (+34%) activity was significantly upregulated in F (P < 0.05) but not in CHO. Also, only F prevented the development exercise-induced drop in blood glucose concentration (P < 0.05). In conclusion, F is more effective than CHO to increase muscular oxidative capacity and at the same time enhances exercise-induced net IMCL degradation. In addition, F but not CHO prevented drop of blood glucose concentration during fasting exercise.
Keywords: skeletal muscle, endurance performance, oxidative capacity, substrate metabolism, glucose homeostasis
exogenous substrate supply plays an important role in modulating the acute metabolic responses to endurance exercise. For instance, carbohydrate intake before and during exercise (6, 13, 14, 17, 21, 35, 39), or alternatively carbohydrate infusion (22, 36), stimulates the contribution of blood glucose to the metabolic substrate pool fueling muscle contractions and inhibits fat oxidation. On the other hand, ingestion of high-fat nutrients (8, 31), or fatty acid infusion (20, 45, 46), stimulates energy production by fat oxidation, while suppressing carbohydrate utilization. Studies in our (17) and other laboratories (10, 11) have also shown that glucose ingestion during exercise significantly blunts the exercise-induced changes in mRNA content of pivotal players in fat metabolism, like fatty acid translocase/CD36 and carnitine palmitoyltransferase 1 (10). It has also been shown that endurance training in conjunction with a fat-rich diet stimulates metabolic adaptations in muscle cells to facilitate energy production by fat oxidation (9, 23, 29). Furthermore, consistent training with low initial glycogen level due to dietary carbohydrate restriction between training sessions resulted in beneficial effects on basal muscle glycogen content (24, 44, 55), mitochondrial oxidative capacity (24, 37, 43, 55) as well as fat oxidation rate during moderate-intensity exercise (37, 55).
Another dietary stimulus to induce specific training adaptations is exercise in a fasted state. The low circulating insulin level, vs. elevated plasma epinephrine concentration associated with fasting exercise (6, 17, 21), stimulates rate of adipose tissue lipolysis and peripheral fat oxidation (35). We recently also demonstrated that the breakdown of intramyocellular lipids (IMCL) in type I fibers (17), as well as glycogen degradation in type IIa fibers (16) during fasting exercise is exaggerated compared with a similar exercise in the fed state. Furthermore, 6 wk of consistent endurance training in the fasted state, but not in the fed state, induced a greater increase of fatty acid binding protein and uncoupling-protein-3 content in muscle (18). This finding is consistent with the prevailing opinion (28) that exercise in a carbohydrate-restricted state eventually causes molecular adaptations in muscle cells to upregulate the capacity for energy production via fat oxidation. Another metabolic challenge produced by exercising in the fasted state is reduced availability of blood glucose (6, 14, 17, 21, 35, 39). Following an overnight fast liver glycogen store is largely depleted, which in the absence of exogenous carbohydrate supply during prolonged exercise causes premature failure of glucoregulation and hypoglycaemia (14, 15). Along the aforementioned rationale, one could assume that consistent exercise in the fasted state triggers physiological adaptations to facilitate glucose homeostasis during exercise with limited liver glycogen availability. In this perspective, it has also been shown that an episode of endurance training with carbohydrate intake before and during exercise results in a higher reliance on exogenous carbohydrate oxidation during exercise (13).
Many endurance athletes perform endurance training sessions after an overnight fast, hoping they will thereby improve their performances in endurance competitions while ingesting ample carbohydrates. In this regard, we recently demonstrated that endurance training in the fasted state, compared with an identical training program in the fed state, during exercise with carbohydrate intake blunted exercise-induced net glycogen breakdown, against the background of unchanged IMCL breakdown (18). However, the latter effect may be explained by the strong inhibitory action of acute carbohydrate ingestion on exercise-induced IMCL degradation (17) via inhibition of hormone-sensitive lipase (HSL) (53), independent of whether prior training was performed in either the fasted or the fed state. In fact, the changes in energy substrate selection developing during chronic fasting exercise have not been previously investigated.
Finally, upregulation of the capacity for fat oxidation may not necessarily translate into improved endurance exercise performance. For instance, it has been previously shown that the administration of a high-fat diet in conjunction with endurance training stimulates the capacity for fat oxidation (8, 9, 23, 27, 30–32, 50), indeed, but fails to enhance endurance performance because the ability of muscles to use muscle glycogen is impaired (8, 30, 50). Conversely, fasting exercise seems to promote fat oxidation, while maintaining intact capacity for glycogen breakdown (14, 16, 25). In this regard, it is possible that endurance training in the fasted state beneficially impacts endurance exercise performance by promoting energy provision via fat oxidation, while maintaining optimal capacity for ATP production via glycogenolysis. However, the effect of consistent training in the fasted state, vs. the fed state, on endurance performance has not been previously investigated.
Against the above background, the primary aim of this study is to compare energy substrate breakdown and blood glucose homeostasis during fasting exercise before and after 6 wk of training in either the fed or fasted state. A secondary aim is to investigate the effect of chronic fasting training on endurance exercise performance while acutely ingesting the normally recommended amounts of carbohydrates.
MATERIALS AND METHODS
Subjects
Twenty healthy, physically active males volunteered to participate in the study, which was approved by the K. U. Leuven Ethics Committee. Subjects gave their written informed consent after they were informed of all experimental procedures and risks associated with the experiments. The two experimental groups [exercise training in the fasted state (F) or similar training with ample carbohydrate intake before and during exercise (CHO); see below] were similar in age (F: 23.0 ± 1.1 yr; CHO: 22.1 ± 0.9 yr). All subjects were involved in regular sports and physical activity at a rate of ∼4 h/wk (F: 4.4 ± 0.6 h; CHO: 3.4 ± 0.6 h), but none of them was consistently endurance trained in either cycling or running. Subjects were instructed not to participate in any strenuous exercise sessions other than prescribed by the study protocol.
Preliminary Testing and Subject Randomization
Two weeks before the start of the study, the subjects performed a maximal incremental exercise test (initial load 100 W + 35 W per 3 min) on a bicycle ergometer (Avantronic Cyclus II, Leipzig, Germany) to determine rate of maximal oxygen uptake (V̇o2max) and the corresponding workload (Wmax). Heart rate (Polar, Kempele, Finland), oxygen uptake (V̇o2), and carbon dioxide output (V̇co2) (Cortex Metalyzer II, Leipzig, Germany) were continuously measured during the test, and the exercise intensity corresponding to the maximal rate of fat oxidation (FATmax) was determined as previously described (1). Thereafter, subjects participated in two familiarization sessions during which they performed a 2-h constant-load exercise bout on the bicycle ergometer after a ∼12-h overnight fast. The subjects received 750 ml water/h to be ingested ad libitum during the exercise. During the first familiarization session subjects were allowed to adjust the workload (W) every 10 min to tune the required workload to reach a point of exhaustion within 2 h. This workload was further adjusted during the second familiarization trial and was eventually used during the experimental sessions. Rate of oxygen uptake at this workload corresponded to 65 ± 2% of pretraining V̇o2max. Furthermore, the subjects also participated in another familiarization session to determine the workload (mean power output during the familiarization session) to be used as the initial workload in a 1-h simulated time trial on the cycle ergometer (TT). Finally, subjects completed a 4-day dietary record to assess their normal dietary habits. Energy intake and diet composition were analyzed using a nutritional software package (Becel 5.00, Unilever Bestfoods, Rotterdam, The Netherlands). Based on these preliminary examinations, subjects were eventually matched to form duplets with similar values for exercise capacity (V̇o2max and power outputs during the 2-h steady-state exercise and the 1-h TT) and energy intake (kcal/24 h). At the start of the study, duplets were randomly split into either of two experimental groups.
Study Design and Experimental Groups
After the randomization, all subjects were enrolled in a 6-wk training program associated with a dietary control regimen (see below). The supervised training program consisted either of exercise training in the fasted state (F, n = 10), or similar training with ample carbohydrate intake before and during exercise (CHO, n = 10; see below). Before (pretest) and at the end (posttest) of the 6-wk intervention period, the subjects participated in a 2-day experimental session involving 2-h constant-load exercise and a 1-h TT.
Dietary Intervention
As indicated above, before the start of the study a 4-day dietary analysis was performed. Based on these dietary analyses, for each individual a carbohydrate-rich standard diet (2,500–3,500 kcal, 65% carbohydrates, 20% fat, 15% protein) was elaborated. From Monday to Friday, a supervised lunch was served, whereas all other meals, snacks, and drinks were provided by the investigators as individual take-home food packages. During the weekends, the subjects were instructed to continue consuming carbohydrate-rich meals and snacks, and they completed a detailed food diary for analysis on completion of the study.
Training Intervention
F subjects performed all training sessions in the fasted state, whereas CHO subjects received a carbohydrate-rich breakfast (646–907 kcal, 85% carbohydrates, 6% fat, 9% protein) ∼90 min before each training session. In addition, during exercise CHO ingested a drinking solution containing 1 g maltodextrin/kg body wt in 500 ml water per hour, while F received a similar volume of water. To obtain identical daily energy intakes between F and CHO throughout the study, F received the “breakfast” which they missed in the morning, plus the amount of maltodextrin they omitted during exercise, in midafternoon. Subjects participated in two 60-min and two 90-min training sessions per week, always between 6:30 and 9:00 AM. Compared with our previous study protocol (18), we included an additional fourth weekly exercise session to increase the training stimulus. Training sessions consisted of cycling exercise, and subjects from F and CHO consistently trained as matched pairs. They simultaneously performed identical training sessions at the same time. However, during cycling F subjects were instructed to adjust the workload to obtain a heart rate corresponding with ∼70% pretraining V̇o2max, while CHO subjects adjusted the workload to correspond with their F companion. Thus training duration and absolute exercise intensity were identical between F and CHO at all times.
Pretest and Posttest
The pretest and the posttest were each organized over two separate days. At each occasion subjects reported to the laboratory between 6:00 and 10:00 AM and after a ∼12-h overnight fast. After a 30-min rest, a blood sample (10 ml) was taken from an antecubital vein. Immediately afterward, a percutaneous needle biopsy was taken from the right vastus lateralis muscle under local anesthetic through an incision in the skin (2–3 ml lidocaine sc). Thereafter subjects cycled for 2 h at a constant workload, which was determined during the familiarization sessions (175 ± 6 W). After 10 min, halfway through, and at the end of the exercise bout, V̇o2 and V̇co2 were measured over a 5-min interval (Cortex Metalyzer II, Leipzig, Germany). Capillary blood was sampled from a hyperemic earlobe before and after the first and second hour of exercise. During the exercise bout subjects received 750 ml of water per hour to drink ad libitum. The volume consumed during the pretest was recorded and reproduced during the posttest. At the end of the exercise bout, another muscle biopsy and a venous blood sample were taken. The muscle biopsy was through the same incision as the preexercise biopsy, but with the needle pointing into another direction. Subjects were instructed to abstain from strenuous exercise for at least 2 days before the biopsy taking. During the posttest the biopsies were taken ∼48 h after the last training session.
Two days later the subjects reported back to the laboratory between 8:00 and 9:00 AM and in the fasted state and received a standardized carbohydrate-rich breakfast (650–850 kcal, 85% carbohydrates, 6% fat, 9% protein). After a 2-h rest in a comfortable chair subjects performed a 1-h TT during which they received a drinking solution containing 1 g maltodextrin/kg body wt in 500–750 ml water to be ingested ad libitum. Initial workload was set at 228 ± 7 W as determined during the earlier familiarization session, after which the subjects were allowed during the first 40 min to adjust the workload at 10-min intervals according to their subjective perception of fatigue. Thereafter, they could adjust the workload at minutes 45, 50, 52, 54, 56, and 58 to reach a point of exhaustion at 60 min. Throughout the TT power output was continuously measured but was hidden to the subjects, and mean power output and total work (kJ) performed were calculated.
Analysis of Muscle Samples
Muscle biopsy handling.
Part of the muscle samples was immediately frozen in liquid nitrogen. The remaining part was mounted in embedding medium (Tissue-Tek, Sakura FineTek, Zoeterwoude, The Netherlands) and frozen in isopentane that was cooled in liquid nitrogen. All muscle samples were stored at −80°C until later analysis.
Muscle glycogen.
Muscle glycogen content was measured as glucose residues after acid hydrolysis in freeze-dried muscle tissue using a standard enzymatic fluorometric assay (41).
Histological analyses.
Serial sections (4 μm) from biopsy samples were laid together on uncoated glass slides for determination of fiber type-specific IMCL content and capillary density. The staining of IMCL by Oil-Red-O was performed as we have previously described (17). The Oil-Red-O signal was quantified for each muscle fiber resulting in a total of 175 ± 5 muscle fibers analyzed for each muscle cross section (104 ± 4 type I and 70 ± 3 type IIa muscle fibers). Fiber type-specific IMCL content was expressed as arbitrary units (AU).
Capillary staining.
Cryosections were fixed for 10 min in 4% paraformaldehyde in PBS. Slides were rinsed for 2 × 5 min with wash buffer (0.5% BSA in PBS), treated with 10 mM NH4Cl, and washed again (2 × 5 min). Thereafter, slides were prehybridized in 1% BSA in PBS for 30 min after which sections were incubated for 2 h at room temperature with a primary antibody against CD31 (DakoCytomation, Heverlee, Belgium) for capillary staining. Incubation was followed by washes (3 × 5 min) with wash buffer, and a biotinylated rabbit anti-mouse IgG (H and L) antibody (DakoCytomation) was added for 1 h. Slides were washed again (3 × 5 min) after which sections were incubated overnight at 4°C with two primary monoclonal antibodies against human myosin heavy chain I (A4.840 supernatant, Developmental Studies Hybridoma Bank Iowa City, IA) and IIa (N2.261 supernatant, Developmental Studies Hybridoma Bank) to determine muscle fiber type (I and IIa, respectively). Incubation was followed by 3 × 5 min washes with wash buffer, after which the appropriate conjugated antibodies (type I: FITC anti-mouse IgM, Southern Biotechnology Associates, Birmingham, AL; type IIa: Alexa Fluor350 anti-mouse IgG1, Molecular Probes, Leiden, The Netherlands) were added. After being washed again (3 × 5 min in wash buffer) muscle sections were incubated in streptavidin for 30 min, washed with wash buffer (3 × 5 min), before an incubation for 8 min in cyanine. Thereafter, sections were washed again (3 × 30 s) and cover slips were mounted with Fluorescent Mounting Medium (DakoCytomation, Carpinteria, CA). Slides were examined using a Nikon E1000 fluorescence microscope (Nikon, Boerhavedorp, Germany) equipped with a digital camera. Epifluorescence signal was recorded using a Texas red excitation filter for capillaries, and FITC and DAPI filter for type I and IIa muscle fibers, respectively. Captured images (×20 magnification) were processed and analyzed using Lucia G software (LIM, Prague, Czech Republic).
Enzyme activities.
Maximal activities of citrate synthase (CS) and β-hydroxyacyl coenzyme A dehydrogenase (β-HAD) were performed using enzymatic spectrophotometric assays as previously described (19).
Muscle lysate production and Western blotting.
Muscle lysate production and Western blotting were done as previously described (17). The primary antibodies used were GLUT4 (Millipore, Brussels, Belgium), AMP-activated protein kinase α (AMPKα) (Cell Signalling Technology), phospho-AMPKα Thr172 (Cell Signaling), and GAPDH (Abcam, Cambridge, UK). The appropriate secondary antibodies were used (DakoCytomation and Cell Signaling). Band density was calculated by using Kodak 1-D image analysis software. Results were expressed relative to a standard (a pool made from all pretest samples) that was run together with the samples, and for GLUT4 also relative to GAPDH.
Analysis of Blood Samples
Venous blood samples were collected into vacuum tubes containing either EDTA or lithium heparin or Silica Clot Activator (BD Vacutainer). Tubes were centrifuged (1,500 rpm for 15 min at 4°C) and the supernatant was stored at −20°C or −80°C until later analysis. Capillary blood samples were immediately analyzed for blood glucose (Glucocard X-meter, Arkray, Kyoto, Japan) and lactate (Lactate-Pro, Arkray) concentrations. Serum insulin was assayed by chemiluminescence using the Siemens DPC kit and according to the instructions of the manufacturer. Plasma nonesterified free fatty acids (FFA) were determined using a reagent kit (WAKO Chemicals, Neuss, Germany). Plasma catecholamines were determined by means of a high-performance liquid chromatography method using electrochemical detection.
Data Calculations and Statistical Analyses
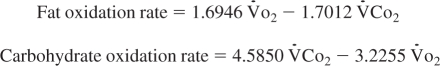
Carbohydrate and fat oxidation rates were calculated from the measured V̇o2 and V̇co2 values according to the following equations (47):
 |
Treatment effects were evaluated using a repeated-measures ANOVA. Two-way ANOVA was performed to examine the main effects of treatment and/or time. A planned contrast analysis was used for post hoc comparisons, when appropriate. Contrast analysis was also used to evaluate specific preplanned comparisons. A probability level (P) ≤ 0.05 was considered statistically significant. All data are expressed as means ± SE.
RESULTS
Exercise Capacity and Body Weight (Table 1)
Table 1.
Effects of training in the fasted state vs. training in the carbohydrate-fed state during an incremental exercise test to exhaustion and a 1-h time trial
| F | CHO | |
|---|---|---|
| Incremental V̇o2max test | ||
| V̇o2max, ml · min−1 · kg−1 | ||
| Pretest | 56.7 ± 3.3 | 57.0 ± 3.7 |
| Posttest | 61.8 ± 3.0* | 61.4 ± 2.6* |
| Time to exhaustion, min | ||
| Pretest | 26.9 ± 1.1 | 26.6 ± 1.1 |
| Posttest | 29.3 ± 1.1* | 28.8 ± 0.9* |
| FATmax, W† | ||
| Pretest | 154 ± 11 | 169 ± 9 |
| Posttest | 186 ± 10* | 180 ± 9* |
| 1-h Time trial | ||
| Total work, kJ | ||
| Pretest | 823 ± 36 | 820 ± 37 |
| Posttest | 881 ± 34* | 887 ± 37* |
Data provided are means ± SE (F: n = 10; CHO: n = 10). An incremental exercise test and a 1-h time trial were performed on a bicycle ergometer before (pretest) and after (posttest) a 6-wk training period in either the fasted state (F) or with ample carbohydrate intake before and during the training sessions (CHO). FATmax represents the exercise intensity estimated to correspond with the maximal rate of fat oxidation as previously described (1). V̇o2max, Maximal oxygen uptake.
P < 0.05 vs. pretest.
P < 0.05, time × group effect.
Subjects performed a maximal incremental exercise test before (pretest) and after (posttest) the training period. V̇o2max and time to exhaustion were similar between the groups in the pretest and increased by 9% after training (P < 0.01). The workload corresponding to maximal rate of fat oxidation (FATmax) was also similar between the experimental groups in the pretest. However, compared with CHO (+6%, P < 0.05), the training-induced increase in FATmax was substantially greater in F (+21%, P < 0.05 compared with CHO). During the 1-h time trial, in the pretest total work performed was similar between F and CHO and the training intervention increased work output by ∼8% (P < 0.001) in both groups. The isocaloric diet was successful in maintaining body weight during the training period. Body weight before training was similar between F (76.0 ± 4.6 kg) and CHO (77.6 ± 3.7 kg). Corresponding values after training were 75.8 ± 4.3 and 76.9 ± 3.4 kg.
Substrate Oxidation (Table 2)
Table 2.
Effects of training in the fasted state vs. training in the carbohydrate-fed state on respiratory gas exchange during a 2-h constant-load exercise bout
| F |
CHO |
|||||
|---|---|---|---|---|---|---|
| Minute 10 | Minute 60 | Minute 120 | Minute 10 | Minute 60 | Minute 120 | |
| V̇o2, l/min | ||||||
| Pretest | 2.68 ± 0.15 | 2.83 ± 0.17 | 2.89 ± 0.17 | 2.69 ± 0.14 | 2.80 ± 0.15 | 2.83 ± 0.18 |
| Posttest | 2.66 ± 0.13 | 2.68 ± 0.10 | 2.83 ± 0.12 | 2.66 ± 0.15 | 2.75 ± 0.13 | 2.89 ± 0.13 |
| V̇co2, l/min | ||||||
| Pretest | 2.51 ± 0.11 | 2.56 ± 0.13 | 2.59 ± 0.13 | 2.53 ± 0.14 | 2.54 ± 0.13 | 2.54 ± 0.17 |
| Posttest | 2.32 ± 0.13* | 2.24 ± 0.11* | 2.32 ± 0.13* | 2.29 ± 0.15* | 2.28 ± 0.11* | 2.34 ± 0.12* |
| RER | ||||||
| Pretest | 0.94 ± 0.02 | 0.91 ± 0.02 | 0.90 ± 0.02 | 0.94 ± 0.02 | 0.91 ± 0.02 | 0.90 ± 0.02 |
| Posttest | 0.87 ± 0.01* | 0.84 ± 0.01* | 0.82 ± 0.01* | 0.86 ± 0.02* | 0.83 ± 0.02* | 0.81 ± 0.02* |
| Fat oxidation rate, g/min | ||||||
| Pretest | 0.29 ± 0.09 | 0.44 ± 0.11 | 0.50 ± 0.11 | 0.27 ± 0.07 | 0.43 ± 0.09 | 0.48 ± 0.09 |
| Posttest | 0.56 ± 0.06* | 0.78 ± 0.05* | 0.85 ± 0.06* | 0.61 ± 0.07* | 0.85 ± 0.08* | 0.92 ± 0.07* |
| Carbohydrate oxidation rate, g/min | ||||||
| Pretest | 2.79 ± 0.14 | 2.58 ± 0.23 | 2.50 ± 0.20 | 2.86 ± 0.23 | 2.58 ± 0.21 | 2.47 ± 0.29 |
| Posttest | 2.03 ± 0.23* | 1.62 ± 0.19* | 1.48 ± 0.24* | 1.89 ± 0.24* | 1.52 ± 0.20* | 1.37 ± 0.22* |
Data provided are means ± SE (F: n = 10; CHO: n = 9) and represent values before (pretest) and after (posttest) a 6-wk training period in either the fasted state (F) or with ample carbohydrate intake before and during the training sessions (CHO). The respiratory data represent measurements at the start (at minute 10), halfway through (at minute 60), and at the end (at minute 120) of a 2-h constant-load exercise bout. The workload was 175 ± 6 W and corresponded to 65% of V̇o2max in the pretest vs. 60% of V̇o2max in the posttest. Fat and carbohydrate oxidation rates were calculated using the nonprotein respiratory quotient. V̇o2, oxygen uptake; V̇co2, carbon dioxide output; RER, respiratory exchange ratio.
P < 0.05 vs. pretest.
Metabolic measurements were done during the 2-h constant-load exercise test (175 ± 6 W), which due to the increase in V̇o2max corresponded to ∼65% of V̇o2max in the pretest vs. 60% of V̇o2max in the posttest. Substrate oxidation rates were calculated from the respiratory measurements, which were similar between the groups during the pretest. V̇co2 slightly decreased due to training (P < 0.05), while V̇o2 was unchanged. Hence, independent of the experimental condition and compared with the pretest, respiratory exchange ratio (RER) was lower in the posttest than in the pretest (P < 0.01), which corresponds with the increased contribution of fat oxidation to energy production posttraining (P < 0.001).
IMCL (Figs. 1 and 2)
Fig. 1.

Effects of training in the fasted state (F) vs. training in the carbohydrate-fed state (CHO) on intramyocellular lipid (IMCL) content during a 2-h constant-load exercise bout. Data provided are means ± SE (F: n = 9; CHO: n = 9) and represent values before (pretest) and after (posttest) a 6-wk training period in either the fasted state (F) or with ample carbohydrate intake before and during the training sessions (CHO). Intramyocellular lipid content was measured before and at the end of a 2-h constant-load cycling bout. The workload was 175 ± 6 W and corresponded to 65% of V̇o2max in the pretest vs. 60% of V̇o2max in the posttest. Panel Basal IMCL content (A) and net IMCL breakdown (B) in type I (top) and type IIa (bottom) fibers. Fiber type-specific IMCL content was determined by fluorescence microscopy on Oil-Red-O-stained muscle cross sections [arbitrary units (AU)]. *P < 0.05 vs. pretest. #P < 0.05, significant IMCL breakdown during exercise.
Fig. 2.

Intramyocellular lipid content visualized by Oil-Red-O staining before and after a 2-h constant-load exercise bout in one subject before and after training in the fasted state. Pictures show cross sections of a human vastus lateralis muscle before (pretest; A and B) and after (posttest; C and D) a 6-wk training period in the fasted state. Intramyocellular lipid content was measured before (A and C) and at the end of a 2-h constant-load cycling bout (B and D). Intramyocellular lipid droplets are stained red by the Oil-red-O assay. Type I and type IIx muscle fibers are identified; all other fibers are type IIa fibers.
Fiber type-specific measurements of IMCL content were done by Oil-Red-O staining. In the pretest, basal IMCL content was similar between the groups in both type I and type IIa fibers, and values were not changed by the training intervention. In the pretest, in both F and CHO the exercise bout decreased IMCL content by ∼30% in type I fibers, while no significant decrease occurred in type IIa fibers. Compared with the pretest, in the posttest IMCL degradation in type I fibers was enhanced in F (+34%; P < 0.05), but not significantly in CHO (+25%; P = 0.13). By analogy, and contrary to the pretest, in the posttest the exercise induced substantial net IMCL degradation in type IIa fibers in F (−45%; P < 0.05), and this decrease tended to be greater than in the pretest (P = 0.07). Conversely, in CHO the training intervention did not significantly enhance IMCL breakdown in type IIa fibers (P = 0.17).
Muscle Glycogen (Table 3)
Table 3.
Effects of training in the fasted state vs. training in the carbohydrate-fed state on muscle glycogen content during a 2-h constant-load exercise bout
| F | CHO | |
|---|---|---|
| Pretest | ||
| Before | 585 ± 32 | 632 ± 40 |
| After | 276 ± 25 | 288 ± 21 |
| Net breakdown | 309 ± 27 | 344 ± 42 |
| Posttest | ||
| Before | 713 ± 42* | 631 ± 26 |
| After | 397 ± 20*† | 318 ± 23 |
| Net breakdown | 316 ± 31 | 313 ± 31 |
Data provided are means ± SE (F: n = 10; CHO: n = 10) and represent values (mmol/kg dry wt) before (pretest) and after (posttest) a 6-wk training period in either the fasted state (F) or with ample carbohydrate intake before and during the training sessions (CHO). Muscle glycogen content was measured before and at the end of a 2-h constant load cycling bout. The workload was 175 ± 6 W and corresponded to 65% of V̇o2max in the pretest vs. 60% of V̇o2max in the posttest. Glycogen content was measured using a standard enzymatic fluorometric assay.
P < 0.05 vs. pretest.
P < 0.05 vs. CHO.
Initial muscle glycogen content in the pretest was similar between the groups, and exercise-induced glycogen breakdown amounted to ∼55% of the initial content. The 6-wk training period elicited a 22% increase in basal glycogen content in F (P < 0.05), whereas no change occurred in CHO (P = 0.99; P = 0.08 compared with F). Independent of the experimental condition, net glycogen breakdown during exercise was similar between the pretest and the posttest.
AMPKα and GLUT4 (Fig. 3 and Table 4)
Fig. 3.

Effects of training in the fasted state vs. training in the carbohydrate-fed state on AMPKα phosphorylation during a 2-h constant-load exercise bout. Data provided are means ± SE (F: n = 10; CHO: n = 10) and represent values before (pretest) and after (posttest) a 6-wk training period in either the fasted state (F) or with ample carbohydrate intake before and during the training sessions (CHO). AMPKα phosphorylation was measured before and at the end of a 2-h constant-load cycling bout. The workload was 175 ± 6 W and corresponded to 65% of V̇o2max in the pretest vs. 60% of V̇o2max in the posttest. A: basal AMPKα phosphorylation. B: net AMPKα phosphorylation change. AMPKα phosphorylation was determined by Western blotting and expressed relative to total AMPKα protein content (AU). *P < 0.05 vs. pretest.
Table 4.
Effects of training in the fasted state vs. training in the carbohydrate-fed state on muscle GLUT4 content, maximal mitochondrial enzyme activities, and capillary density
| F | CHO | |
|---|---|---|
| GLUT4, AU | ||
| Pretest | 0.79 ± 0.10 | 0.86 ± 0.07 |
| Posttest | 1.20 ± 0.16* | 1.28 ± 0.11* |
| Citrate synthase, μmol · min−1 · g−1§ | ||
| Pretest | 245 ± 27 | 285 ± 33 |
| Posttest | 361 ± 35* | 301 ± 45 |
| β-HAD, μmol · min−1 · g−1 | ||
| Pretest | 133 ± 12 | 126 ± 20 |
| Posttest | 179 ± 27* | 141 ± 12 |
| Capillary density, number per fiber | ||
| Type I fibers | ||
| Pretest | 4.9 ± 0.2 | 4.9 ± 0.2 |
| Posttest | 5.4 ± 0.1* | 5.6 ± 0.2* |
| Type IIa fibers | ||
| Pretest | 4.9 ± 0.2 | 4.8 ± 0.2 |
| Posttest | 5.3 ± 0.2* | 5.5 ± 0.1* |
Data provided are means ± SE (F: n = 6–10; CHO: n = 6–10) and represent values before (pretest) and after (posttest) a 6-wk training period in either the fasted state (F) or with ample carbohydrate intake before and during the training sessions (CHO). Total GLUT4 protein content was measured by Western blotting (expressed relative to GAPDH; AU, arbitrary units), maximal mitochondrial activities of citrate synthase and β-hydroxyacyl coenzyme A dehydrogenase (β-HAD) were measured using enzymatic spectrophotometric assays, and the number of capillaries per fiber was determined by immunohistochemistry.
P < 0.05 vs. pretest.
P < 0.05, time × group effect.
AMPK activity was measured as the phosphorylated fraction of total AMPKα protein content. Total AMPKα content was similar between the groups in both the pretest and the posttest (data not shown). In the pretest, exercise increased the degree of AMPKα phosphorylation, but values were similar between F and CHO both before and after exercise. The training intervention markedly increased baseline AMPKα phosphorylation status in both F and CHO (P < 0.01), while the exercise-induced increase was completely abolished. Muscle total GLUT4 protein content in the pretest was similar between the groups, and the training increased GLUT4 content by ∼50% (P < 0.01).
Oxidative Enzymes and Capillary Density (Table 4)
Muscle oxidative capacity was assessed via CS and β-HAD activities in resting muscles. In the pretest CS and β-HAD activity was similar between the groups. The training period substantially increased CS activity in F (+47%, P < 0.01) but not in CHO (P = 0.59, P < 0.05 compared with F). By analogy, compared with the pretest, in the posttest β-HAD activity was increased in F (P < 0.05) while it was unchanged in CHO (P = 0.39). Finally, independent of the experimental condition the training period increased capillary density by ∼10% from ∼5 to ∼5.5 capillaries per fiber in both type I and type IIa fibers (P < 0.05).
Blood Glucose (Fig. 4) and Blood Lactate
Fig. 4.

Effects of training in the fasted state vs. training in the carbohydrate-fed state on blood glucose concentration during a 2-h constant-load exercise bout. Data provided are means ± SE (F: n = 10; CHO: n = 10) and represent values before (pretest) and after (posttest) a 6-wk training period in either the fasted state (F) or with ample carbohydrate intake before and during the training sessions (CHO). Concentrations of blood glucose were measured before and at the end of a 2-h constant-load cycling bout. The workload was 175 ± 6 W and corresponded to 65% of V̇o2max in the pretest vs. 60% of V̇o2max in the posttest. *P < 0.05 vs. pretest. †P < 0.05 vs. CHO. #P = 0.07 vs. pretest.
During the pretest blood glucose decreased from ∼4.5 mmol/l at rest to ∼4.0 mmol/l at the end of the 2-h exercise bout, with no difference between F and CHO. In F, in the posttest this exercise-induced drop in blood glucose was offset. Conversely, in CHO blood glucose concentration was well maintained during the first half of the exercise bout indeed, but thereafter dropped to the same degree as in the pretest. Hence postexercise blood glucose concentration in CHO was significantly lower than in F (P < 0.05). Independent of the experimental conditions, baseline lactate concentrations were ∼2 mmol/l in the pretest and the posttest. During exercise values dropped to a lactate steady state at ∼1.7 mmol/l in the pretest vs. ∼1 mmol/l in the posttest (P < 0.05 compared with pretest), but values were similar between F and CHO at all times.
Plasma free fatty acids (FFA)
During the pretest the exercise increased plasma FFA concentration ∼5-fold in both groups (F: 388 ± 70 to 2,131 ± 200 μmol/l; CHO: 418 ± 40 to 2,343 ± 185 μmol/l, P < 0.0001). Baseline plasma FFA levels were not changed by the interventions in either F (469 ± 56 μmol/l) or CHO (411 ± 43 μmol/l). Compared with the pretest, postexercise FFA concentration was lower in both F (1,657 ± 136 μmol/l, P < 0.01) and CHO (1,857 ± 132 μmol/l, P < 0.05) during the posttest.
DISCUSSION
In this study we investigated the effect of a 6-wk supervised endurance training program under tight dietary control, on some metabolic adaptations in relation to exercise. The training program was successful in improving V̇o2max (+9%), FATmax (+6–21%), as well as 60-min time trial performance (+8%). In addition, muscle capillary density (+10%) was increased. However, half of the subjects consistently performed the training sessions in the fasted state (F), while the others performed identical sessions in conjunction with ample carbohydrate intake before and during exercise (CHO). The data demonstrate that F, more than CHO, enhanced the contribution of IMCL to energy provision during fasting exercise. Moreover, F was more potent to stimulate CS and β-HAD activities than CHO. Finally, drop of blood glucose concentration during fasting exercise was prevented by F, but not by CHO.
It has been known for many years that carbohydrate intake inhibits fatty acid oxidation during exercise. Along this line, it is well documented that the utilization of peripheral fatty acids as well as IMCL for energy provision is markedly enhanced during exercise in the fasted state (6, 14, 17, 21, 35, 39). A novel finding in the present study is that IMCL degradation during a fasting exercise bout is significantly enhanced by endurance training only by training in the fasted state. Before the 6-wk training program, 2 h of constant-load endurance exercise resulted in ∼30% net IMCL degradation in type I fibers (see Fig. 1), while IMCL breakdown in type IIa fibers was negligible, which is in line with our and other earlier findings (17, 18, 51). The training period did not change basal IMCL content either in type I or in type IIa fibers, which once more clearly indicates that elevating IMCL content is not a first line adaptation to endurance training (7, 18, 33). Against this background of unchanged basal IMCL level, IMCL degradation during exercise was substantially increased by the training intervention in the fasted state. In F but not significantly in CHO, net exercise-induced IMCL breakdown in type I fibers increased from ∼30% before to ∼60% of initial content after training. Interestingly, F was also more potent than CHO to stimulate IMCL degradation in type IIa fibers. In contrast with the minor degree of net IMCL breakdown in this fiber type before training, after training exercise depleted IMCL content by ∼45% in F, but still not significantly in CHO (−30%, P = 0.12, see Fig. 1B). Thus, for a given absolute exercise intensity and duration, F stimulated exercise-induced IMCL degradation in type IIa fibers (see Figs. 1 and 2), although the change in net IMCL breakdown from the pretest to the posttest only tended (P = 0.07) to be increased.
Different physiological mechanisms might explain the increased contribution of IMCL to energy production in muscles during a fasting exercise bout, following consistent prior training in the fasted state. First, we have previously suggested that the small amount of IMCL breakdown occurring in type IIa fibers during 2 h of submaximal exercise at ∼65% of V̇o2max in fit young volunteers may reflect marginal recruitment of this fiber population at the moderate exercise intensity considered (17). However, our present findings contradict such interpretation in that they show fasting exercise at an even lower relative exercise intensity posttraining (∼60% V̇o2max) than pretraining (∼65% V̇o2max) elicited substantial IMCL breakdown in type IIa fibers. Lower relative exercise intensity as a rule reduces the fraction of type II fibers being recruited (38), an effect which is conceivably independent of whether the exercise is performed in either the fed state or in the fasted state. Second, the higher amount of IMCL breakdown following training in F compared with CHO is not explained by higher rate of total fat oxidation as such because the training increased the total contribution of fat oxidation to oxidative energy production during exercise from ∼25% to ∼55% with no difference between F and CHO (see Table 2). Still, one would expect elevated oxidative capacity in F, as evidenced by increased FATmax and higher maximal oxidative enzyme activities, to result in greater whole body fat oxidation during exercise. However, the absolute workload used for the 2-h exercise bout (175 ± 6 W) in the posttest dropped below the workload corresponding to FATmax in F (185 ± 10 W), which may have prevented full recruitment of the elevated capacity for fat oxidation. Even when considering the fact that substrate oxidation rates calculated from whole body V̇o2 and V̇co2 may not exactly reflect carbohydrate vs. fat oxidation rates in the leg, it is reasonable to conclude from our data that F induced adaptations in muscle cells to shift fat fuel selection during contractions toward a higher fraction of IMCL utilization vs. decreased oxidation of blood-borne FFAs. Such effect would conceivably be at least partly due to upregulation of HSL, which is the rate-limiting step in IMCL breakdown. Support for such a contention comes from our earlier report (17) showing carbohydrate ingestion before and during exercise to fully offset the potential effect of F to stimulate IMCL degradation in type IIa fibers, which is conceivably due to inhibition of HSL action by a markedly decreased epinephrine:insulin ratio (53). Furthermore, it has recently also been demonstrated that the protein expression of adipose triacylglycerol lipase (ATGL) is increased by training (5), which indicates a possible role for ATGL in exercise-induced IMCL hydrolysis. However, the effect of nutritional context on regulation of ATGL during exercise is unknown at present. It is important to mention that we can only speculate about the mechanisms underlying the specific stimulation of net exercise-induced IMCL breakdown by consistent training in the fasted state because we did not directly calculate fuel oxidation in muscle, neither did we perform measurements of HSL and ATGL activity. It is also interesting to emphasize that the shift toward a higher fraction of IMCL breakdown from the pretest to the posttest existed against the background of unchanged net muscle glycogen breakdown (see Table 3). Still, muscles were likely able to selectively increase the contribution of IMCL in energy production. Unfortunately, tissue availability was too limited to perform a fiber type-specific assay of muscle glycogen content. However, it is tempting to speculate that increased IMCL breakdown in type IIa fibers induces glycogen sparing in this fiber type. Furthermore, baseline muscle glycogen content in F was increased in the posttest (see Table 3), which could be expected to stimulate net exercise-induced net muscle glycogen degradation (26, 34). Nonetheless, net glycogen breakdown was unchanged, which corroborates our earlier findings showing glycogen sparing during exercise with carbohydrate intake, following a period of training in the fasted state (18). Furthermore, the constant contribution of glycogen to energy provision also is compatible with enhanced fat oxidation rate in conjunction with elevated muscular oxidative capacity. In fact, in a similar study we have previously demonstrated that F induced glycogen sparing during exercise with carbohydrate intake (16). Increasing aerobic power is a primary objective of endurance training, and muscular oxidative capacity obviously is a major determinant of aerobic power. Therefore, any training or nutritional intervention that may stimulate adaptations in muscle cells to facilitate oxidative energy provision is likely to eventually enhance endurance exercise performance. Accordingly, the lower blood lactate levels during the constant-load exercise in the posttest indicate that more of the pyruvate formed entered the Krebs cycle. Interestingly in this respect, we here clearly demonstrate that a given duration and intensity of endurance training in the fasted state are more effective than an identical amount of training in the fed state to increase muscular oxidative capacity. Support for such conclusion comes from our finding that 6 wk of F caused a threefold greater increase of FATmax (+21%) than CHO (+6%). The so-called FATmax threshold is a valid measurement of aerobic capacity in whole body exercise, and in addition FATmax is the exercise intensity eliciting maximal rate of fat oxidation (1). Moreover, compared with CHO, F caused an increase in maximal β-HAD activity, a pivotal enzyme in β-oxidation. These observations are fully in line with the primary hypothesis driving the present study, notably that fasting training upregulates the capacity for oxidative energy production via fat oxidation. However, F not only stimulated β-HAD, but also elevated maximal CS activity, a rate-limiting enzyme in the Krebs cycle. This clearly indicates that training in the fasted state is a more potent stimulus than training with ample carbohydrate intake to enhance muscular oxidative capacity. Additional support for such a conclusion comes from recent studies showing that the omission of carbohydrate intake during a 4- to 8-wk period of endurance training resulted in a greater increase in succinate dehydrogenase activity (43) as well as β-HAD or CS activity (44, 49) than when a carbohydrate solution was ingested during the exercise sessions. By analogy, training in a state of glycogen depletion and without the provision of exogenous carbohydrates was found to stimulate both CS and β-HAD activity (24, 55). In fact, most (24, 43, 44, 49, 55) but not all studies (4, 13), including the present study, have reported consistent training in a state of reduced carbohydrate availability due to different nutritional interventions to facilitate upregulation of oxidative capacity in muscle cells. Furthermore, we also have recently demonstrated that the upregulation of fatty acid binding protein by consistent training in the fasted state is entirely negated by carbohydrate intake before and during the training sessions (18). The precise cellular mechanisms underlying these beneficial effects of training in a state of carbohydrate depletion are still unclear, but it is reasonable to speculate that greater exercise-induced distortion of energy homeostasis is implicated in triggering the training adaptations (42, 48). In this regard, it is well documented that AMPK activity is stimulated by exercise under conditions of carbohydrate restriction (3, 17). However, F and CHO slightly increased AMPK phosphorylation in resting muscle, while similarly suppressing the exercise-induced activation of AMPK (see Fig. 3). AMPK may also be involved in stimulating mitochondrial biogenesis by stimulating the phosphorylation of PGC1-α. However, available literature indicate that PGC1-α is not differentially regulated by exercise with or without carbohydrate intake (11, 43).
One would in fact expect enhanced oxidative capacity in F, as evidenced by increased FATmax and oxidative enzyme capacities, to result in better performance in a 60-min time trial. However, performances were similar between F and CHO. In this regard, it is important to note that F may not have readily translated into improved cycling time trial performance because the training sessions were performed at substantially lower workloads (70% V̇o2max) than needed in the time trials (∼85% V̇o2max). Together with the short duration of the training period, this probably largely explains the small overall improvement in time-trial performance (8%). Within such narrow margin, and against the background noise of normal day-to-day variability in endurance performances, it probably is impossible to isolate the anticipated differential effect of F and CHO on time-trial performance.
It is well known that maintenance of blood glucose homeostasis has a high priority at rest as well as during exercise. Nonetheless, during prolonged fasting exercise at even moderate intensities, blood glucose level readily decreases as a consequence of hepatic glucose production failing to compensate for increased peripheral glucose utilization (2, 12, 14, 15). Accordingly, in the pretest during the 2-h fasting exercise bout blood glucose concentration expectedly decreased in both groups (see Fig. 4). Interestingly, F but not CHO prevented the exercise-induced drop of blood glucose concentration during fasting exercise. In the posttest blood glucose concentration was well maintained within the initial hour of exercise in both groups. However, such a training effect was not found during the second hour as blood glucose dropped in CHO, yet was stable in F. Because glucose fluxes across muscle and liver were not measured, our present data do not allow us to explain the mechanisms contributing to this facilitated blood glucose homeostasis in F. Following an overnight fast liver glycogen store is largely depleted, which makes glucose production largely dependent on gluconeogenesis (52, 54). It is thus reasonable to speculate that regular exercise in the fasted state may stimulate adaptations in liver to facilitate glucose production via gluconeogenesis. Such a hypothesis is also supported by our observation that F improved maintenance of blood glucose concentration only in the later stage of exercise when liver glycogenolysis was unlikely still to significantly contribute to endogenous glucose production (52). In addition, exercise in the fasted state puts a higher overload on muscle gluconeogenesis because during exercise with carbohydrate intake high glucose delivery into the circulation originating from intestinal absorption makes glucoregulation via endogenous glucose production largely redundant (40).
It is important to also consider that absolute training intensity and duration were identical between the two experimental groups. Thus our findings indicate that fasting training facilitates metabolic adaptations resulting from a given amount of endurance training. On the other hand, one should probably also consider the possibility that consistent carbohydrate intake in endurance training sessions obviously can allow for higher training intensities and durations to be performed, which is another logical strategy to stimulate training adaptations.
In conclusion, our present findings clearly demonstrate that consistent exercise training in the fasted state markedly stimulates the contribution of IMCL to energy provision during fasting endurance exercise. Fasting training also increases muscular oxidative capacity more than a similar intensity and duration of exercise with ample exogenous carbohydrate supply. In addition, training in the fasted state prevents drop of blood glucose concentration during fasting exercise. Our present findings therefore provide evidence to indicate that regular fasted training is a useful strategy to stimulate physiological adaptations in muscle that may eventually contribute to improve endurance exercise performance.
GRANTS
This study was supported by Grant OT/05/53 from the Katholieke Universiteit Leuven and Grant G.0233.05 F from the Fund for Scientific Research-Flanders, Belgium (F.W.O.-Vlaanderen).
DISCLOSURES
No conflicts of interest, financial or otherwise, are declared by the author(s).
ACKNOWLEDGMENTS
We thank all subjects for participating in this study. We also thank Koen Pelgrim, Jonas Vanbekbergen, and Bart Vanden Eynde for assistance in supervising the training sessions and in performing the exercise tests. Joke Puype and Roel Vlaeyen helped with the biochemical assays.
REFERENCES
- 1. Achten J, Gleeson M, Jeukendrup AE. Determination of the exercise intensity that elicits maximal fat oxidation. Med Sci Sports Exerc 34: 92–97, 2002 [DOI] [PubMed] [Google Scholar]
- 2. Ahlborg G, Felig P, Hagenfeldt L, Hendler R, Wahren J. Substrate turnover during prolonged exercise in man: splanchnic and leg metabolism of glucose, free fatty acids, and amino acids. J Clin Invest 53: 1080–1090, 1974 [DOI] [PMC free article] [PubMed] [Google Scholar]
- 3. Akerstrom TCA, Birk JB, Klein DK, Erikstrup C, Plomgaard P, Pedersen BK, Wojtaszewski JF. Oral glucose ingestion attenuates exercise-induced activation of 5′-AMP-activated protein kinase in human skeletal muscle. Biochem Biophys Res Commun 342: 949–955, 2006 [DOI] [PubMed] [Google Scholar]
- 4. Akerstrom TCA, Fischer CP, Plomgaard P, Thomsen C, van Hall G, Pedersen BK. Glucose ingestion during endurance training does not alter adaptation. J Appl Physiol 106: 1771–1779, 2009 [DOI] [PubMed] [Google Scholar]
- 5. Alsted TJ, Nybo L, Schweiger M, Fledelius C, Jacobsen P, Zimmermann R, Zechner R, Kiens B. Adipose triglyceride lipase in human skeletal muscle is upregulated by exercise training. Am J Physiol Endocrinol Metab 296: E445–E453, 2009 [DOI] [PubMed] [Google Scholar]
- 6. Arkinstall MJ, Bruce CR, Nikolopoulos V, Garnham AP, Hawley JA. Effect of carbohydrate ingestion on metabolism during running and cycling. J Appl Physiol 91: 2125–2134, 2001 [DOI] [PubMed] [Google Scholar]
- 7. Bergman BC, Butterfield GE, Wolfel EE, Casazza GA, Lopaschuk GD, Brooks GA. Evaluation of exercise and training on muscle lipid metabolism. Am J Physiol Endocrinol Metab 276: E106–E117, 1999 [DOI] [PubMed] [Google Scholar]
- 8. Burke LM, Angus DJ, Cox GR, Cummings NK, Febbraio MA, Gawthorn K, Hawley JA, Minehan M, Martin DT, Hargreaves M. Effect of fat adaptation and carbohydrate restoration on metabolism and performance during prolonged cycling. J Appl Physiol 89: 2413–2421, 2000 [DOI] [PubMed] [Google Scholar]
- 9. Cameron-Smith D, Burke LM, Angus DJ, Tunstall RJ, Cox GR, Bonen A, Hawley JA, Hargreaves M. A short-term, high-fat diet up-regulates lipid metabolism and gene expression in human skeletal muscle. Am J Clin Nutr 77: 313–318, 2003 [DOI] [PubMed] [Google Scholar]
- 10. Civitarese AE, Hesselink MKC, Russell AP, Ravussin E, Schrauwen P. Glucose ingestion during exercise blunts exercise-induced gene expression of skeletal muscle fat oxidative genes. Am J Physiol Endocrinol Metab 289: E1023–E1029, 2005 [DOI] [PubMed] [Google Scholar]
- 11. Cluberton LJ, McGee SL, Murphy RM, Hargreaves M. Effect of carbohydrate ingestion on exercise-induced alterations in metabolic gene expression. J Appl Physiol 99: 1359–1363, 2005 [DOI] [PubMed] [Google Scholar]
- 12. Coggan AR, Swanson SC, Mendenhall LA, Habash DL, Kien CL. Effect of endurance training on hepatic glycogenolysis and gluconeogenesis during prolonged exercise in men. Am J Physiol Endocrinol Metab 268: E375–E383, 1995 [DOI] [PubMed] [Google Scholar]
- 13. Cox GR, Clark SA, Cox AJ, Halson SL, Hargreaves M, Hawley JA, Jeacocke N, Snow RJ, Yeo WK, Burke LM. Daily training with high carbohydrate availability increases exogenous carbohydrate oxidation during endurance cycling. J Appl Physiol 109: 126–134, 2010 [DOI] [PubMed] [Google Scholar]
- 14. Coyle EF, Coggan AR, Hemmert MK, Ivy JL. Muscle glycogen utilization during prolonged strenuous exercise when fed carbohydrate. J Appl Physiol 61: 165–172, 1986 [DOI] [PubMed] [Google Scholar]
- 15. Coyle EF, Hagberg JM, Hurley BF, Martin WH, Ehsani AA, Holloszy JO. Carbohydrate feeding during prolonged strenuous exercise can delay fatigue. J Appl Physiol 55: 230–235, 1983 [DOI] [PubMed] [Google Scholar]
- 16. De Bock K, Derave W, Ramaekers M, Richter EA, Hespel P. Fiber type-specific muscle glycogen sparing due to carbohydrate intake before and during exercise. J Appl Physiol 102: 183–188, 2007 [DOI] [PubMed] [Google Scholar]
- 17.De Bock K, Richter EA, Russell AP, Eijnde BO, Derave W, Ramaekers M, Koninckx E, Leger B, Verhaeghe J, Hespel P. Exercise in the fasted state facilitates fibre type-specific intramyocellular lipid breakdown and stimulates glycogen resynthesis in humans. J Physiol 564: 649–660, 2005 [DOI] [PMC free article] [PubMed] [Google Scholar]
- 18. De Bock K, Derave W, Eijnde BO, Hesselink MKC, Koninckx E, Rose AJ, Schrauwen P, Bonen A, Richter EA, Hespel PJ. Effect of training in the fasted state on metabolic responses during exercise with carbohydrate intake. J Appl Physiol 104: 1045–1055, 2008 [DOI] [PubMed] [Google Scholar]
- 19. den Hoed M, Hesselink MKC, van Kranenburg GPJ, Westerterp KR. Habitual physical activity in daily life correlates positively with markers for mitochondrial capacity. J Appl Physiol 105: 561–568, 2008 [DOI] [PubMed] [Google Scholar]
- 20. Dyck DJ, Putman CT, Heigenhauser GJ, Hultman E, Spriet LL. Regulation of fat-carbohydrate interaction in skeletal muscle during intense aerobic cycling. Am J Physiol Endocrinol Metab 265: E852–E859, 1993 [DOI] [PubMed] [Google Scholar]
- 21. Febbraio MA, Chiu A, Angus DJ, Arkinstall MJ, Hawley JA. Effects of carbohydrate ingestion before and during exercise on glucose kinetics and performance. J Appl Physiol 89: 2220–2226, 2000 [DOI] [PubMed] [Google Scholar]
- 22. Geor RJ, Hinchcliff KW, Sams RA. Glucose infusion attenuates endogenous glucose production and enhances glucose use of horses during exercise. J Appl Physiol 88: 1765–1776, 2000 [DOI] [PubMed] [Google Scholar]
- 23. Goedecke JH, Christie C, Wilson G, Dennis SC, Noakes TD, Hopkins WG, Lambert EV. Metabolic adaptations to a high-fat diet in endurance cyclists. Metabolism 48: 1509–1517, 1999 [DOI] [PubMed] [Google Scholar]
- 24. Hansen AK, Fischer CP, Plomgaard P, Andersen JL, Saltin B, Pedersen BK. Skeletal muscle adaptation: training twice every second day vs. training once daily. J Appl Physiol 98: 93–99, 2005 [DOI] [PubMed] [Google Scholar]
- 25. Hargreaves M, Briggs CA. Effect of carbohydrate ingestion on exercise metabolism. J Appl Physiol 65: 1553–1555, 1988 [DOI] [PubMed] [Google Scholar]
- 26. Hargreaves M, McConell G, Proietto J. Influence of muscle glycogen on glycogenolysis and glucose uptake during exercise in humans. J Appl Physiol 78: 288–292, 1995 [DOI] [PubMed] [Google Scholar]
- 27. Havemann L, West SJ, Goedecke JH, Macdonald IA, St, Clair GA, Noakes TD, Lambert EV. Fat adaptation followed by carbohydrate loading compromises high-intensity sprint performance. J Appl Physiol 100: 194–202, 2006 [DOI] [PubMed] [Google Scholar]
- 28. Hawley JA, Tipton KD, Millard-Stafford ML. Promoting training adaptations through nutritional interventions. J Sports Sci 24: 709–721, 2006 [DOI] [PubMed] [Google Scholar]
- 29. Helge JW, Kiens B. Muscle enzyme activity in humans: role of substrate availability and training. Am J Physiol Regul Integr Comp Physiol 272: R1620–R1624, 1997 [DOI] [PubMed] [Google Scholar]
- 30. Helge JW, Richter EA, Kiens B. Interaction of training and diet on metabolism and endurance during exercise in man. J Physiol 492: 293–306, 1996 [DOI] [PMC free article] [PubMed] [Google Scholar]
- 31. Helge JW, Watt PW, Richter EA, Rennie MJ, Kiens B. Fat utilization during exercise: adaptation to a fat-rich diet increases utilization of plasma fatty acids and very low density lipoprotein-triacylglycerol in humans. J Physiol 537: 1009–1020, 2001 [DOI] [PMC free article] [PubMed] [Google Scholar]
- 32. Helge JW, Wulff B, Kiens B. Impact of a fat-rich diet on endurance in man: role of the dietary period. Med Sci Sports Exerc 30: 456–461, 1998 [DOI] [PubMed] [Google Scholar]
- 33. Helge JW, Dela F. Effect of training on muscle triacylglycerol and structural lipids: a relation to insulin sensitivity? Diabetes 52: 1881–1887, 2003 [DOI] [PubMed] [Google Scholar]
- 34. Hespel P, Richter EA. Mechanism linking glycogen concentration and glycogenolytic rate in perfused contracting rat skeletal muscle. Biochem J 15: 777–780, 1992 [DOI] [PMC free article] [PubMed] [Google Scholar]
- 35. Horowitz JF, Mora-Rodriguez R, Byerley LO, Coyle EF. Lipolytic suppression following carbohydrate ingestion limits fat oxidation during exercise. Am J Physiol Endocrinol Metab 273: E768–E775, 1997 [DOI] [PubMed] [Google Scholar]
- 36. Howlett K, Angus D, Proietto J, Hargreaves M. Effect of increased blood glucose availability on glucose kinetics during exercise. J Appl Physiol 84: 1413–1417, 1998 [DOI] [PubMed] [Google Scholar]
- 37. Hulston CJ, Venables MC, Mann CH, Martin C, Philp A, Baar K, Jeukendrup AE. Training with low muscle glycogen enhances fat metabolism in well-trained cyclists. Med Sci Sports Exerc 42: 2046–2055, 2010 [DOI] [PubMed] [Google Scholar]
- 38. Hultman E. Fuel selection, muscle fibre. Proc Nutr Soc 54: 107–121, 1995 [DOI] [PubMed] [Google Scholar]
- 39. Jeukendrup AE, Raben A, Gijsen A, Stegen JH, Brouns F, Saris WH, Wagenmakers AJ. Glucose kinetics during prolonged exercise in highly trained human subjects: effect of glucose ingestion. J Physiol 515: 579–589, 1999 [DOI] [PMC free article] [PubMed] [Google Scholar]
- 40. Jeukendrup AE, Wagenmakers AJ, Stegen JH, Gijsen AP, Brouns F, Saris WH. Carbohydrate ingestion can completely suppress endogenous glucose production during exercise. Am J Physiol Endocrinol Metab 276: E672–E683, 1999 [DOI] [PubMed] [Google Scholar]
- 41. Lowry OH, Passoneau JV. A Flexible System of Enzymatic Analysis. New York: Academic, 1972 [Google Scholar]
- 42. McConell G, Snow RJ, Proietto J, Hargreaves M. Muscle metabolism during prolonged exercise in humans: influence of carbohydrate availability. J Appl Physiol 87: 1083–1086, 1999 [DOI] [PubMed] [Google Scholar]
- 43. Morton JP, Croft L, Bartlett JD, MacLaren DPM, Reilly T, Evans L, McArdle A, Drust B. Reduced carbohydrate availability does not modulate training-induced heat shock protein adaptations but does upregulate oxidative enzyme activity in human skeletal muscle. J Appl Physiol 106: 1513–1521, 2009 [DOI] [PubMed] [Google Scholar]
- 44. Nybo L, Pedersen K, Christensen B, Aagaared P, Brandt N, Kiens B. Impact of carbohydrate supplementation during endurance training on glycogen storage and performance. Acta Physiol 197: 117–127, 2009 [DOI] [PubMed] [Google Scholar]
- 45. Odland LM, Heigenhauser GJ, Wong D, Hollidge-Horvat MG, Spriet LL. Effects of increased fat availability on fat-carbohydrate interaction during prolonged exercise in men. Am J Physiol Regul Integr Comp Physiol 274: R894–R902, 1998 [DOI] [PubMed] [Google Scholar]
- 46. Odland LM, Heigenhauser GJF, Spriet LL. Effects of high fat provision on muscle PDH activation and malonyl-CoA content in moderate exercise. J Appl Physiol 89: 2352–2358, 2000 [DOI] [PubMed] [Google Scholar]
- 47. Peronnet F, Massicotte D. Table of nonprotein respiratory quotient: an update. Can J Sport Sci 16: 23–29, 1991 [PubMed] [Google Scholar]
- 48. Spencer MK, Yan Z, Katz A. Carbohydrate supplementation attenuates IMP accumulation in human muscle during prolonged exercise. Am J Physiol Cell Physiol 261: C71–C76, 1991 [DOI] [PubMed] [Google Scholar]
- 49. Stannard SR, Buckley AJ, Edge JA, Thompson MW. Adaptations to skeletal muscle with endurance exercise training in the acutely fed versus overnight-fasted state. J Sci Med Sport 13: 465–469, 2010 [DOI] [PubMed] [Google Scholar]
- 50. Stellingwerff T, Spriet LL, Watt MJ, Kimber NE, Hargreaves M, Hawley JA, Burke LM. Decreased PDH activation and glycogenolysis during exercise following fat adaptation with carbohydrate restoration. Am J Physiol Endocrinol Metab 290: E380–E388, 2006 [DOI] [PubMed] [Google Scholar]
- 51. van Loon LJ, Koopman R, Stegen JH, Wagenmakers AJ, Keizer HA, Saris WH. Intramyocellular lipids form an important substrate source during moderate intensity exercise in endurance-trained males in a fasted state. J Physiol 553: 611–625, 2003 [DOI] [PMC free article] [PubMed] [Google Scholar]
- 52. Wasserman DH, Cherrington AD. Hepatic fuel metabolism during muscular work: role and regulation. Am J Physiol Endocrinol Metab 260: E811–E824, 1991 [DOI] [PubMed] [Google Scholar]
- 53. Watt MJ, Krustrup P, Secher NH, Saltin B, Pedersen BK, Febbraio MA. Glucose ingestion blunts hormone-sensitive lipase activity in contracting human skeletal muscle. Am J Physiol Endocrinol Metab 286: E144–E150, 2004 [DOI] [PubMed] [Google Scholar]
- 54. Winder WW, Terry ML, Mitchell VM. Role of plasma epinephrine in fasted exercising rats. Am J Physiol Regul Integr Comp Physiol 248: R302–R307, 1985 [DOI] [PubMed] [Google Scholar]
- 55. Yeo WK, Paton CD, Garnham AP, Burke LM, Carey AL, Hawley JA. Skeletal muscle adaptation and performance responses to once a day versus twice every second day endurance training regimens. J Appl Physiol 105: 1462–1470, 2008 [DOI] [PubMed] [Google Scholar]