

SUMMARY
We have developed genetically encoded fluorescent sensors for reduced nicotinamide adenine dinucleotide (NADH), which manifest a large change in fluorescence upon NADH binding. We demonstrate the utility of these sensors in mammalian cells by monitoring the dynamic changes in NADH levels in subcellular organelles as affected by NADH transport, glucose metabolism, electron transport chain function, and redox environment, and we demonstrate the temporal separation of changes in mitochondrial and cytosolic NADH levels with perturbation. These results support the view that cytosolic NADH is sensitive to environmental changes, while mitochondria have a strong tendency to maintain physiological NADH homeostasis. These sensors provide a very good alternative to existing techniques that measure endogenous fluorescence of intracellular NAD(P)H and, owing to their superior sensitivity and specificity, allow for the selective monitoring of total cellular and compartmental responses of this essential cofactor.
INTRODUCTION
Reduced nicotinamide adenine dinucleotide (NADH) and its oxidized form, NAD+, are the most important coenzymes found in all living cells. They participate and play critical roles in multiple biological processes, including energy metabolism, mitochondrial function, biosynthesis, gene expression, calcium homeostasis, cell death, aging, and carcinogenesis (Eto et al., 1999; Kasischke et al., 2004; Lin and Guarente, 2003; Rutter et al., 2001; Vemuri et al., 2007; Vlassenko et al., 2006; Zhang et al., 2002, 2006). There are a few accepted methods for assaying NADH in vitro, including capillary electrophoresis (Xie et al., 2009), high-performance liquid chromatography (Yang et al., 2007), and a conventional enzymatic cycling assay (Zhang et al., 2002, 2006). To monitor intracellular NADH levels, researchers have utilized methods and instrumentation for imaging its weak endogenous fluorescence by single-photon or dual-photon excitation (Kasischke et al., 2004; Patterson et al., 2000; Skala et al., 2007); however, these methods have the drawbacks of low sensitivity and cell injury resulting from the ultraviolet irradiation. In addition, there is no way to distinguish between NADH and reduced nicotinamide adenine dinucleotide phosphate (NADPH), as they have similar fluorescent properties but distinct functions in cells.
Recently, investigators have developed genetically encoded fluorescent biosensors by fusing sensitive protein domains with circularly permuted fluorescent proteins (cpFPs) for monitoring various intracellular events (Belousov et al., 2006; Berg et al., 2009; Nagai et al., 2004; Wang et al., 2008b). In these cpFPs, the original amino and carboxyl termini are fused by a polypeptide linker, and new termini are formed close to the fluorophore, making its fluorescence highly sensitive to the intramolecular microenvironment. In different organisms from bacteria to mammals, cells developed transcription factors that directly sense intracellular NADH concentrations (McLaughlin et al., 2010; Rutter et al., 2001; Zhang et al., 2002, 2006). Among them, the bacterial protein Rex is specifically sensitive to NADH. Crystallographic studies of the Rex dimer showed that NADH binding induces a dramatic transition from an open to a closed form (McLaughlin et al., 2010; Wang et al., 2008a). To overcome the disadvantages of existing methods, we have developed genetically encoded sensors for monitoring intracellular NADH in living cells that exploit the properties of these two proteins, cpFP and Rex. These sensors, denoted Frex and FrexH, consist of circularly permuted yellow fluorescent protein (cpYFP) inserted into a tandem dimer of Bacillus subtilis Rex protein. The sensors demonstrate highly specific affinity for NADH and do not respond to NADH analogs, including NADPH. We demonstrate the utility of Frex in mammalian cells on monitoring changes in NADH levels, including changes in subcellular organelles, as affected by NADH transport, glucose metabolism, electron transport, and redox regulation.
RESULTS
Generation of cpYFP-Based Fluorescent Sensors for NADH
In the present study, we first constructed three chimeras in which cpYFP is inserted between two Bacillus subtilis Rex subunits (Figure S1A). All three fusion proteins expressed in E. coli were fluorescent, while only one of them showed a marked change of fluorescence in the presence of NADH. This sensor, NS2 (NADH Sensor 2), is a fusion of a complete Rex monomer, cpYFP, and the NADH-binding domain of Rex (Figures 1A and 1B). We found that direct incubation of NADH with purified NS2 decreased its fluorescence emission at 528 nm upon excitation at 485 nm and increased its fluorescence upon excitation at 390 nm, leading to a 55% increase in the ratio of fluorescence emission intensity with excitation at 390 nm and 485 nm (Figures S1B and S1C). In order to maximize the magnitude of the response of NS2 fluorescence to NADH binding, we created a series of truncated variants, targeting residues involved in the linker between Rex and cpYFP (Figure S1D). Two truncated variants had a dramatic increase (C3) or decrease (C8) in fluorescence intensity when excited at 485 nm in response to NADH (Figure S1D).
Figure 1. Properties of the Genetically Encoded NADH Sensor Frex.
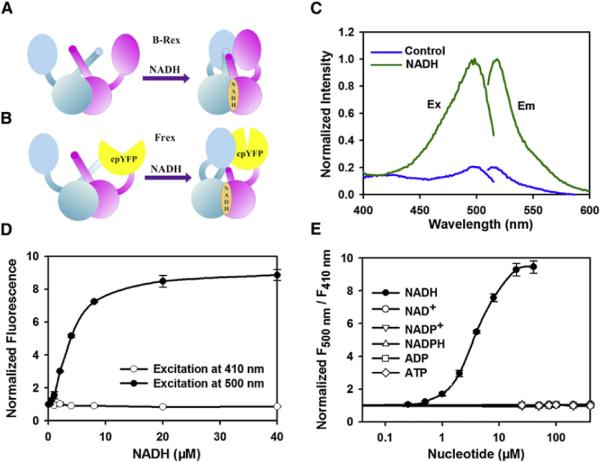
(A) Model for NADH sensing by the Rex homo-dimer. NADH binding induces conformational changes, which bring the N-terminal DNA binding domains together.
(B) Design of Frex, which is a fusion of a complete Rex monomer, cpYFP, and the NADH-binding domain of a second Rex molecule. The fluorescence of cpYFP is highly sensitive to the conformational changes induced by NADH.
(C) Fluorescence spectra of purified Frex. Excitation spectrum recorded at an emission wavelength of 530 nm has two maxima at 420 nm and 500 nm. Emission spectrum recorded at an excitation wavelength of 498 nm has a maximum at 518 nm.
(D) Fluorescence intensities with excitation at 410 nm or 500 nm normalized to the initial value; emission at 528 nm. Error bars represent SEM.
(E) The ratio of fluorescence intensities with excitation at 500 nm divided by 410 nm (F500 nm/F410 nm) in the presence of different concentrations of NADH and its analogs. Error bars represent SEM. See also Figure S1.
Native Rex proteins from B. subtilis have a high affinity for NADH (24 nM), but also bind to NAD+ and NADPH (Wang et al., 2008a), leading to the possibility that the sensors could be saturated under physiological levels of NADH or be affected by high concentrations of free NAD+ in the cell. To expand the dynamic range of NADH sensing and to increase the selectivity toward NADH versus its analogs NAD+ and NADPH, we screened 20 variants of the sensors with single site-directed mutagenesis of amino acid residues around the NADH binding pocket (Wang et al., 2008a) (Figures S1E and S1F). Among all of these encoded variants, C3L194E and C8N120E exhibited a 9-fold increase and 3-fold decrease in fluorescence with excitation at 500 nm upon NADH binding, respectively (Figures 1D and S1H), making them among the most responsive genetic sensors available to date. These sensors have typical excitation and emission spectra of the cpYFP-based genetically encoded sensors, with two excitation peaks around 421 nm and 500 nm and one emission peak at 518 nm (Figures 1C and S1G). Fluorescence titration studies showed that C3L194E had an apparent Kd for NADH of ~3.7 μM at pH 7.4, which increased to ~11 μM at pH 8.0 (Figures 1D, 1E, and S1K). The affinity of C8N120E for NADH is too high to be measured by fluorescence titration, and the Kd was determined to be ~40 nM by Bio-Layer Interferometry (data not shown), which is close to wild-type Bacillus subtilis Rex (Wang et al., 2008a). Both sensors are highly selective toward NADH, showing no apparent fluorescence changes in the presence of NADH analogs, e.g., NAD+, NADPH, or NADP+ (Figures 1E and S1I). As all other genetically encoded sensors based on circular permuted fluorescent proteins (Belousov et al., 2006; Berg et al., 2009; Nakai et al., 2001), the fluorescence of Frex is also sensitive to pH (Figure S1J.). Frex and cpYFP have very similar pH responses. Thus, the effect of pH on NADH determinants can be corrected when Frex fluorescence is normalized by cpYFP fluorescence measured in parallel experiments (Figure S1J). Overall, these data show that C3L194E and C8N120E are highly selective, highly responsive, ratiometric genetically encoded sensors for NADH, and we therefore termed them Frex (fluorescent Rex) and FrexH (Frex of high affinity), respectively. These sensors were used for all subsequent experiments, as their ratiometric properties provide a great advantage for intracellular imaging and detection.
Subcellular Distribution and Transport of NADH in Mammalian Cells
To test the ability of Frex to report changes in intracellular NADH levels, we subcloned it into a mammalian expression vector and expressed it in 293FT cells. Fluorescence was uniform throughout the cell, excluding the nucleus, indicating cytosolic localization (Figure 2A). When measured with a fluorescence plate reader with dual excitation, the ratio of fluorescence intensities with excitation at 500 nm divided by that at 410 nm was very similar to that observed in purified, unliganded Frex (Figure 2B), suggesting that cytosolic NADH concentration is extremely low. However, when the high-affinity FrexH was expressed in the cells, the ratio of fluorescence intensities suggested that ~76% of FrexH proteins were occupied by NADH (Figure 2B), reflecting a cytosolic NADH level of ~0.13 μM.
Figure 2. Subcellular Distribution and Transport of NADH in Mammalian Cells.

(A) Ratiometric fluorescence images of cells expressing Frex in mitochondria, nucleus, and cytosol. The pixel-by-pixel ratios of the 488 nm excitation image by the 405 nm excitation image of the same cell were used to pseudocolor the images. Scale bar, 10 μm.
(B) Normalized ratio of Frex and FrexH fluorescence excited at 500 nm to that at 410 nm in living cells and measured in vitro with a fluorescence plate reader in the presence or absence of 40 μM or 10 μM NADH, respectively. Error bars represent SEM.
(C and D) Fluorescence response of Frex with excitation at 485 nm in 293FT cells treated with exogenous NADH. Fluorescence was measured immediately after NADH addition (C), or the fluorescence intensity was followed over time (D). Error bars represent SEM.
(E) Fluorescence response of Frex excited at 485 nm in digitonin-permeabilized cells. Error bars represent SEM.
(F) Effects of P2X7R inhibitor PPADS on exogenous NADH-induced fluorescence changes of Frex in the cytosol. Error bars represent SEM.
(G) Ratiometric measurement of Frex-Mit or C3L194K-Mit fluorescence by fluorescence microscopy using a stable light source and EMCCD. Error bars represent SD.
(H and I) Fluorescence response of Frex-Mit to exogenous NADH in the absence of glucose. Fluorescence was measured 60 min after NADH addition (H), or the fluorescence intensity was followed over time (I). Error bars represent SEM. All experiments were performed in 293FT cells. Fluorescence intensities were normalized to that of resting cells (B–I). See also Figure S2.
Addition of exogenous NADH into the culture medium induced an immediate, dose-dependent, and saturable increase of fluorescence intensity with excitation at 485 nm in different cell lines, which gradually returned to basal levels as the extracellular NADH was consumed, whereas addition of much higher concentrations of NAD+ and NADPH had no effect on fluorescence (Figures 2C, 2D, S2B–S2D, and S2H). The total NAD+:NADH pool in the cells increased by about 25% when cells were treated with (extracellular) NADH (Figure S2I), whereas cellular NADH increased 90% as measured by FACS. These data are consistent with membrane transport of NADH. When the high-affinity FrexH sensor was used instead, similar results were obtained, suggesting NADH is readily transported across the plasma membrane (Figure S2F). The results using Frex show that NADH can be transported across the plasma membrane of cells with an apparent Km in micromolar range (Figure 2C). In contrast, in the cells expressing cpYFP instead of Frex, there were no fluorescence changes when NADH was added to the cell culture medium (Figure S2A), thereby excluding the possibilities of interference of fluorescence emission due to pH variations or redox state of the cpYFP domain. Moreover, we found that Frex displayed the same dramatic response to exogenous NADH in digitonin-permeabilized cells as that of the purified protein (Figure 2E). Digitonin permeabilization alone caused a slight decrease of fluorescence intensity with excitation at 485 nm, which may due to leak of cytosolic NADH into the extracellular environment. The level of cytosolic NADH was estimated to be ~0.12 μM according to a digitonin permeabilization assay of Frex-expressing cells(Figures 2E), which was very similar to the results measured by the FrexH sensor. P2X7R is the only known transporter that may be involved in NADH transport across the plasma membrane (Lu et al., 2007); however, we found that the P2X7R inhibitor PPADS did not affect the entry of NADH into cells (Figure 2F), suggesting that some other mechanism is involved in the high-affinity transport of NADH into the cells. Collectively, these results indicate that Frex can distinguish NADH from its analogs and displays superior specificity and responsiveness in living cells.
We also tagged organelle-specific signal peptides to Frex to direct its expression in the nucleus and mitochondria in order to understand better the subcellular distribution of NADH in mammalian cells (Figure 2A). The nuclear NADH level in resting cells or cells treated with NADH and its analogs was similar to that of cytosol (Figures 2A, S2A, and S2G), as NADH diffuses freely between these two compartments. When targeted to mitochondria, however, the ratio of fluorescence intensities of Frex with excitation at 500 nm to excitation at 410 nm was much higher than untagged Frex localized in the cytosol. After carefully calibrating the effect of pH on the fluorescence of Frex (Figures 2G, S1J, and S1K), we were able to quantify the free NADH level in the mitochondria of living cells by ratiometric fluorescence imaging of the Frex sensor (Figure 2G) and by comparing Frex-Mit fluorescence in living cells to that of cell lysates in 0.3% digitonin (pH 8.0) (Figure S2J). These results suggested that in mitochondria of untreated 293FT cells, the Frex-Mit sensor was ~70%–75% (Figures 2G and S2J) saturated by NADH. The free NADH level in the mitochondrial matrix was determined to be 33 ± 9 μM and 26 ± 7 μM, respectively, by these two methods. In contrast, a lower-affinity sensor, C3L194K (Kd ~50 μM) (Figure S1K), was ~35% saturated in the mitochondrial matrix, suggesting a free NADH level in the mitochondrial matrix of 27 ± 5 μM. As the binding sites of Frex-Mit were largely occupied by NADH in mitochondria, its fluorescence remained relatively constant when low concentrations of exogenous NADH were added to cell culture (Figure S2E); however, in energy-stressed cells in which glucose was removed from the medium, exogenous NADH addition led to a marked yet slow increase in mitochondrial NADH level (Figures 2H and 2I).
Inhibition of Respiratory Chain Complex II Oxidizes Mitochondrial NADH
NADH is produced during glycolysis and via the tricarboxylic acid (TCA) cycle. At the mitochondrial inner membrane, electrons from NADH and succinate pass through the electron transport chain to oxygen to drive the synthesis of ATP. By employing different inhibitors, we next examined the role that different mitochondrial complexes play in the metabolic balance of mitochondrial NADH:NAD+. It was surprising that the complex II inhibitor, 3-NP, dose-dependently decreased mitochondrial NADH levels, as indicated by the decrease of fluorescence intensities of Frex-Mit with excitation at 485 nm (Figures 3A–3D and S3A). The cells expressing cpYFP-Mit instead of Frex-Mit showed no significant fluorescence changes during 3-NP treatment (Figures 3C, 3D, and S3B). Other mitochondrial inhibitors may induce pH variation in the mitochondrial matrix, which interfere with the NADH measurement using a Frex sensor. In these cases, we normalized Frex-Mit fluorescence with cpYFP-Mit fluorescence measured in parallel experiments. The results showed that the complex I, III, and IV inhibitors modestly increased Frex-Mit fluorescence, consistent with the increase of endogenous NADH fluorescence (Figures 3A, S3C, and S3D). The oxygen consumption of 293FT cells was fully inhibited by rotenone and other mitochondrial inhibitors (Figure S3E), suggesting that these cells have a functional electron transport chain and are respiring.
Figure 3. Inhibition of Respiratory Chain Complex II Oxidizes Mitochondrial NADH.

(A) Effect of different mitochondrial oxidative phosphorylation complex inhibitors on the fluorescence of Frex-Mit and C3L194K-Mit excited at 485 nm in 293FT cells. Cells were treated with inhibitors for 30 min. Frex-Mit and C3L194K-Mit fluorescence were corrected for pH effect by normalization with cpYFP-Mit fluorescence measured in parallel experiments. Error bars represent SEM.
(B) Respiratory chain complex II inhibitor 3-NP dose-dependently decreased Frex-Mit fluorescence, which is blocked by 5 μM complex I inhibitor rotenone. Cells were treated with inhibitors for 30 min. Fluorescence intensities were normalized to that of untreated cells. Error bars represent SEM.
(C) Confocal fluorescence image of Frex-Mit- or cpYFP-Mit-expressing cells before and 10 min after treatment with 3-NP. Image was pseudocolored with the ratio of the 488 nm excitation image to the 405 nm excitation images of the same cell. Scale bar, 10 μm.
(D) Kinetic course of averaged Frex-Mit and cpYFP-Mit ratio changes in the presence of 2 mM 3-NP measured by confocal microscopy. Error bars represent SD.
(E) FACS analysis fluorescence of 293FT cells expressing Frex-Mit in the absence of 3-NP (red) or in the presence of 3-NP (blue). Fluorescence was excited by a 488 nm (upper) or 405 nm (lower) laser. A band-pass 530/30 emission filter was used in both cases.
(F) FACS measurements of endogenous NAD(P)H fluorescence with excitation at 375 nm or Frex-Mit fluorescence with excitation at 488 nm. Cells were incubated with inhibitors for 30 min before measurements. See also Figure S3.
In many previous reports, rotenone as well as other mitochondrial inhibitors caused a marked increase of mitochondrial NADH. The relatively small changes of fluorescence of Frex-Mit induced by rotenone treatments is due to the fact that majority of Frex sensor molecules are already bound with NADH in the mitochondrial matrix of resting 293FT cells. The increase of mitochondrial NADH induced by different complex I, III, and IV inhibitors may be better visualized by a lower-affinity sensor, C3L194K, whose fluorescence when excited at 488 nm increased markedly when cells were treated with these inhibitors (Figure 3A). The complex I inhibitor, rotenone, essentially reversed 3-NP-induced mitochondrial NADH oxidation (Figure 3B). We also performed a dual excitation calibration of the Frex sensor in the mitochondria of transiently transfected cells using fluorescence-activated cell sorting (FACS), which also showed that the fluorescence intensity of Frex-Mit when excited at 488 nm decreased in the presence of 3-NP, while the fluorescence intensity of Frex-Mit when excited at 405 nm remained unchanged, indicating mitochondrial NADH oxidation (Figure 3E).
Consistent with the response of Frex fluorescence, the endogenous fluorescence of NAD(P)H measured by FACS using a 375 nm laser showed a modest decrease of NAD(P)H levels with different concentrations of 3-NP (Figure 3F). The mitochondrial uncoupler, carbonyl cyanide m-chlorophenylhydrazone (CCCP), also dose-dependently decreased Frex-Mit fluorescence and NAD(P)H endogenous fluorescence, which was largely reversed by the complex I inhibitor, rotenone (Figures S3F and S3H). These results are consistent with previous reports that mitochondrial NADH is oxidized during uncoupling electron transport from ATP synthesis (Eng et al., 1989; Mayevsky, 1976). CCCP also modestly decreased the fluorescence of cpYFP-Mit, indicating a decrease of pH during mitochondrial uncoupling (Figure S3G). Overall, these results show that Frex can be used as a sensitive sensor to monitor mitochondrial NADH dynamics, which is more specific than the conventional measurement of endogenous fluorescence of NAD(P)H.
NADH Levels in Subcellular Compartments Depend on Glucose, Pyruvate, and Lactate Transport and the Malate-Aspartate Shuttle
Glucose metabolism is generally believed to increase intracellular NADH levels (Eto et al., 1999; Patterson et al., 2000); however, these reports relied on the endogenous fluorescence assay that cannot distinguish between NADH and NADPH, both of which are produced during glucose catabolism. By measuring Frex and FrexH fluorescence in 293FT cells, we found that cytosolic NADH levels slightly increase immediately upon glucose supplementation in glucose-depleted cells (Figures 4C and 4D). By contrast, under these same experimental conditions, glucose had a marked effect on mitochondrial NADH levels. Glucose dose-dependently increased Frex-Mit fluorescence, whereas glucose also had a small yet slow effect on fluorescence in the cpYFP-Mit-expressing cells, suggesting a slight increase of pH during the 1 hr time course (Figures 4A and 4B). To correct the interference by pH change on NADH determinations, we normalized Frex-Mit fluorescence by cpYFP-Mit fluorescence measured in parallel experiments (Figures 4B). The results suggested that the glucose-induced increase of Frex-Mit fluorescence has a biphasic time course, e.g., a rapid phase reflecting an NADH increase over 10 min and a slow phase reflecting a pH increase over 1 hr. Michaelis-Menten fitting of mitochondria NADH level versus extracellular glucose concentration gave a K0.5 of ~0.16 mM, which is much lower than the KM for GLUT1, the high-affinity glucose transporter in the plasma membrane. By contrast, the K0.5 for cytosolic NADH level versus extracellular glucose concentration is ~1.5 mM (Figure 4C). These results suggest that the NADH level in mitochondria is very sensitive to low concentrations of glucose, with glucose uptake not the rate-limiting step; by contrast, the cytosolic NADH level responds to more physiologically and pathologically relevant fluctuations of glucose levels in the range of 1–25 mM.
Figure 4. Subcellular NADH Level Depends on Glucose Transport.
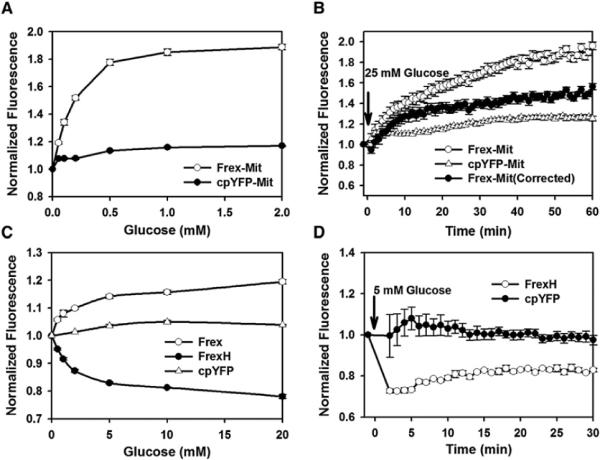
(A) Dose-dependent fluorescence response of Frex-Mit and cpYFP-Mit to different concentrations of glucose.
(B) Kinetics of fluorescence response of Frex-Mit and cpYFP-Mit after glucose supplementation. The solid symbol represents the fluorescence response of Frex-Mit corrected for pH effects.
(C) Dose-dependent fluorescence response of cytosolic Frex, FrexH, and cpYFP to different concentration of glucose.
(D) Kinetics of fluorescence response of the cytosolic FrexH and cpYFP in glucose-starved cells after glucose supplementation. Error bars represent SEM.
NADH generated by glycolysis may be transported into mitochondria and increase mitochondrial NADH level. Cytosolic NADH lacks direct access to the mitochondria (McKenna et al., 2006); however, it can enter the mitochondria via the malateaspartate shuttle. Aminooxyacetate (AOA) is a well-characterized inhibitor of the malate-aspartate shuttle (Eto et al., 1999). We found that AOA dose-dependently decreased the fluorescence intensity of Frex-Mit using a microplate reader and confocal microscopy (Figures 5A, 5C, S4A, and S4C), whereas no significant change of Frex fluorescence was detected (Figure S4B). When cells were treated with the complex I inhibitor, rotenone, however, AOA could no longer induce a decrease in mitochondrial NADH. Furthermore, inhibition of the malateaspartate shuttle can be directly visualized by the Frex probe, as AOA also significantly inhibited the increase in mitochondrial NADH concentration when cells were treated with exogenous NADH (Figures 5B). We also observed that AOA almost completely inhibited the glucose-induced increase in mitochondrial free NADH (Figure 5D). By contrast, AOA decreased FrexH fluorescence, suggesting an increase of cytosolic NADH level in the cells (Figure S4D). These data suggest that the malateaspartate shuttle plays an important role in supplying NADH to mitochondria in 293FT cells. In comparison, FACS measurement failed to reveal significant changes in the endogenous fluorescence of NAD(P)H in living cells treated with AOA (Figure S4E).
Figure 5. Mitochondrial NADH Level Decreased during Malate-Aspartate Shuttle Inhibition.
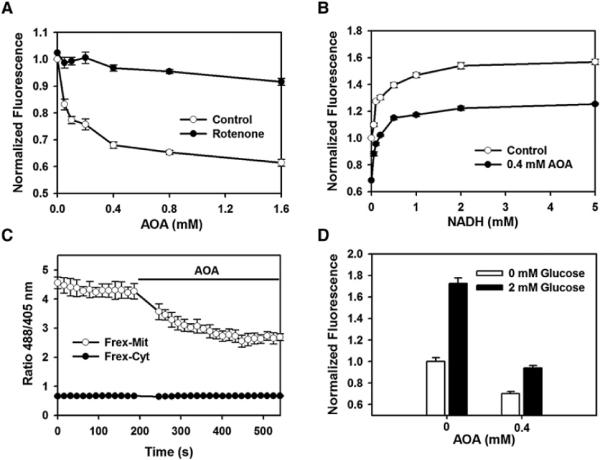
(A) Fluorescence response of Frex-Mit-expressing cells excited at 485 nm in the presence of different concentrations of the malate-aspartate shuttle inhibitor AOA. Rotenone blocked the decrease of mitochondrial NADH level induced by AOA. Cells were treated with inhibitors for 20 min. Error bars represent SEM.
(B) AOA blocked the entry of exogenous NADH into mitochondria. Fluorescence responses of glucose-starved, Frex-Mit-expressing cells excited at 485 nm were measured 60 min after addition of 0.4 mM AOA. Error bars represent SEM.
(C) Kinetic course of averaged Frex-Mit and Frex ratio changes in the presence of 0.4 mM AOA, measured by confocal microscopy. Error bars represent SD.
(D) AOA blocked the glucose-dependent increase of mitochondrial NADH. Frex-Mit fluorescence excited at 485 nm was measured 30 min after glucose supplementation. Error bars represent SEM. See also Figure S4.
In cytosol, it is generally believed that pyruvate and lactate are in equilibrium with cytosolic free NAD+ and NADH. It is interesting that there were biphasic responses of mitochondrial and cytosolic NADH levels to pyruvate, which is expected to shift the lactate dehydrogenase equilibrium toward NAD+. Exogenous pyruvate produced a rapid decrease in cytosolic NADH level, which then returned to baseline in 30 min, as shown by the fluorescence of FrexH sensors expressed in 293FT cells (Figures 6A and S5A). In comparison, the mitochondrial NADH level first decreased upon pyruvate addition, then recovered with overshooting during the 1 hr time course of the experiment (Figure 6B). This overshooting of NADH level may be explained by subsequent pyruvate catabolism via the TCA cycle in mitochondria. Compared to pyruvate, lactate induced a more rapid and significant increase of mitochondrial NADH level in glucose-starved cells, which was completely inhibited by AOA, the malate-aspartate shuttle inhibitor (Figures 6D and 6F). The enhancing effect of lactate on mitochondrial NADH was, however, absent in glucose-supplemented cells (Figure S5B). By contrast, lactate readily elevated cytosolic NADH in both glucose-supplemented cells and glucose-starved cells (Figures 6C and 6E). These data suggest that although pyruvate can enter the mitochondria and is utilized, lactate is a more rapid source of energy by delivering NADH to mitochondria via the malateaspartate shuttle, which is particularly important in energy-stressed conditions.
Figure 6. Differential Response of Mitochondrial and Cytosolic NADH Level to Pyruvate and Lactate Supplementation.

(A–D) All experiments were performed in 293FT cells. Fluorescence with excitation at 485 nm was normalized to that of untreated cells. Shown are time courses of fluorescence response of FrexH-and cpYFP-expressing cells when 100 μM pyruvate (A) or 1 mM lactate (C) was added to the cell culture medium in the absence of glucose and time courses of fluorescence response of Frex-Mit- and cpYFP-Mit-expressing cells when 1 mM pyruvate (B) or 1 mM lactate (D) was added to the cell culture medium in the absence of glucose.
(E) Dose-dependent response of cytosolic NADH level to different concentration of lactate, as measured by Frex and FrexH fluorescence.
(F) AOA blocked the lactate-induced increase of mitochondrial NADH as measured by fluorescence of Frex-Mit 30 min after addition of lactate to the cell culture medium in the absence of glucose. Error bars represent SEM. See also Figure S5.
Mitochondrial NADH Is Sensitive to Hydrogen Peroxide
The electron transport chain present in mitochondria has a potent side effect: the constant generation of reactive oxygen species (ROS), including O2− and H2O2 (Balaban et al., 2005). To determine whether ROS regulate mitochondrial redox metabolism, we analyzed the effects of H2O2 on intracellular NADH levels. We observed a moderate decrease of endogenous NAD(P)H fluorescence measured by FACS (Figure S6); however, it is possible that the decrease of endogenous NAD(P)H fluorescence reflects the consumption of NADPH by antioxidant enzymes, protecting the cells from the oxidative stress caused by H2O2. To understand better mitochondrial NADH levels under oxidative conditions, fluorescence measurements were preformed in Frex-Mit-expressing cells using a microplate reader, FACS, and confocal microscopy. We observed a marked decline in mitochondrial NADH upon addition of H2O2 as measured with Frex-Mit (Figures 7A–7D and S6); cpYFP-Mit had only modest florescence changes with 200 μM H2O2 treatment as assayed by confocal microscopy (Figures 7B and 7C). The oxidation of mitochondrial NADH induced by H2O2 was partially abolished by inhibition of complex I (Figures 7A and S6A). These data suggest a role for H2O2 in the regulation of mitochondrial NADH levels, in agreement with previous reports (Avi-Dor et al., 1962).
Figure 7. Mitochondrial NADH Level Is Sensitive to Hydrogen Peroxide.

(A) Frex-Mit-expressing cells excited at 485 nm in the presence of different concentrations of H2O2. Five micromolar rotenone partially blocked the decrease of Frex fluorescence. Cells were treated with H2O2 and rotenone for 10 min. Error bars represent SEM.
(B) Spatially resolved changes in the ratiometric fluorescence of Frex-Mit or cpYFP-Mit in sequential frames (left to right, 1 min per frame) in response to 200 μM H2O2. Ratios of the 488 nm excitation by the 405 nm excitation of the same pixel were used to pseudocolor the images. Scale bar, 10 μm.
(C) Kinetic course of averaged Frex-Mit and cpYFP-Mit ratio changes across the cells measured by confocal microscopy. Error bars represent SD.
(D) FACS analysis of Frex-Mit fluorescence of cells untreated (red) or treated with 200 μM H2O2 for 30 min (blue), with fluorescence excitation at 488 nm or 405 nm. See also Figure S6.
DISCUSSION
In this study, we report that Frex is a genetically encoded NADH sensor for living cell research. The high sensitivity and specificity of Frex toward NADH is based on the properties of B-Rex, which is a NADH-sensing transcription factor from Bacillus subtilis (Wang et al., 2008a). We mutated this bacterially derived NADH binding domain to expand its dynamic sensing range and to avoid nonspecific interactions of the probe with other related biochemical species in eukaryotic cells. As other genetically encoded sensors, Frex has the advantages of sensitivity, minimal perturbation, and targeting to subcellular organelles, allowing dynamic measurements in single living cells and even subcellular organelles.
Redox homeostasis plays a key role in the sustained metabolism and growth of prokaryotic and eukaryotic cells, and free NADH concentration is one of the most important redox parameters for normal cellular metabolism and signaling (Lin and Guarente, 2003). Studies show, for example, that the intracellular concentration of NADH is directly linked to carcinogenic potential, as cancer cells primarily use glycolysis for rapid growth and proliferation (DeBerardinis et al., 2008; Vander Heiden et al., 2009). In β cells of the pancreas, the NADH shuttle couples glycolysis with activation of mitochondrial energy metabolism to trigger insulin secretion (Eto et al., 1999). For many years, investigators have been indirectly assuming static cytosolic and mitochondria NADH concentrations according to the ratios of NAD+/NADH of ~700–1000 in cytosol and 7–8 in mitochondria (Stubbs et al., 1972; Williamson et al., 1967; Zhang et al., 2002). These ratios were also indirectly obtained by combining in vitro measurements of cell extracts and equilibrium considerations of the lactate dehydrogenase and β-hydroxybutyrate dehydrogenase systems; however, these estimations have been difficult to verify with precision. To monitor NADH in living cells and tissues, all current methods rely on the weak endogenous fluorescence of NADH and its phosphorylated analog NADPH (Kasimova et al., 2006; Zhang et al., 2002). These two coenzymes are regulated by different enzymatic pathways and have distinct physiological roles; however, their fluorescence spectra are indistinguishable.
In recent years, there have been a growing number of reports on studies of free NADH that were largely focused on time-resolved fluorescence (Blinova et al., 2005; Zhang et al., 2002), fluorescence anisotropy (Vishwasrao et al., 2005; Yu and Heikal, 2009), and fluorescence spectral decomposition analysis (Kasimova et al., 2006) measurements. The reported ratio of free/bound mitochondrial NADH varies significantly from 1.5:1 (Blinova et al., 2005) to 1:4 (Yu and Heikal, 2009) or even 0:1 (Wakita et al., 1995). These apparent discrepancies may reflect fundamental physiological differences between the role of free NADH in the mitochondria in their respective species and tissues (Kasimova et al., 2006). These techniques require sophisticated instrumentation and rigorous mathematical processing of the signal, and their utility and data interpretation in biological studies still need to be validated. An additional problem of note is that it is not possible to calibrate absolute mitochondrial NADH concentrations for comparison between different cells by measuring NAD(P)H fluorescence (Mayevsky and Rogatsky, 2007). The cytosolic NADH level is extremely low (Bücher et al., 1972; Stubbs et al., 1972; Williamson et al., 1967), and most of it is bound to protein (Bücher et al., 1972; Zhang et al., 2002). Even more important, its fluorescence signal is over-whelmed by that of its analog, NADPH. Thus, there is currently no method available to measure cytosolic NADH level in living cells. In contrast, Frex fluorescence is much more sensitive and specific for free NADH determination in cytosol, excluding interference from its biochemical analogs, e.g., NAD+, NADPH, and NADP+. Here, by monitoring Frex fluorescence, we were able to quantify NADH levels spatiotemporally in different subcellular organelles. Consistent with many reprints, mitochondrial free NADH concentrations are much higher than those of the cytosol and nucleus.
It had generally been thought that NADH cannot be transported across the cell plasma membrane. For example, recent work showed that NADH transport across the plasma membrane of HEK293 cells was not observable when measured using traditional methods, with a small increase in signal detected only when P2×7R protein was overexpressed and high concentrations of exogenous NADH were added to the medium (Lu et al., 2007). It is surprising that we were able to trace the transport of exogenous NADH across the plasma membrane readily in different cell lines using Frex as a probe, measuring NADH fluorescence, and by enzymatic cycling assay. Furthermore, we found the inhibitor of P2×7R is not able to inhibit transport of NADH across the plasma membrane, suggesting that some other mechanism is involved in the high-affinity transport of NADH into cells. Although these data suggest membrane transport of NADH, there remains the possibility that the NADH is also facilitating cytosol reduction via reducing equivalent transport across the plasma membrane. Further research is necessary to address this issue.
NADH plays a central role in mitochondrial respiration. We now show by Frex sensor that blocking the malate-aspartate shuttle or complex II leads to a decrease in mitochondrial NADH level, while complex I, III, and IV inhibitors increase mitochondrial NADH level. We also observed that under glucose-starved conditions, NADH, glucose, pyruvate, and lactate supplementation significantly increase mitochondrial free NADH; however, these effects were diminished when physiologically relevant concentrations of glucose were present. In comparison, cytosol NADH levels respond to the above conditions in both energy-stressed and unstressed cells. In addition, we also observed temporal separation of mitochondrial NADH and cytosolic NADH levels in different metabolic conditions. Exogenous NADH leads to an immediate increase in cytosolic and nuclear NADH levels, whereas transport of exogenous NADH into mitochondria occurred much more slowly than did that into the cytosol. In studies of inhibition of either the malate-aspartate shuttle or complex II and of glucose, pyruvate, or lactate supplementation, changes in mitochondrial NADH concentration took place after more than 5 min, while fluctuation of the NADH level in the cytosol occurred almost immediately. A temporal separation of the NAD(P)H response toward glucose was also observed in islet β cells, in which the mitochondrial signal was noticeably delayed (Patterson et al., 2000). Taken together, these results suggest that NADH concentration in the cytosol is sensitive to environmental changes, while mitochondria have a strong tendency to maintain physiological NADH homeostasis.
It should be noted that Frex sensors also have their own limitations. First, Frex is sensitive to pH; therefore, one should exercise caution under conditions that alter intracellular pH. The effect of changes in pH were not marked when the probes were expressed in the cytosol; however, when the probes were expressed in mitochondria where a wider range of pH variation may occur depending on the metabolic status, the Frex fluorescence signal should be corrected by cpYFP fluorescence measured in parallel experiments, by pH-sensitive dyes, or by red fluorescent proteins (Berg et al., 2009; Tantama et al., 2011). It is also possible to generate a dual-function, genetically encoded sensor by fusing the Frex sensor and the pH-sensitive red fluorescent protein (Tantama et al., 2011), which can be used to monitor free NADH and pH simultaneously. Second, Frex sensors will not permit the measurement of the NADH:NAD+ ratio. The NAD+ and NADH pools of cytosol and mitochondria are well separated. In the timescale of this study, it is unlikely that either of these pools changed. Therefore, we believe that the NADH:NAD+ ratio purely depends on the level of NADH. Ideally, of course, a sensor for NADH:NAD+ is desirable, which would be used much like the sensor for ATP/ADP (Berg et al., 2009). It may be used together with Frex probes to measure all three critical parameters, i.e., NADH, NAD+, and their ratio, simultaneously in the cells. We have mutants of Frex that can also bind and respond to NAD+; however, the magnitude of responses toward NAD+ is similar to that of NADH. Therefore, these mutants do not currently meet the requirements for measuring the NADH:NAD+ ratio. We are currently developing genetically encoded sensors for NADH:NAD+ ratio detection of appropriate characteristics. Once obtained, these sensors may be used together with Frex probes, making it possible to measure NADH, NAD+, and their ratios simultaneously in the cells.
Our results show that Frex is a powerful tool for investigating the effect of various stimuli on NADH in living cells. We believe that Frex provides a very good alternative to the measurement of the endogenous fluorescence of intracellular NAD(P)H, as it is highly specific, has a large change in fluorescence upon NADH binding, and can be targeted to different subcellular compartments. These properties make Frex compatible with high-throughput screening using microplate readers and flow cytometers. The ability to image cytosolic and nuclear NADH levels directly in real time could be very useful for better understanding of cellular signaling involving NADH, as many signal transduction and transcription regulation events involve NADH (Mintun et al., 2004; Rutter et al., 2001; Zhang et al., 2002, 2006). In addition to its use in basic research of multiple biological processes in which NADH plays a central role, Frex also has the potential to be used in drug discovery, as many enzymes that make and use NAD+ and NADH are important in pharmacology and disease pathobiology (Khan et al., 2007; Sauve, 2008).
EXPERIMENTAL PROCEDURES
Characterization of Frex In Vitro
We stored the purified protein at −20°C until experiments. Before experiments, we placed aliquots of purified sensor protein into a cuvette containing 100 mM phosphate-buffered saline (KPi buffer, pH 7.4). Fluorescence was measured using a Cary Eclipse spectrofluorimeter (Varian). After recording the initial fluorescence, we added various nucleotides into the reaction solution and recorded the spectrum immediately. For all excitation experiments, excitation and emission slits were set to 5 nm. Excitation spectra were recorded with an excitation range from 300 nm to 515 nm and an emission wavelength of 530 nm. Readings were taken every 1 nm with an integration time of 1 s, and the photomultiplier tube (PMT) voltage was set at 800 V. For emission spectra, the emission range was 510–600 nm, while the excitation wavelength was 498 nm. Other parameters were set as for excitation spectra. For nucleotide titration, the protein was diluted in 100 mM KPi buffer (pH 7.4) to a final concentration of 0.5 μM. The fluorescence value of Frex, in the absence of nucleotides, was measured by a Synergy Mx Monochromator-Based Multi-Mode microplate reader with 410 nm and 500 nm excitation and 528 nm emission or a filter-based Synergy 2 Multi-Mode microplate reader using 390 BP 10 nm (or 420 BP 10 nm), 485 BP 20 nm excitation, and 528 BP 20 nm emission band-pass filters (BioTek). The stock solution of nucleotides was also prepared in 100 mM KPi buffer (pH 7.4). Each assay was performed with 75 μl nucleotides and 75 μl protein in 96-well glass-bottom microplates (GE). Fluorescence intensity was measured immediately.
Cell Culture
293FT cells (Invitrogen) were maintained in DMEM (high glucose) supplemented with 10% FBS (Bovogen, Melbourne, Australia), 0.1 mM MEM nonessential amino acids, 6 mM L-glutamine, and 1 mM sodium pyruvate at 37°C in a humidified atmosphere of 95% air and 5% CO2. COS-7 and HEK293 cells were grown in DMEM with 10% FBS. Cells were plated in antibiotic-free high-glucose DMEM supplemented with 10% FBS 16 hr before transfection. We typically used 0.8 μg plasmids with 3.2 μl Lipofectamine 2000 for each well of a 12-well plate according to the manufacturer's protocol.
Fluorescence Microscopy
For confocal fluorescence microscopy, cells were plated on a 35 mm glass-bottom dish with phenol red-free fresh growth medium and observed 24–30 hr posttransfection. Frex was expressed in different subcellular compartments by tagging with organelle-specific signal peptides. Images were acquired using the Zeiss 710 laser scanning confocal microscopy (LSCM) system on a Zeiss Axio Observer Z1 inverted microscope. A Plan Apo 63 × 1.4 NA oil immersion objective was utilized. Cells were maintained at 37°C in a humidified atmosphere using a CO2 incubator (PeCon). We excited the biosensor sequentially line by line with the 405 nm (1.2% laser power) and 488 nm (2.6% laser power) laser line and with emission detection set to 500–550 nm. Scanning was performed using the “line mode,” 1024 × 1024 format, 12 bit depth, 2× line average, and 3.0 pinhole. Raw data were exported to ImageJ software as 12 bit TIF for analysis. The pixel-by-pixel ratio of the 488 nm excitation image by the 405 nm excitation image of the same cell was used to pseudocolor the images in HSB color space. Simply, the RGB value (255, 0, 255) represents the lowest ratio, and the red (255, 0, 0) represents the highest ratio, while the color brightness is proportional to the fluorescent signals in both channels. To assess the Frex and C3L194K sensor occupancy by NADH in mitochondria, we performed ratiometric fluorescence imaging of living cells and purified recombinant sensor proteins with or without NADH using a high-performance fluorescent microscopy system equipped with Nikon Eclipse Ti-E automatic microscope, Photometrics Evolve 512 EMCCD, and the highly stable Sutter Lambda XL light source. A Plan Apo VC 60 × 1.2 NA water immersion objective was utilized. For dual-excitation ratio imaging, 410 BP 20 nm, 480 BP 30 nm band-pass excitation filters and 535/40 emission filter altered by a Lambda 10-XL filter wheel (Shutter Instruments) were used. Images were captured using 512 × 512 format, 16 bit depth, and 100 ms exposure for both channels. For calibration, Frex and C3L194K protein were diluted into 100 mM KPi buffer with 0.1% bovine serum albumin (pH 8.0) to final concentrations of 0.1 μM and 0.3 μM, respectively.
Live-Cell Fluorescence Measurement Using Microplate Reader
293FT cells were harvested by trypsinization and counted by hemocytometer 24–48 hr after transfection. Cells were washed and suspended in PBS (HyClone), and aliquots of cells were incubated at 37°C with different drugs during the measurement. Fluorescence excited at 485 nm was measured by a Synergy 2 Multi-Mode Microplate Reader with excitation filter 485 BP 20 nm and emission filter 528 BP 20 nm. Dual-excitation ratios were obtained by a Synergy MX Multi-Mode Microplate Reader (BioTek) with 410 nm and 500 nm excitation and 528 nm emission for both excitation wavelengths. Fluorescence values were background corrected by subtracting the intensity of 293FT cell samples not expressing Frex. Unless otherwise indicated, 25 mM glucose was maintained in the buffer. Under our experimental conditions, the main contribution to background autofluorescence originated from the glass-bottom microplate rather than from cells.
Calibration of Intracellular NADH Levels
Intracellular NADH levels can be measured after calibration of Frex fluorescence in live cells with that of recombinant Frex protein. Ratiometric measurement of Frex fluorescence is possible for Frex expressed in cytosol or nucleus; however, it was difficult to measure accurately the weak fluorescence signal of 410 nm excitation of Frex sensor expressed in mitochondria by the microplate reader. There is some overlap of the 410 nm excitation with mitochondrial FAD autofluorescence, which may interfere with the assay. In these experiments, samples containing equal numbers of Frex-expressing cells or untransfected (control) cells were both measured. The background values (samples of control cells) were subtracted from that of samples of Frex-expressing cells. This correction basically eliminated the interference of not only the autofluorescence of the microplate, but also the autofluorescence of the cells. The main contributor of the overall background fluorescence when excited at 410 nm or 500 nm is that arising from the plate itself, as the sample buffer has readings similar to those of samples with untransfected cells. Generally, cell autofluorescence with excitation at 500 nm is less than 2% of Frex or Frex-Mit fluorescence, and autofluorescence with excitation at 410 nm is less than 4% of Frex fluorescence. There are no significant changes in cell autofluorescence excited at 410 nm or 500 nm under different metabolic conditions. Therefore, the effect of cell autofluorescence is negligible under these experimental conditions. In contrast, cell autofluorescence is 12% ± 20% of Frex-Mit fluorescence with excitation at 410 nm, which is more significant. The autofluorescence of these cells must be determined and used to correct the Frex-Mit fluorescence with excitation at 410 nm. The main contributor to the measurement error is the noise of the microplate reader. Therefore, the ratio of Frex-Mit dual excitation should be measured by other means, e.g., microscopy using a stable light source and high-performance EMCCD camera. For digitonin permeabilization assay, Frex-Mit-expressing cells were resuspended with PBS and lysed with 100 mM KPi buffer (pH 8.0) containing 0.3% digitonin; Frex-expressing cells were resuspended with PBS buffer (pH 7.4) containing 0.001% digitonin. The fluorescence (excited at 485 nm) of cells or cell lysates in the presence or absence of 100 μM NADH was then measured.
Total Cellular NAD+ Assay
NAD+ levels were measured by the enzymatic cycling assay according to a previously described method (Szabó et al., 1996; Ying et al., 2001). NAD+ levels were assessed based on the reduction of MTT to formazan through the intermediation of phenazine methosulfate. Cells were treated with different concentrations of NADH at 37°C for 2 min and then extracted and assayed.
Oxygen Consumption
Oxygen consumption was determined using the BD Oxygen Biosensor System (BD Biosciences) as described previously (Wilson-Fritch et al., 2004). We added 1 × 10⁶ of 293FT cells to each well of BD Oxygen Biosensor plate. Levels of oxygen consumption were measured under baseline conditions and in the presence of NADH or mitochondrial inhibitors. Fluorescence was recorded at 1 min intervals for 40 min by a Synergy 2 Multi-Mode Micro-plate Reader (BioTek) with excitation filter 485 BP 20 nm and emission filter 645 BP 40 nm at 37°C.
Statistical Analysis
Data are presented either as a representative example of a single experiment repeated at least in triplicate or as three or more experiments. Data obtained are represented as means ± SD or means ± SEM.
Supplementary Material
ACKNOWLEDGMENTS
We thank Chunyuan Zhou, Minyan Deng, Jin Xu, and Wenyun Zheng for technical assistance and Stephanie Tribuna and Susan Vignolo-Collazzo for expert secretarial assistance. This work was supported by the NSFC (grant numbers 31071260, 90713026, 31170815, and 91013012), the 863 Program (grant number 2006AA02Z160), Specialized Research Fund for the Doctoral Program of Higher Education (grant number 20100074110010), the Fok Ying Tung Education Foundation (grant number 111022), the Program for Professor of Special Appointment (Eastern Scholar) at Shanghai Institutions of Higher Learning, Open Funding Project of the State Key Laboratory of Bioreactor Engineering and the 111 Project (grant number B07023), and NIH grants HL 061795, HL 070819, HL 048743, HL 107192, and HL 108630 (to J.L.).
Footnotes
SUPPLEMENTAL INFORMATION Supplemental Information includes six figures, one table, and Supplemental Experimental Procedures and can be found with this article online at doi:10.1016/j.cmet.2011.09.004.
REFERENCES
- Avi-Dor Y, Olson JM, Doherty MD, Kaplan NO. Fluorescence of Pyridine Nucleotides in Mitochondria. J. Biol. Chem. 1962;237:2377–2383. [Google Scholar]
- Balaban RS, Nemoto S, Finkel T. Mitochondria, oxidants, and aging. Cell. 2005;120:483–495. doi: 10.1016/j.cell.2005.02.001. [DOI] [PubMed] [Google Scholar]
- Belousov VV, Fradkov AF, Lukyanov KA, Staroverov DB, Shakhbazov KS, Terskikh AV, Lukyanov S. Genetically encoded fluorescent indicator for intracellular hydrogen peroxide. Nat. Methods. 2006;3:281–286. doi: 10.1038/nmeth866. [DOI] [PubMed] [Google Scholar]
- Berg J, Hung YP, Yellen G. A genetically encoded fluorescent reporter of ATP:ADP ratio. Nat. Methods. 2009;6:161–166. doi: 10.1038/nmeth.1288. [DOI] [PMC free article] [PubMed] [Google Scholar]
- Blinova K, Carroll S, Bose S, Smirnov AV, Harvey JJ, Knutson JR, Balaban RS. Distribution of mitochondrial NADH fluorescence lifetimes: steady-state kinetics of matrix NADH interactions. Biochemistry. 2005;44:2585–2594. doi: 10.1021/bi0485124. [DOI] [PubMed] [Google Scholar]
- Bücher T, Brauser B, Conze A, Klein F, Langguth O, Sies H. State of oxidation-reduction and state of binding in the cytosolic NADH-system as disclosed by equilibration with extracellular lactate-pyruvate in hemoglobin-free perfused rat liver. Eur. J. Biochem. 1972;27:301–317. doi: 10.1111/j.1432-1033.1972.tb01840.x. [DOI] [PubMed] [Google Scholar]
- DeBerardinis RJ, Lum JJ, Hatzivassiliou G, Thompson CB. The biology of cancer: metabolic reprogramming fuels cell growth and proliferation. Cell Metab. 2008;7:11–20. doi: 10.1016/j.cmet.2007.10.002. [DOI] [PubMed] [Google Scholar]
- Eng J, Lynch RM, Balaban RS. Nicotinamide adenine dinucleotide fluorescence spectroscopy and imaging of isolated cardiac myocytes. Biophys. J. 1989;55:621–630. doi: 10.1016/S0006-3495(89)82859-0. [DOI] [PMC free article] [PubMed] [Google Scholar]
- Eto K, Tsubamoto Y, Terauchi Y, Sugiyama T, Kishimoto T, Takahashi N, Yamauchi N, Kubota N, Murayama S, Aizawa T, et al. Role of NADH shuttle system in glucose-induced activation of mitochondrial metabolism and insulin secretion. Science. 1999;283:981–985. doi: 10.1126/science.283.5404.981. [DOI] [PubMed] [Google Scholar]
- Kasimova MR, Grigiene J, Krab K, Hagedorn PH, Flyvbjerg H, Andersen PE, Møller IM. The free NADH concentration is kept constant in plant mitochondria under different metabolic conditions. Plant Cell. 2006;18:688–698. doi: 10.1105/tpc.105.039354. [DOI] [PMC free article] [PubMed] [Google Scholar]
- Kasischke KA, Vishwasrao HD, Fisher PJ, Zipfel WR, Webb WW. Neural activity triggers neuronal oxidative metabolism followed by astrocytic glycolysis. Science. 2004;305:99–103. doi: 10.1126/science.1096485. [DOI] [PubMed] [Google Scholar]
- Khan JA, Forouhar F, Tao X, Tong L. Nicotinamide adenine dinucleotide metabolism as an attractive target for drug discovery. Expert Opin. Ther. Targets. 2007;11:695–705. doi: 10.1517/14728222.11.5.695. [DOI] [PubMed] [Google Scholar]
- Lin SJ, Guarente L. Nicotinamide adenine dinucleotide, a metabolic regulator of transcription, longevity and disease. Curr. Opin. Cell Biol. 2003;15:241–246. doi: 10.1016/s0955-0674(03)00006-1. [DOI] [PubMed] [Google Scholar]
- Lu H, Burns D, Garnier P, Wei G, Zhu K, Ying W. P2X7 receptors mediate NADH transport across the plasma membranes of astrocytes. Biochem. Biophys. Res. Commun. 2007;362:946–950. doi: 10.1016/j.bbrc.2007.08.095. [DOI] [PubMed] [Google Scholar]
- Mayevsky A. Brain energy metabolism of the conscious rat exposed to various physiological and pathological situations. Brain Res. 1976;113:327–338. doi: 10.1016/0006-8993(76)90944-6. [DOI] [PubMed] [Google Scholar]
- Mayevsky A, Rogatsky GG. Mitochondrial function in vivo evaluated by NADH fluorescence: from animal models to human studies. Am. J. Physiol. Cell Physiol. 2007;292:C615–C640. doi: 10.1152/ajpcell.00249.2006. [DOI] [PubMed] [Google Scholar]
- McKenna MC, Waagepetersen HS, Schousboe A, Sonnewald U. Neuronal and astrocytic shuttle mechanisms for cytosolic-mitochondrial transfer of reducing equivalents: current evidence and pharmacological tools. Biochem. Pharmacol. 2006;71:399–407. doi: 10.1016/j.bcp.2005.10.011. [DOI] [PubMed] [Google Scholar]
- McLaughlin KJ, Strain-Damerell CM, Xie K, Brekasis D, Soares AS, Paget MS, Kielkopf CL. Structural basis for NADH/NAD+ redox sensing by a Rex family repressor. Mol. Cell. 2010;38:563–575. doi: 10.1016/j.molcel.2010.05.006. [DOI] [PubMed] [Google Scholar]
- Mintun MA, Vlassenko AG, Rundle MM, Raichle ME. Increased lactate/pyruvate ratio augments blood flow in physiologically activated human brain. Proc. Natl. Acad. Sci. USA. 2004;101:659–664. doi: 10.1073/pnas.0307457100. [DOI] [PMC free article] [PubMed] [Google Scholar]
- Nagai T, Yamada S, Tominaga T, Ichikawa M, Miyawaki A. Expanded dynamic range of fluorescent indicators for Ca(2+) by circularly permuted yellow fluorescent proteins. Proc. Natl. Acad. Sci. USA. 2004;101:10554–10559. doi: 10.1073/pnas.0400417101. [DOI] [PMC free article] [PubMed] [Google Scholar]
- Nakai J, Ohkura M, Imoto K. A high signal-to-noise Ca(2+) probe composed of a single green fluorescent protein. Nat. Biotechnol. 2001;19:137–141. doi: 10.1038/84397. [DOI] [PubMed] [Google Scholar]
- Patterson GH, Knobel SM, Arkhammar P, Thastrup O, Piston DW. Separation of the glucose-stimulated cytoplasmic and mitochondrial NAD(P)H responses in pancreatic islet beta cells. Proc. Natl. Acad. Sci. USA. 2000;97:5203–5207. doi: 10.1073/pnas.090098797. [DOI] [PMC free article] [PubMed] [Google Scholar]
- Rutter J, Reick M, Wu LC, McKnight SL. Regulation of clock and NPAS2 DNA binding by the redox state of NAD cofactors. Science. 2001;293:510–514. doi: 10.1126/science.1060698. [DOI] [PubMed] [Google Scholar]
- Sauve AA. NAD+ and vitamin B3: from metabolism to therapies. J. Pharmacol. Exp. Ther. 2008;324:883–893. doi: 10.1124/jpet.107.120758. [DOI] [PubMed] [Google Scholar]
- Skala MC, Riching KM, Gendron-Fitzpatrick A, Eickhoff J, Eliceiri KW, White JG, Ramanujam N. In vivo multiphoton microscopy of NADH and FAD redox states, fluorescence lifetimes, and cellular morphology in precancerous epithelia. Proc. Natl. Acad. Sci. USA. 2007;104:19494–19499. doi: 10.1073/pnas.0708425104. [DOI] [PMC free article] [PubMed] [Google Scholar]
- Stubbs M, Veech RL, Krebs HA. Control of the redox state of the nicotinamide-adenine dinucleotide couple in rat liver cytoplasm. Biochem. J. 1972;126:59–65. doi: 10.1042/bj1260059. [DOI] [PMC free article] [PubMed] [Google Scholar]
- Szabó C, Zingarelli B, O'Connor M, Salzman AL. DNA strand breakage, activation of poly (ADP-ribose) synthetase, and cellular energy depletion are involved in the cytotoxicity of macrophages and smooth muscle cells exposed to peroxynitrite. Proc. Natl. Acad. Sci. USA. 1996;93:1753–1758. doi: 10.1073/pnas.93.5.1753. [DOI] [PMC free article] [PubMed] [Google Scholar]
- Tantama M, Hung YP, Yellen G. Imaging intracellular pH in live cells with a genetically encoded red fluorescent protein sensor. J. Am. Chem. Soc. 2011;133:10034–10037. doi: 10.1021/ja202902d. [DOI] [PMC free article] [PubMed] [Google Scholar]
- Vander Heiden MG, Cantley LC, Thompson CB. Understanding the Warburg effect: the metabolic requirements of cell proliferation. Science. 2009;324:1029–1033. doi: 10.1126/science.1160809. [DOI] [PMC free article] [PubMed] [Google Scholar]
- Vemuri GN, Eiteman MA, McEwen JE, Olsson L, Nielsen J. Increasing NADH oxidation reduces overflow metabolism in Saccharomyces cerevisiae. Proc. Natl. Acad. Sci. USA. 2007;104:2402–2407. doi: 10.1073/pnas.0607469104. [DOI] [PMC free article] [PubMed] [Google Scholar]
- Vishwasrao HD, Heikal AA, Kasischke KA, Webb WW. Conformational dependence of intracellular NADH on metabolic state revealed by associated fluorescence anisotropy. J. Biol. Chem. 2005;280:25119–25126. doi: 10.1074/jbc.M502475200. [DOI] [PubMed] [Google Scholar]
- Vlassenko AG, Rundle MM, Raichle ME, Mintun MA. Regulation of blood flow in activated human brain by cytosolic NADH/NAD+ ratio. Proc. Natl. Acad. Sci. USA. 2006;103:1964–1969. doi: 10.1073/pnas.0510632103. [DOI] [PMC free article] [PubMed] [Google Scholar]
- Wakita M, Nishimura G, Tamura M. Some characteristics of the fluorescence lifetime of reduced pyridine nucleotides in isolated mitochondria, isolated hepatocytes, and perfused rat liver in situ. J. Biochem. 1995;118:1151–1160. doi: 10.1093/oxfordjournals.jbchem.a125001. [DOI] [PubMed] [Google Scholar]
- Wang E, Bauer MC, Rogstam A, Linse S, Logan DT, von Wachenfeldt C. Structure and functional properties of the Bacillus subtilis transcriptional repressor Rex. Mol. Microbiol. 2008a;69:466–478. doi: 10.1111/j.1365-2958.2008.06295.x. [DOI] [PubMed] [Google Scholar]
- Wang W, Fang H, Groom L, Cheng A, Zhang W, Liu J, Wang X, Li K, Han P, Zheng M, et al. Superoxide flashes in single mitochondria. Cell. 2008b;134:279–290. doi: 10.1016/j.cell.2008.06.017. [DOI] [PMC free article] [PubMed] [Google Scholar]
- Williamson DH, Lund P, Krebs HA. The redox state of free nicotinamide-adenine dinucleotide in the cytoplasm and mitochondria of rat liver. Biochem. J. 1967;103:514–527. doi: 10.1042/bj1030514. [DOI] [PMC free article] [PubMed] [Google Scholar]
- Wilson-Fritch L, Nicoloro S, Chouinard M, Lazar MA, Chui PC, Leszyk J, Straubhaar J, Czech MP, Corvera S. Mitochondrial remodeling in adipose tissue associated with obesity and treatment with rosiglita-zone. J. Clin. Invest. 2004;114:1281–1289. doi: 10.1172/JCI21752. [DOI] [PMC free article] [PubMed] [Google Scholar]
- Xie W, Xu A, Yeung ES. Determination of NAD(+) and NADH in a single cell under hydrogen peroxide stress by capillary electrophoresis. Anal. Chem. 2009;81:1280–1284. doi: 10.1021/ac802249m. [DOI] [PubMed] [Google Scholar]
- Yang H, Yang T, Baur JA, Perez E, Matsui T, Carmona JJ, Lamming DW, Souza-Pinto NC, Bohr VA, Rosenzweig A, et al. Nutrient-sensitive mitochondrial NAD+ levels dictate cell survival. Cell. 2007;130:1095–1107. doi: 10.1016/j.cell.2007.07.035. [DOI] [PMC free article] [PubMed] [Google Scholar]
- Ying W, Sevigny MB, Chen Y, Swanson RA. Poly(ADP-ribose) glycohydrolase mediates oxidative and excitotoxic neuronal death. Proc. Natl. Acad. Sci. USA. 2001;98:12227–12232. doi: 10.1073/pnas.211202598. [DOI] [PMC free article] [PubMed] [Google Scholar]
- Yu Q, Heikal AA. Two-photon autofluorescence dynamics imaging reveals sensitivity of intracellular NADH concentration and conformation to cell physiology at the single-cell level. J. Photochem. Photobiol. B. 2009;95:46–57. doi: 10.1016/j.jphotobiol.2008.12.010. [DOI] [PMC free article] [PubMed] [Google Scholar]
- Zhang Q, Piston DW, Goodman RH. Regulation of corepressor function by nuclear NADH. Science. 2002;295:1895–1897. doi: 10.1126/science.1069300. [DOI] [PubMed] [Google Scholar]
- Zhang Q, Wang SY, Nottke AC, Rocheleau JV, Piston DW, Goodman RH. Redox sensor CtBP mediates hypoxia-induced tumor cell migration. Proc. Natl. Acad. Sci. USA. 2006;103:9029–9033. doi: 10.1073/pnas.0603269103. [DOI] [PMC free article] [PubMed] [Google Scholar]
Associated Data
This section collects any data citations, data availability statements, or supplementary materials included in this article.