

Abstract
α‐Synuclein (α‐Syn) is a neuronal protein that accumulates progressively in Parkinson's disease (PD) and related synucleinopathies. Attempting to identify cellular factors that affect α‐Syn neuropathology, we previously reported that polyunsaturated fatty acids (PUFAs) promote α‐Syn oligomerization and aggregation in cultured cells. We now report that docosahexaenoic acid (DHA), a 22:6 PUFA, affects α‐Syn oligomerization by activating retinoic X receptor (RXR) and peroxisome proliferator‐activated receptor γ2 (PPARγ2). In addition, we show that dietary changes in brain DHA levels affect α‐Syn cytopathology in mice transgenic for the PD‐causing A53T mutation in human α‐Syn. A diet enriched in DHA, an activating ligand of RXR, increased the accumulation of soluble and insoluble neuronal α‐Syn, neuritic injury and astrocytosis. Conversely, abnormal accumulations of α‐Syn and its deleterious effects were significantly attenuated by low dietary DHA levels. Our results suggest a role for activated RXR/PPARγ 2, obtained by elevated brain PUFA levels, in α‐Syn neuropathology.
Keywords: alpha synuclein, docosahexaenoic acid, Parkinson's disease, peroxisome proliferator‐activated receptors (PPAR)γ, Retinoic X receptor (RXR), protein oligomerization and aggregation
INTRODUCTION
α‐Synuclein (α−Syn) is a presynaptic protein critically involved in the cytopathology and genetics of Parkinson's disease (PD) [reviewed in 29, 38]. A progressive conversion of the soluble α‐Syn protein into insoluble, β‐sheet rich filaments and their intraneuronal deposition into Lewy bodies (LB) and Lewy neurites underlie its cytotoxicity in the synucleinopathies (15). Growing evidence suggests that polyunsaturated fatty acids (PUFAs) can contribute to mechanisms leading to abnormal α‐Syn accumulation. α‐Syn expression was upregulated in rats fed a diet consisting of rat chow enriched with PUFAs 3, 25. Oligomerization of purified α‐Syn in vitro was enhanced in response to PUFAs 6, 40. We previously found that exposure of cultured dopaminergic cells to physiological PUFA concentrations enhanced the levels of α‐Syn soluble oligomers and of insoluble α‐Syn aggregates 2, 44 and increased its deposition into cytoplasmic intraneuronal Lewy‐like inclusions (2).
Importantly, evidence for a reciprocal effect has also been reported; α‐Syn expression/accumulation can selectively alter cellular and whole‐brain phospholipid levels, including their docosahexaenoic acid (DHA) levels 16, 19, 20, 41, 46. These effects may result from structural homologies of α‐Syn with class A2 apolipoproteins 12, 13, 17. Of particular interest, higher DHA levels were observed in the frontal cortex of patients with PD or dementia with LB (DLB) (46), the same region where α‐Syn accumulation in soluble oligomers and insoluble aggregates was documented (45).
DHA is a long‐chain omega‐3 PUFA with 22 carbons and six double bonds. It is the most abundant fatty acid in the central nervous system and is particularly enriched in gray matter phospholipids [for review see 23, 36]. DHA plays a key role in diverse cellular and neuronal activities, including dopaminergic and serotoninergic neurotransmission 27, 51, synaptic growth and function, and the regulation of nerve growth factor content and neuronal size [reviewed in (49)]. At the molecular level, DHA was identified as the activating ligand for retinoic X receptor (RXR) in vivo 14, 30, modulating the activity of RXR as a transcription factor. In addition, DHA and other PUFAs can bind peroxisome proliferator‐activated receptors (PPARs) 26, 28 and activate transcription of their target genes (24).
In the current study, we sought to extend our findings on PUFA effects on α‐Syn‐expressing cultured cells to the in vivo situation. We investigated the effect of high vs. low levels of dietary DHA, an activating ligand of RXR, on α‐Syn‐related cytopathology in A53T α‐Syn transgenic mouse brains. In A53T α‐Syn mice fed a high‐DHA diet, we detected higher levels of α‐Syn expression, oligomerization and aggregation than occurred in mice on a low‐DHA (and low n‐3 PUFA) diet. Moreover, we detected enhanced astrocytosis, represented by higher glial fibrillary acidic protein (GFAP) immunoreactivity and evidence of neuronal injury, represented by decreased synaptophysin immunoreactivity in mice fed with the high‐DHA diet. We also obtained evidences that activated RXR and PPARγ2 are involved in α‐Syn cytopathology, and show that RXR activation is mediating the effect of DHA on α‐Syn oligomerization. Our results suggest that elevated brain DHA levels augment α‐Syn pathogenic effects by activating these nuclear hormone receptors.
MATERIALS AND METHODS
Animals and diets
The A53T α‐Syn tg mouse (18) was purchased from Jax laboratories (Bar Harbor, ME USA) and bred to homozygousity. Similar to the original description, the mice remained healthy up to the age of ∼7 months. At 8–9 months of age, about 15% of the colony began to develop a dramatic motor phenotype and additional symptoms, including neglect of grooming, weight loss and reduced ambulation. These changes were followed by severe movement impairment and partial paralysis of the limbs, accompanied by periods (several seconds) of freezing of the hind limbs. The symptoms were developed within several days to full paralysis, hunched back and apathy. The percent of affected animals in the colony grew with age. With ∼50% affected animals at the age of 10–11 months. Females survived longer than males, up to 15 month (∼10% of the colony). In parallel, we maintained a nontransgenic (ntg) mouse colony (C57Bl/6) (Jax Laboratories). The mice were housed in an animal facility that is fully compliant with the Public Health Service (PHS) Policy on Humane Care and Use of Laboratory Animals. Males and females of A53T α‐Syn mice were randomly assigned between the three diet groups. The effect of the diet was tested also in age‐matched ntg male and female (C57Bl/6). Mice were fed for 95 ± 5 or 230 days a standard mouse chow (2018SC + F, Harlan Teklad, Madison, WI, USA); a safflower‐based diet depleted of DHA, low‐DHA diet (TD 00522, Harlan Teklad); or the above low‐DHA diet (and low‐n‐3 PUFA diet) supplemented with 0.69% w/w DHA (Martek Bioscience, Columbia, MD, USA) (TD 07708) 8, 33. The low‐DHA diet contains 4.86% 18:2 n‐6 (linoleic acid), 0.06% 18:3 n‐3 (linolenic acid) and 0.0002 n‐3 DHA. The high‐DHA diet contains 2.9% 18:2 n‐6, 0.03% 18:3 n‐3 and is supplemented with 0.69% DHA. Control diet contained 2.45% and 0.18% of 18:2n‐6 and 18:3n‐3, respectively. The antioxidants alpha tocopherol (126 IU/kg) and ethoxyquin (10 ppm) were added to the standard and DHA diets, respectively. The contents of total fat (6%), proteins (18%) and carbohydrates (49%) are identical between the diets. The diets were kept in cold and in dark, and food pellets were replaced every other day. Overall, we performed three independent experiments with 6–11 mice in each diet group for the 95 ± 5 days and one 230‐day feeding experiment with 10–15 mice in each diet group. At termination of the experiment, mice were anesthetized with an intraperitoneal overdose injection of sodium pentobarbitone (1 ml/1.5 kg) and were then perfused with phosphate‐buffered saline (PBS) or with PBS‐buffered formalin. Following surgical removal of brains and spinal cords, tissue was frozen and used for further biochemical analyses (PBS perfusion) or fixed for another 24 h in formalin.
Preparation of brain extracts
Brain extract was prepared from one brain hemisphere as previously described (44) with slight modifications. Homogenization (20 up‐and‐down strokes with a Teflon homogenizer, followed by five passages through a 27‐gauge needle) was in 1:10 (w/vol) homogenization (H) buffer [20 mM Hepes, pH 7.4; 1 mM MgCl2; 0.32 M sucrose; 43 mM β‐mercaptoethanol; and 1X protease inhibitor mix (Sigma, Rehovot, Israel)]. The homogenate was centrifuged at 180 000 × g for 1 h. The resultant supernatant containing soluble oligomers was separated from the pellet.
Quantitative fatty acids (FA) analysis
Samples (equivalent of 1.5–2 mg protein) of total brain extracts were processed and analyzed for their FAs contents using the Microbial Identification System at Microbial ID, Inc. (Newark, DE, USA) as previously described (46). Using Hewlett‐Packard 5890A (Palo Alto, CA, USA) gas chromatograph (GC) equipped with a hydrogen flame ionization detector, an automatic injector, a sample controller and an electronic integrator controlled by a minicomputer. The GC used a fused silica capillary column with methylphenyl silicone (SE54) as the stationary phase. The computer‐controlled operating parameters of the instrument were as follows: injector temperature, 250°C; detector temperature, 300°C; oven temperature, programmed from 170°C to 270°C at 5°C per min. The FA methyl esters in each sample were identified by comparing retention times with known standards and by computer calculation of equivalent chain lengths.
Immunohistochemistry (IHC)
IHC was performed with formalin‐fixed tissue as previously described (34). Briefly, sections of 5 µm were deparaffinized in xylene followed by graded alcohol in descending ethanol concentrations. Endogenous peroxidase activity was reduced by incubation in methanol/H2O2 (150 mL methanol and 30 mL of 30% H2O2). Antigen retrieval was performed with 100% formic acid for 5 minutes followed by extensive washes. Sections were blocked with 2% goat serum in 0.1 M Tris‐HCl pH 7.6. The sections were then immunostained using anti‐α‐Syn antibody, Syn 303 (1:3000, obtained from Virginia M.‐Y. Lee, University of Pennsylvania, Philadelphia, PA, USA). Secondary antibody was biotinylated donkey anti mouse (1:200, Enco, Petach Tikvah, Israel), followed by ExtrAvidin (Sigma; 1:100 in blocking solution). Immunoreactivity was visualized with EnzMet‐detection kit (Nanoprobes, Yaphank, NY, USA). For pathological quantification, we analyzed total α‐Syn immunoreactivity. To reduce the experimental error, we stained in sets of three slides (including standard mouse chow, low‐ and high‐DHA diet). The slides were developed and imaged in parallel. Images were taken using a ×40 objective in light microscope using neutral density filter and calibration of the white color with overlapping spectrum for red, green and blue. We compared only between series of pictures taken together after a particular event of Kohler calibration. Images were quantified with the Image pro plus 6.3 program (Media Cybernetics, Bethesda, MD, USA). The selection of objects was done automatically by color definition. For objects specification, we used the smoothing options. The selected objects above 2000 pixels were exported to Excel as integrated optical density (area × average density), and background was subtracted from the averaged integrated optical density in each image. Two brain regions were selected for analyses: cortex and brain stem. The relative location of the brain slice and the identification of brain regions were determined according to a mouse brain atlas (39). The frontal cortex was at the level of corpus callosum and the frontal lateral ventricles (1.42–0 mm rostral to bregma), and the gigantocellular reticular nuclei in the brain stem were at the level of the fourth ventricle (5.4–7.2 mm caudal to bregma). In each brain region, total α‐Syn immunoreactivity was quantified in at least five fields for an individual mouse brain.
For fluorostaining, monoclonal mouse antisynaptophysin antibody (1:200; DAKO, Glostrup, Denmark) and monoclonal mouse anti‐GFAP antibody (1:200; DAKO) and secondary antibody at 1:200, antimouse‐cy5 (Jackson Laboratories, Bar‐Harbor ME, USA) were used. Slides were sealed with mounting medium (cat# M1289 Sigma, Rehovot, Israel) and analyzed by confocal microscopy.
Cells
HeLa cells stably over expressing α‐Syn cDNA (2) (1 × 10⁷ cells in a 10 cm dish) were transiently transfected with human RXRα cDNA (obtained from Bruce M. Spiegelman, Harvard Medical School, Boston, MA); human PPARγ 1 or PPARγ 2 cDNAs (obtained from Ron Evans, Howard Hughes Medical Institute, USA); or mock‐transfected. 72 h post transfection, the cells were collected and processed for α‐Syn oligomers detection as previously described (2). Differentiated, α‐Syn over expressing MN9D cells (10) were transferred to DMEM supplemented with 2% serum and treated with either 9‐cis retinoic acid, troglitazone (Cayman, MI, USA), HX531 (obtained from Dr H. Kagechika, University of Tokyo, Japan), or GW9662 (Sigma) for the indicated time and concentrations and then processed for α‐Syn oligomers detection.
Immunoblotting
Samples of soluble fraction (equal amount of protein) were loaded on a 14% Tris‐glycine gels, transferred to polyvinyl difluoride (PVDF) membrane and reacted with anti human α‐Syn LB509 antibody. For oligomers detection in the soluble fraction only, samples were preheated at 65°C for 16 h in H buffer prior to gel loading (44). The blots were scanned in a Umax Magic Scan (Eastman Kodak, Rochester, NY, USA) and analyzed for density of α‐Syn signal using UN‐SCAN‐IT GEL 3.1 software (Silk Scientific, Orem, UT, USA).
Brain slices
Transverse slices of A53T α‐Syn or ntg mouse brain (7–8 months old; 300 µm) were prepared with a vibrating microslicer (Leica, Nussloch, Germany) and transferred to a storage chamber containing oxygenated (95% O2/5% CO2) artificial cerebrospinal fluid (ACSF) at room temperature. The ACSF comprised (in mM) 124 NaCl, 3.5 KCl, 2 MgCl2, 1.6 CaCl2, 24 NaHCO3, and 10 d‐glucose; pH 7.4; osmolarity, 305 mOsm/L. The temperature of the ACSF was then slowly raised to 33°C and the slices were allowed to recover in the storage chamber for at least 1 h before adding specific compounds to the slices. Incubation lasted for additional 6–8 h.
Real time polymerase chain reaction (PCR)
The following primers were used to amplify the mouse endogenous α‐Syn: GTCTCAAAGCCTGTGCATCT and TCCACACTTTCCGACTTCTG; for the amplification of human transgenic α‐Syn: CTGACAGCAGTAGCCCAGAA and GGGGCTCCTTCTTCATTCTT; for the amplification of mouse endogenous PrP: ATCACCATCAAGCAGCACAC and CGCTCCATCATCTTCACATC. The results were normalized relative to the expression levels of mouse 18S gene.
Statistical analyses
To compare α‐Syn pathology between the three diet groups, the nonparametric Kruskal–Wallis analysis of variance (ANOVA) test was applied with Bonfferoni correction for multiple comparisons. Pair‐wise comparisons between the low‐DHA and high‐DHA groups at each mouse genotype were carried out using the nonparametric Mann–Whitney test.
RESULTS
To investigate the effect of chronically elevated brain DHA levels on α‐Syn cytopatholgy, we compared the effects of a low‐DHA (and low‐n‐3 PUFA) diet vs. a high‐DHA (0.69% DHA) diet and normalized to standard mouse chow. Importantly, the high‐ and low‐DHA diets are identical except for their n‐3/n‐6 contents, while the standard mouse chow diet involved additional differences in variable nutrients (see Methods section). For this reason, comparisons for the effect of DHA were performed between the high‐ and low‐DHA diets after normalization to the standard diet.
The specific diets affect whole brain PUFA composition
The effect of the low‐ and high‐DHA diets (given for 95 ± 5 days) on brain PUFA composition was analyzed by gas‐chromatography‐high‐performance liquid chromatography (HPLC) (see Methods section). Each FA is represented as percent of total FAs (= 100%) measured in the sample (Table 1). We found that the diets altered brain PUFA (and specifically brain DHA) content in ntg mice, a significantly higher DHA level was detected post‐high‐DHA diet (11.3% ± 0.4% vs. 9.0% ± 0.6% for standard chow; P < 0.05). In A53T α‐Syn mice, brain DHA levels were significantly altered by both the low‐DHA diet (8.2% ± 0.4%) and the high‐DHA diet (11.8% ± 0.3%) vs. standard chow (9.8% ± 0.6%) (P < 0.05). Moreover, the high‐DHA diet significantly lowered the levels of 22:4 (ω6) and 20:4 (ω6) in A53T α‐Syn mouse brains but not in ntg brains, indicating an effect of high dietary DHA on other brain PUFAs when α‐Syn is at elevated levels.
Table 1.
Effects of dietary DHA on brain polyunsaturated fatty acids (FA) composition.
| Diet group | NTG | A53T α‐Synuclein | ||||
|---|---|---|---|---|---|---|
| DHA | DTA | ARA | DHA | DTA | ARA | |
| Standard chow | 9.0 ± 0.63 | 1.2 ± 1.45 | 8.1 ± 1.53 | 9.8 ± 0.58 | 2.9 ± 0.12 | 8.7 ± 0.26 |
| low DHA | 7.4 ± 0.82 | 2.3 ± 1.28 | 8.2 ± 0.78 | 8.2 ± 0.37* | 3.2 ± 0.0 | 8.6 ± 0.49 |
| high DHA | 11.3 ± 0.39* | 2.0 ± 0.23 | 7.4 ± 1.17 | 11.8 ± 0.34* | 2.0 ± 0.07* | 7.3 ± 0.34* |
P < 0.05, Mann–Whitney Test.
FA analyses by gas‐chromatography‐high‐performance liquid chromatography (HPLC). Each FA is represented as percent of total FA's (= 100%) measured in the sample.
Mean ± standard error (SE) of n = 4–6 mice in each diet group.
DHA, 22:6, docosahexaenoic acid; DTA, 22:4, docosatetraenoic acid; ARA, 20:4, arachidonic acid; NTG, nontransgenic.
Dietary DHA changes alter α‐Syn oligomerzation in transgenic A53T α‐Syn mice
The effect of the high‐DHA diet (given for 95 ± 5 days) on levels of soluble α‐Syn oligomers was determined using the high‐speed (post‐180 000 × g) supernatants of whole mouse brain extracts (44) and analyzed by Western blot (WB), principally using the antihuman α‐Syn antibody, LB509. We consistently observed higher levels of α‐Syn soluble oligomers in WB of brain extracts of A53T α‐Syn mice on the high‐DHA diet and lower levels on the low‐DHA diet (Figure 1). Importantly, the dietary DHA levels also affected total soluble α‐Syn immunoreactivity throughout the gel lane, that is, lower total soluble α‐Syn immunoreactivity was seen in brains of mice fed with the low‐DHA diet vs. higher total soluble α‐Syn immunoreactivity in the brains of mice fed with the high‐DHA diet (Figure 1A,B). The effect of dietary DHA contents was significant, with a significantly higher level of total soluble α‐Syn and α‐Syn oligomers measured in the high‐DHA than the low‐DHA‐fed mice. The levels of total soluble α‐Syn and α‐Syn oligomers on the high DHA diet were highly similar to those on standard mouse chow, indicating that the effect of the DHA supplementation in the high‐DHA diet (0.69% w/vol) is within a physiological range.
Figure 1.
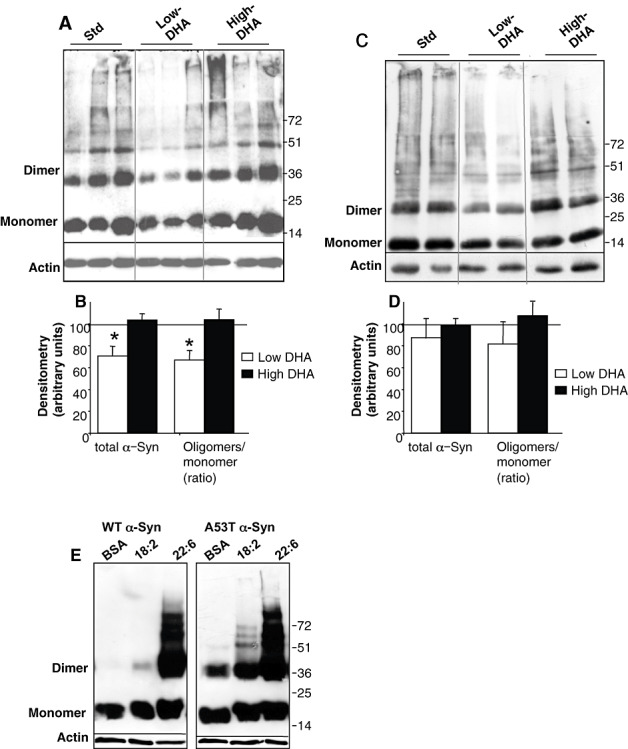
Dietary docosahexaenoic acid (DHA) (22:6) affects α‐Synuclein (α‐Syn) protein levels and α‐Syn oligomerization in brains of A53T α‐Syn transgenic mice. A. Western blot (WB) of high‐speed cytosols from whole mouse brain. Each lane has a brain of a mouse maintained on standard chow (std), low‐DHA or high‐DHA diet. Samples were treated for oligomer detection at 65°C and probed with LB509 antibody. B. Densitometry of total α‐Syn immunoreactivity throughout the lane and ratio of oligomer/monomer, normalized to actin on the same sample, for low‐DHA (white bars) or high‐DHA (black bars) diets. Results presented as percent of standard chow diet, designated as 100%. [Mean ± standard error (SE), n = 10–12 mice in each diet group]. C. WB of samples as in (A), but of nontransgenic (ntg) mice fed with the indicated diets. D. Densiotometry of oligomers to monomer ratio, normalized to actin in each sample. E. WB of high‐speed cytosols (20 µg protein) of MN9D cells overexpressing either human wt or A53T α‐Syn, conditioned in the presence of the indicated FA/BSA complexes (200/50 µM) in serum‐free medium. Samples were treated for oligomers detection at 65°C and probed with LB509. 18:2, linoleic acid; 22:6, DHA.
We similarly investigated the effects of these diets in ntg, C57Bl/6 mice and observed similar trends. Specifically, higher levels of total soluble α‐Syn and α‐Syn oligomerization in brains of ntg mice fed with the high‐DHA diet than in those mice fed with the low‐DHA diet (Figure 1C), however, these effects did not reach significancy (n = 4–5 mice in each diet group) (Figure 1D). A result that may be attributed to the lower effects of the diets on brain PUFA levels in these mice (see above).
Finally, we sought to compare wt and A53T human α‐Syn oligomers for their responsiveness to DHA. For this aim, we conditioned MN9D cells over expressing either wt or A53T human α‐Syn, in serum‐free medium supplemented with bovine serum albumin (BSA) only or BSA–FA (at 50 and 200 µM for BSA and FA, respectively) (45). Specifically, sister cultures were conditioned for 16 h in BSA (a FA carrier control); BSA–linoleic acid (n‐6 18:2; enriched in the low‐DHA diet) or BSA–DHA (n‐3 22:6; enriched in the high‐DHA diet). The results show a dramatic enhancing effect for DHA on levels of wt and A53T α‐Syn oligomers. That is, the calculated ratio between the signal obtained for α‐Syn soluble oligomers [migrating on the sodium dodecyl sulfate polyacrylamide gel electrophoresis (SDS‐PAGE) as 34 up 110 kDa, representing dimers up to hexamers], divided by the α‐Syn monomer and actin signal within the same sample is ∼4.5‐ and 5.7‐fold higher (for wt and A53T α‐Syn, respectively) than the ratio obtained in the sample treated with BSA only (Figure 1E). Only a mild effect for linoleic acid was observed, enhancing levels of α‐Syn oligomers by 1.2‐ and 1.8‐fold (for wt and A53T α‐Syn, respectively) over the BSA sample.
Dietary DHA affects α‐Syn accumulation in the brain stem of A53T α‐Syn mice
Consistent with the original description of this A53T α‐Syn mouse line (18), we observed abundant intraneuronal α‐Syn immunoreactive inclusions and neurites by IHC throughout the brain stem, deep cerebellar nuclei and in thalamus of brains of old (∼15 months) A53T α‐Syn tg mice maintained on standard mouse chow. Attempting to quantify the potential effect of dietary DHA on α‐Syn cytopathology, we recognized that abnormal α‐Syn is indistinguishable from the transgenic, overexpressed A53T α‐Syn (Figure 2) and therefore, we counted total α‐Syn signal within neurons (see Methods section).
Figure 2.
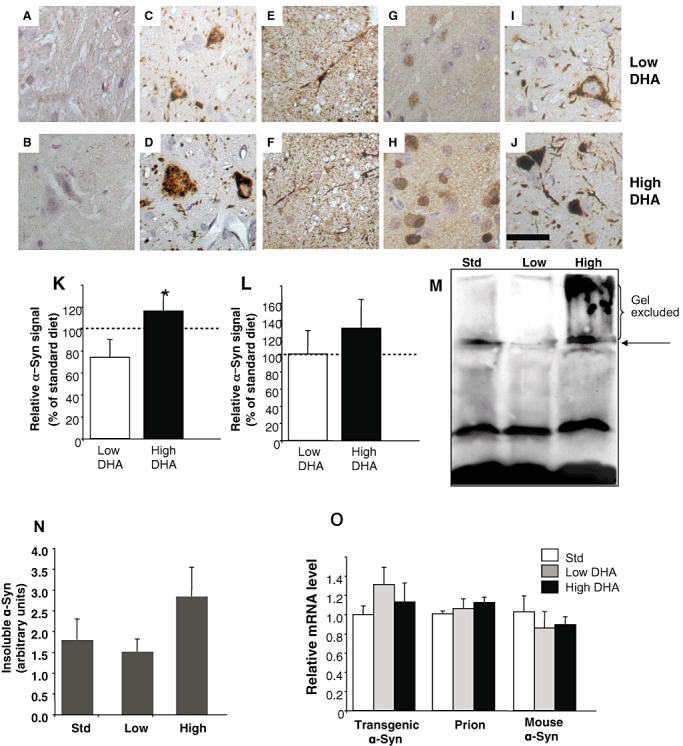
Dietary docosahexaenoic acid (DHA) (22:6) affects α‐Synuclein (α‐Syn) pathology in brains of A53T α‐Syn transgenic mice. Mice were fed with the specific diets for 95 ± 5 days. Representative images of immunohistochemistry (IHC): brain stem of nontransgenic (ntg) mouse (A–D); spinal cord of A53T α‐Syn mice (E and F); cortex of A53T α‐Syn mice (G and H); brain stem of A53T α‐Syn mice (I and J). Formalin‐fixed tissue immunostained with Syn‐1 antibody (C and D) or Syn 303 antibody (A,B,E–J) and visualized with EnzMet‐detection kit (Nanoprobes, Yaphank, NY, USA). Bar = 40 µM. Quantification of total neuronal human α‐Syn immunoreactivity in brain stem (K) and cortex (L) following 95 ± 5 days of the specified diets. Results are normalized to standard chow diet, designated as 100%. Mean ± standard error (SE) of n = 5 mice, with five to eight images for each mouse brain. *, P = 0.047, Mann–Whitney test. M. Insoluble, lipid‐associated α‐Syn, in brains of A53T α‐Syn mice fed with the standard chow (std), low‐ or high‐DHA diets. Chloroform/methanol extraction of a sample of the lipid‐rich low‐speed fraction (45). The interface between the organic (lower) and aqueous (upper) fractions was resuspended in 2× Laemmli buffer, analyzed by 10% Tris‐Glycin polyacrylamide gel electrophoresis (PAGE) and blotted with LB509. N. Quantitation of α‐Syn immunoreactivity in the gel (M) mean of n = 4 ± standard deviation. Arrow, indicates the border between stacking gel and separating gel. O. Quantitative analyses of mRNA levels of endogenous prion, endogenous α‐Syn and transgenic α‐Syn by real time polymerase chain reaction (RT‐PCR). mRNA purified from one hemisphere of A53T α‐Syn mouse brain fed either one of the different diets with n = 4 in each diet group.
We focused on two brain regions: the brain stem and specifically, the gigantocellular reticular nuclei and the pontine reticular nuclei [the brain stem was originally reported to contain α‐Syn cytopathology (18)]; and the cortex [originally reported to contain only low levels of pathology (18)]. We found higher levels of α‐Syn total immunoreactivity in brains of A53T α‐Syn tg mice fed with the high DHA diet and lower α‐Syn total immunoreactivity with the low DHA diet (Figure 2). A significant difference in α‐Syn signal detected by IHC was obtained by comparing the brain stem of mice from the low and high DHA diet groups (Figure 2I, J and K). Specifically, the relative α‐Syn signal measured and normalized to the standard chow group (designated as 100%) for the low and the high DHA diets were 73.8 ± 8.2 and 119.5 ± 7.7 respectively [mean ± standard error (SE); n = 5 mice per group; P = 0.047, Mann–Whitney test]. Importantly, no significant effects on α‐Syn immunoreactivity were detected in parallel sections containing the frontal cortex (Figure 2G, H and L) or spinal cords (Figure 2E and F). Furthermore, there were no significant differences in thyrosine hydroxylase (TH) enzymatic activity or TH immunoreactivity in the striatum (caudoputamen) of brains of mice from the three diet groups (not shown).
We then compared the effect of the diets on the levels of insoluble α‐Syn immunoreactivity associated with the lipid‐rich, low‐speed fraction (44). Importantly, this high MW, insoluble α‐Syn signal is associated with the pathogenic α‐Syn signal in the synucleinopathies (45). The lipid‐rich fraction was extracted by chloroform methanol (2:1) and the interface between the aqueous and organic phases was analyzed by WB and probed with LB509 antibody (Figure 2M,N). The result indicates higher levels of insoluble α‐Syn migrating at the stacking gel (Figure 2M) and also higher levels of α‐Syn immunoreactivity within the separating gel (Figure 2N) in the high‐ than the low‐DHA diet.
The transgenic over expression of human A53T α‐Syn is mediated by the PrP promoter in this mouse model. To exclude the possibility that the dietary DHA affects transcription through the PrP promoter, we measured the mRNA levels of transgenic human α‐Syn and endogenous PrP by real‐time (RT) PCR. We found no evidence for enhance PrP promoter transcription activity in brains of mice fed with the high‐ vs. low‐DHA diets. In addition, we found no evidence for an effect of the diet on mouse endogenouse α‐Syn mRNA levels (Figure 2O). These results suggest that the diets do not affect α‐Syn oligomerization through enhanced transcription of the transgene.
General histology, as assessed by hematoxylin and eosin, luxol fast blue and Bielschowsky stainings revealed no indication of an effect of the diet on the structure of either A53T α‐Syn tg or ntg mouse brains.
High dietary DHA levels enhance astrocytic gliosis in the brain stem of A53T α‐Syn mice
Significant astrocytic gliosis has been documented in brains of A53T α‐Syn mice (18). We sought to determine whether dietary DHA‐induced α‐Syn accumulation is associated with astrocytic gliosis. Sequential sections of brain stem and cortex, which were analyzed for α‐Syn pathogenic accumulations (Figure 2) and equivalent sections of ntg mouse brains, were immunostained for glial fibrillary acidic protein (GFAP). No effect of dietary DHA levels on astrocytic gliosis was seen in the tested regions of ntg mouse brains (Figure 3A). However, in line with pathogenic α‐Syn accumulations, a significantly higher GFAP signal was detected in the brain stem but not in the cortex of A53T α‐Syn mouse brains fed with the high‐DHA compared with those fed with the low‐DHA diet. Specifically, the GFAP signal (normalized to the standard chow diet group = 100%), in brain stem from mice fed with low‐ and high‐DHA diets, was 84.5% ± 5.1% and 143.1% ± 15.3%, respectively (mean ± SE; n = 5; P = 0.008, Mann–Whitney test).
Figure 3.
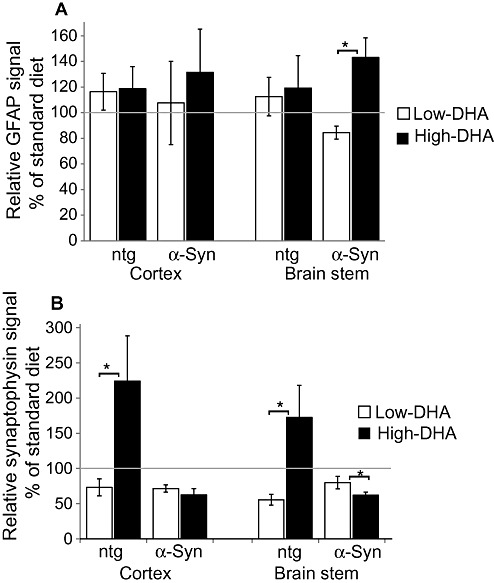
Dietary docosahexaenoic acid (DHA) (22:6) affects astrocytic gliosis and neuronal loss in A53T α‐Synuclein (α‐Syn) transgenic mice. A. Glial fibrillary acidic protein (GFAP) signal measured by immunohistochemistry (IHC) in the brain stem and cortex of nontransgenic (ntg) and A53T α‐Syn mice fed with the high‐ or low‐DHA diets and normalized to standard chow diet represented as 100%. Mean ± standard error (SE) of n = 5 mice. *, comparing the low‐ and high‐DHA groups, P = 0.008 Mann–Whitney test. B. Synaptophysin signal measured by IHC in brain stem and cortex of mice fed with the high‐ or low‐DHA diet and normalized to standard chow diet designated as 100%. Mean ± SE, n = 5 mice in each diet group; *, comparing the high and low DHA groups, P = 0.047, Mann–Whitney test.
High dietary DHA levels enhance synaptic loss in brain stem of A53T α‐Syn mice
Synaptophysin may be used as a marker for synaptic/neuronal injury 37, 43. We first compared synaptophysin levels in young (1‐month‐old) ntg and A53T α‐Syn brains of mice that were fed with the standard chow diet. A significant 41% lower signal for synaptophysin was detected in the brain stems of A53T α‐Syn than ntg mice (n = 5 mice for each genotype), P = 0.07 t‐test. That is, over expressing α‐Syn alone, without any additional dietary DHA manipulations, dramatically enhanced synaptic loss in the brain stem.
We next sought to determine whether dietary DHA‐induced α‐Syn accumulation is associated with neuronal injury. Sequential sections of brain stem and cortex, which were analyzed for α‐Syn pathogenic accumulations (Figure 2) and equivalent sections of ntg mouse brains, were immunostained for synaptophysin. The effect of dietary DHA on synaptophysin levels was compared within each genotype after normalization to the standard mouse chow. In agreement with previous reports of the neurorestorative or protective effects of dietary DHA in animal models (7), a significantly higher synaptophysin signal was detected in the brain stem and cortex of ntg mice fed with the high‐DHA diet than the ones fed with the standard chow or low‐DHA diets (n = 4; P = 0.021 Mann–Whitney test; Figure 3B). However, in line with the enhanced α‐Syn cytopathology described above, significantly lower synaptophysin immunoreactivity was detected in the brain stem but not the cortex of A53T α‐Syn mice fed with the high‐DHA diet than in those fed with the standard mouse chow. Specifically, the synaptophysin signal (normalized to the standard chow diet group = 100%), in brain stem from mice fed with low‐ and high‐DHA diets, was 79.9% ± 8.1% and 60.9% ± 4.3%, respectively (n = 5; P = 0.043 Mann–Whitney test; Figure 3B). The effects of the DHA diets on levels of synaptophysin were region specific, as no significant effect was detected by WB analyzing whole mouse brain extracts (not shown).
Prolonged exposure to dietary DHA further enhanced A53T α‐Syn pathogenic accumulations and neuronal injury
To analyze the effect of longer exposure to alterations in DHA concentrations, 2‐ to 3‐month‐old A53T α‐Syn mice were randomly divided into three groups and fed with the low‐ or high–DHA, or the standard chow diets for 230 days. The experiment was terminated when mice reached the age of 9–10 months, and α‐Syn cytopathology was quantified by IHC as above. Similar to the 95 ± 5‐day experiments, significantly higher levels of α‐Syn accumulation were detected by IHC in the brain stem of the A53T α‐Syn mice fed with the high‐DHA diet than in those fed with the low‐DHA diet. The α‐Syn signal measured and normalized to the standard chow diet group in mice on the low‐DHA diet was 100.4 ± 8.8 and in mice on the high‐DHA diet was 137.2 ± 4.2 (mean ± SE; n = 5 mice in each diet group; P = 0.03, Mann–Whitney test; Figure 4A). However, in contrast to the 95 ± 5‐day experiments, following 230 days of diet, significantly higher levels of α‐Syn accumulation were also detected in the cortex of the A53T α‐Syn mice. The values for the α‐Syn cortical signal measured and normalized to the standard chow group were 110.5 ± 7.1 and 153.9 ± 8.9, respectively, for the low‐ and high‐DHA diets (mean ± SE, n = 5 mice in each diet group; P = 0.047, Mann–Whitney test; Figure 4B). Importantly, no effect on α‐Syn accumulation was detected in the spinal cords of the same mice (not shown).
Figure 4.
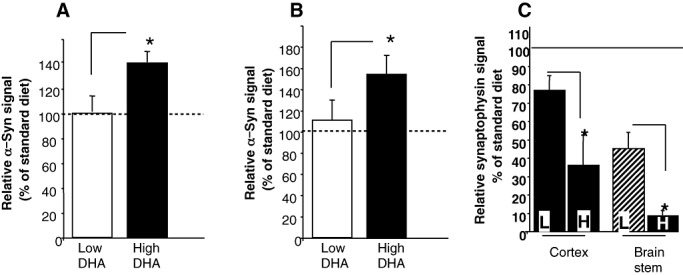
Prolonged exposure to high dietary docosahexaenoic acid (DHA) levels further enhances α‐Synuclein (α‐Syn) accumulation. Quantification of total neuronal human α‐Syn immunoreactivity in brain stem (A) and cortex (B) following 230 days of the specified diets. Results are normalized to standard chow diet, designated as 100%. Mean ± standard error (SE) of n = 5 mice, with five to eight images for each mouse brain. *, comparing the low‐ and high‐DHA groups, P = 0.03 (A) and P = 0.047 (B), Mann–Whitney test. C. Synaptophysin signal measured in brain stem and cortex of A53T α‐Syn mice fed with the high (H)‐ or low (L)‐DHA diet for 230 days and normalized to standard chow diet designated as 100%. Mean ± SE, n = 4 mice in each diet group.*, comparing the high‐ and low‐DHA diets, t‐test P > 0.03.
We next tested the effect of 230–day diet on synaptophysin signal in sequential sections containing the brain stem and the cortex of A53T α‐Syn mouse brains. Similar to the effect measured for the 95 ± 5‐day diet (Figure 3), a significantly lower signal for synaptophysin was detected in brain stems of mice fed with the high‐DHA than the standard chow or low‐DHA diet (Figure 4C). Moreover, in line with the enhanced α‐Syn cytopathology detected in the cortex, significantly lower synaptophysin immunoreactivity was also detected in the cortex of mice fed with the high‐DHA than the standard chow of low‐DHA diet. Therefore, the DHA‐dependent enhancement in neuronal/synaptic injury in the A53T α‐Syn mice occurs alongside with pathogenic accumulations of α‐Syn.
RXR over‐expression enhances α‐Syn accumulations
To gain insight into the molecular mechanisms by which dietary DHA enhances α‐Syn oligomerization, we tested the potential involvement of RXR in α‐Syn pathogenesis. Fatty acids and, in particular, DHA, affect mechanisms of lipid metabolism by ligand‐activated RXR that heterodimerizes with members of PPARs to activate gene expression. HeLa cells stably expressing human wt α‐Syn cDNA, were transiently transfected with increasing amounts of RXR cDNA together with a constant amount of green fluorescent protein (GFP). Seventy‐two hours later, the cells were collected and the level of soluble α‐Syn oligomers were assessed by WB in the high‐speed supernatant and normalized to GFP levels within each sample. While the levels of α‐Syn monomer remained unchanged, increasing levels of α‐Syn oligomers (dimer up to apparent hexamer) were detected with increasing amounts of RXR cDNA transfected into the cells (Figure 5A).
Figure 5.
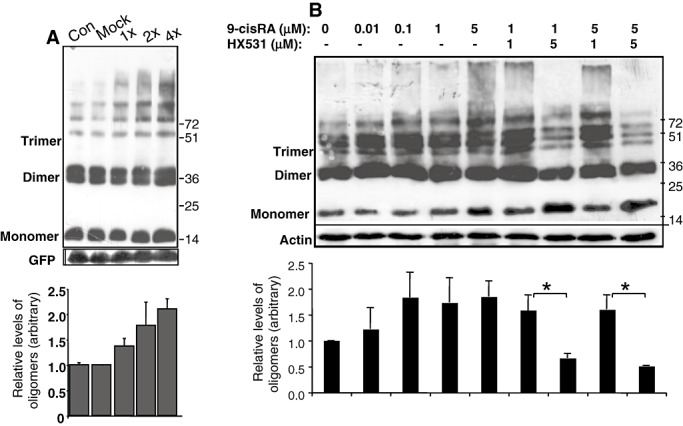
Enhanced α‐Synuclein (α‐Syn) oligomerization in response to retinoic X receptor (RXR) activation. A. HeLa cells stably expressing human ntg α‐Syn cDNA were transiently transfected with increasing amounts of RXR cDNA (0.6, 1.2 and 2.4 µg) together with a constant amount of green fluorescent protein (GFP) (0.6 µg) or mock DNA. Samples (15 µg protein) of post‐high‐speed (180 000 × g) supernatant were processed for oligomer detection by Western blot (WB) and probed with LB509 antibody. The levels of α‐Syn oligomers were normalized to GFP levels in the same sample and plotted as oligomer/monomer/GFP ratios (bars). A representative blot of mean ± standard deviation (SD) of n = 3–5 repeats. B. Samples (15 mg protein) of differentiated MN9D cells stably expressing α‐Syn conditioned for 18 h in the indicated compounds. Samples were processed for α‐Syn oligomer detection by WB as in (A); bars represent the ratio: oligomer/monomer/actin. A representative blot of mean ± SD of n = 3–5 repeats. *, P < 0.05, t‐test.
Activation of endogenous RXR enhances α‐Syn oligomerization in differentiated MN9D dopaminergic neuronal cells
To activate endogenous RXR, cells were treated with 9‐cis retinoic acid (9‐cisRA), a vitamin A metabolite that binds with high affinity to the RXR ligand‐binding domain and activates it 21, 31, 35. Differentiated MN9D dopaminergic neuronal cells stably overexpressing human wt α‐Syn were incubated with increasing concentrations of 9‐cisRA (10–5000 nM) for 16–18 h. To control for the presence of the solvent, we treated sister cultures with dimethyl sulfoxide (DMSO) at a concentration equivalent to that in the highest concentration of 9‐cisRA. The effects of 9‐cisRA on the levels of α‐Syn oligomers were determined by Western blotting. The results indicated rising levels of α‐Syn oligomers in the presence of 9‐cisRA in a dose‐dependent manner (Figure 5B). To confirm that the effect of 9‐cisRA on α‐Syn oligomerization is mediated by RXR activation, we treated the cells with HX531, an RXR‐specific antagonist (48) (Figure 5B). Importantly, HX531 had no effect on α‐Syn oligomers when added alone (at 1 µM; not shown); however, when added together with the 9‐cisRA agonist, it reduced the levels of α‐Syn oligomers below control (DMSO‐treated) levels, confirming the involvement of RXR in mediating α‐Syn oligomerization.
Similar effects were obtained with A53T α‐Syn overexpressing MN9D cells. Specifically, 9‐cisRA enhanced α‐Syn oligomers by ∼2.5‐fold over the control levels. In accord, oligomer level was reduced below their level in the control sample when 9‐cisRA was added together with HX531 antagonist.
PPARγ2 activation enhances α‐Syn oligomerization in differentiated dopaminergic neuronal cells
Although homodimers of RXR are expected to be active, there is no specific information regarding the DNA element to which they bind. We therefore examined the possibility that PPARγ is a binding partner for RXR in α‐Syn oligomerization. HeLa cells stably overexpressing α‐Syn were transiently transfected with RXR only, RXR and PPARγ1, RXR and PPARγ2 or empty vector (see Methods section), and the levels of α‐Syn oligomers in the high‐speed supernatant were quantified by Western blotting. The results showed enhanced levels of α‐Syn oligomers in cells transfected with RXR‐only (see also above). Interestingly, while cotransfection of RXR and PPARγ1 prevented the formation of higher α‐Syn oligomers, the latter was enhanced by cotransfection of RXR and PPARγ2 (Figure 6A).
Figure 6.
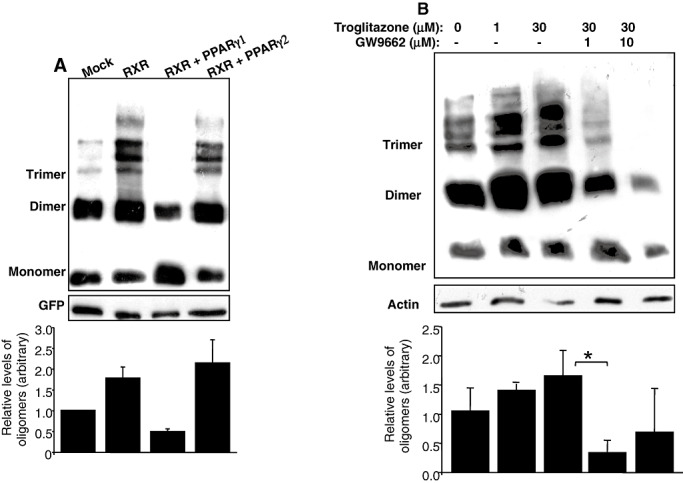
Enhanced α‐Synuclein (α‐Syn) oligomerization in response to PPARγ2 activation. A. HeLa cells stably expressing human ntg α‐Syn cDNA, were transiently transfected with retinoic X receptor (RXR) cDNA together peroxisome proliferator‐activated receptor (PPAR)γ1 or PPARγ2 cDNA (2 µg each) or mock DNA. Samples (15 µg protein) of post‐high‐speed supernatant were processed for oligomers detection by Western blot and probed with LB509 antibody. The levels of α‐Syn oligomers were normalized to green fluorescent protein (GFP) levels in the same sample and plotted as oligomers/monomer/GFP (bars). A representative blot, mean ± standard deviation (SD) of n = 3–5 repeats. B. Samples (15 µg protein) of differentiated MN9D cells stably expressing α‐Syn, conditioned 18 h in the indicated compounds. Samples were processed for α‐Syn oligomer detection by Western blot (WB) as in (A); bars represent the ratio of oligomers/monomer/actin. A representative blot, mean ± SD of n = 3–5 repeats. *, P < 0.01, t‐test.
To further assess the specific involvement of PPARγ in α‐Syn oligomerization, we tested the effect of the PPARγ agonist troglitazone. Differentiated MN9D dopaminergic neuronal cells stably overexpressing human wt α‐Syn were treated with increasing amounts of troglitazone (0–30 µM) or with its DMSO solvent for control. The levels of α‐Syn oligomerization were increased by troglitazone in a dose‐dependent manner. Furthermore, the specificity of the effect of PPARγ was examined by using the specific PPARγ antagonist, GW9662. Treatment with this antagonist at concentration as low as 1 µM abolished the oligomer‐enhancing effect of troglitazone, and treatment with 10 µM GW9662 led to lower α‐Syn oligomer levels, below those of DMSO‐treated cells (Figure 6B). Importantly, no significant effect on levels of α‐Syn oligomers were detected with GW9662 alone (not shown). We conclude that PPARγ, and specifically PPARγ2, contributes to the cellular mechanisms leading to α‐Syn oligomerization.
RXR activation enhances α‐Syn oligomerization in brain slices of A53T α‐Syn mice
We next sought to confirm the above enhancing effect of RXR on α‐Syn oligomerization in brain slices. A53T α‐Syn brain slices (300 µm) were incubated in oxygenated ACSF with increasing concentrations of 9‐cis‐RA agonist (10, 50 and 100 nM) at 33°C for 6 h. To control for the presence of the solvent, we incubated adjacent brain slices in DMSO at concentrations equivalent to those of the 9cis‐RA‐treated samples. The slices were then processed for α‐Syn oligomer detection by Western blotting with LB509 antibody. 9‐cis RA had an effect on α‐Syn oligomerization in the A53T α‐Syn brain slices (Figure 7). Specifically, a higher ratio of α‐Syn oligomers to monomer was detected in samples of brain slices treated with 50 and 100 nM 9‐cis‐RA than in the DMSO‐treated sample. Importantly, the oligomer‐enhancing effect of 100 nM 9‐cis‐RA was abolished in the presence of 100 nM HX531 antagonist, while the monomer level was unchanged (Figure 7).
Figure 7.
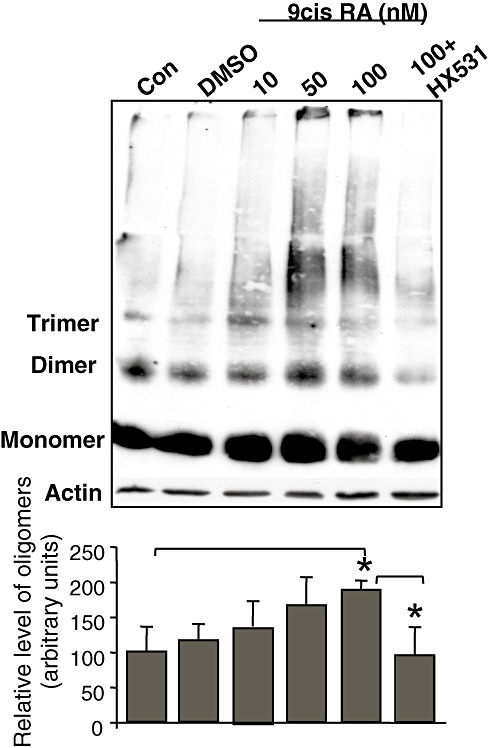
Activated retinoic X receptor (RXR) enhances α‐Synuclein (α‐Syn) oligomerization in brain slices of A53T α‐Syn mice. Transverse slices (300 µm) of A53T α‐Syn mouse brain (8 months old) were placed in a chamber containing oxygenated (95% O2/5% CO2) artificial cerebrospinal fluid (ACSF) at room temperature for 1 h. Slices were then incubated at 33°C for 6 h in oxygenated ACSF containing the indicated compounds. The slices were then collected and processed for α‐Syn oligomer detection by Western blotting as in Figure 5. A representative blot, mean ± standard deviation (SD) of n = 3–6 repeats. *, Kruskal–Wallis P < 0.05.
RXR activation mediates DHA effect on α‐Syn oligomerization
To directly test the involvement of RXR activation in DHA‐enhanced α‐Syn oligomerization, we incubated MN9D cells, stably overexpressing human wt α‐Syn for 16 h in serum‐free medium, supplemented with BSA only or BSA/DHA at molar ratio of 1:5 for BSA (0.02 mM) and FA (0.1 mM), respectively. The effect of specific antagonists for RXR was tested in sister cultures treated in parallel with BSA or BSA/DHA. Two specific RXR antagonists were tested, HX531 (48) and PA 452 (48), with similar results. The amount of DMSO solvent for the antagonists was held constant in all samples. After the overnight incubation, cells were collected and fractionated, and the levels of α‐Syn oligomers in the soluble fraction were determined by Western blotting. In line with the in vivo evidences above, 22:6 DHA enhanced the levels of α‐Syn oligomers by twofold to threefold compared with the sample treated with BSA only. Importantly, both HX531 and PA452 antagonists (at 0.1 and 1 µM) inhibited the enhancing effect of DHA, lowering the levels of α‐Syn oligomers to the level detected in the BSA‐only sample (Figure 8A).
Figure 8.
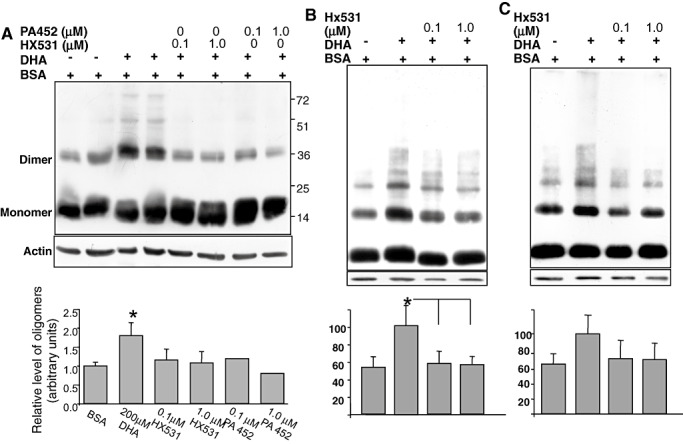
Docosahexaenoic acid (DHA) enhances α‐Synuclein (α‐Syn) oligomerization through retinoic X receptor (RXR) activation. A. Samples (20 µg protein) of MN9D cells stably expressing α‐Syn conditioned 18 h in serum‐free medium, supplemented with the indicated compounds. Samples were processed for α‐Syn oligomer detection by Western blot (WB) as in (Fig. 1A). Bars = oligomers/monomer/actin in the same sample [mean ± standard error (SE) of n = 3]. B. Brain slices of A53T α‐Syn mice as in Figure 7, treated with 100 µM DHA and HX531 antagonist at the indicated concentrations for 6 h. WB reacted with LB509 anti human α‐Syn antibody. C. Brain slices as in (B) but from ntg mice. WB reacted with syn‐1 anti α‐Syn antibody. *Kruskal–Wallis P < 0.05.
Finally, we sought to assess the specific involvement of RXR activation in DHA effect on endogenous and transgenic α‐Syn oligomerization in brain slices of ntg and A53T α‐Syn mice. For this aim, brain slices (300 µm) were incubated in oxygenated ACSF supplemented with BSA only or with DHA bound to BSA (at 1:3 molar ratio for BSA : DHA, respectively). DHA was added to the slices at a concentrations of 100 µM. The effect of HX531 antagonist (at concentrations of 0.1 and 1 µM) was tested at 33°C for 6 h. The slices were then processed for α‐Syn oligomer detection by Western blotting with Syn‐1 antibody for the ntg and LB509 antibody for the A53T α‐Syn brain sample. DHA enhanced α‐Syn oligomerization in both ntg and the A53T α‐Syn brain slices (Figure 8B,C). Specifically, a higher ratio of α‐Syn oligomers to monomer was detected in samples of brain slices treated with 100 µM DHA than in the BSA‐only treated sample. Importantly, the oligomer‐enhancing effect of DHA was abolished in both genotypes in the presence of 0.1 µM HX531 antagonist, while the monomer level was unchanged (Figure 8).
DISCUSSION
We investigated the effects of dietary DHA on α‐Syn‐related pathology in A53T α‐Syn tg mouse brains by comparing the effects of two diets that differed in their DHA content (ie, low and high DHA) and normalizing the results to standard mouse chow in mice otherwise handled identically within the same colony. Feeding A53T α‐Syn mice the DHA‐specific diets for ∼95 days affected α‐Syn protein levels, α‐Syn oligomerization/aggregation and α‐Syn cytopathology. Specifically, significantly higher levels of total α‐Syn immunoreactivity, of oligomers and of total α‐Syn accumulation within neuronal cells were observed in the brains of mice fed with the high‐DHA rather than the low‐DHA diet, as assessed by quantitative Western blotting and IHC. Following ∼95 days of high‐DHA diet, significant accumulation of α‐Syn was detected in the brain stem but not in the cortex of the A53T α‐Syn mice. In line with the appearance of α‐Syn accumulations, significantly higher GFAP and lower synaptophysin immunoreactivity were observed in the brain stem but not in the cortex of these high‐DHA‐fed mice, providing evidence of local neuronal injury at the site of the greater α‐Syn accumulations. In complementary findings, lower α‐Syn signal was detected by WB and IHC, and lower astrogliosis was seen in the brains of A53T α‐Syn mice fed with a low‐DHA (and low‐n‐3 PUFA) diet. Interestingly, following 230 days of feeding the respective DHA diets to A53T α‐Syn mice, there were significantly higher levels of α‐Syn accumulation in the brain stem, as well as in the cortex of the mice fed with the high DHA diet and in accord, neuronal injury was detected in these regions. In complementary findings, α‐Syn accumulation was lower in the brains of the A53T mice fed with the low‐DHA diet in parallel. To explain the effects of DHA on α‐Syn neuropathology, we thought to investigate its activating effect on certain members of the nuclear hormone receptor family. We found that activation of RXR and PPARγ2 each enhanced α‐Syn oligomerization and aggregation in differentiated, human α‐Syn‐expressing MN9D dopaminergic cells. Furthermore, activation of RXR by its ligand, 9‐cis retinoic acid, enhanced α‐Syn oligomerization and aggregation in A53T α‐Syn brain slices. Importantly, we show that enhanced α‐Syn oligomerization in response to DHA is controlled by RXR. Taken together, our results suggest that elevated brain DHA levels accelerate mechanisms of α‐Syn accumulation and oligomerization that involve specific activation of RXR and PPARγ2, leading to neurotoxicity.
We compared the effects of ∼95 vs. 230 days of feeding the high‐DHA diet as regards to its extent of α‐Syn cytopathology in the brains of A53T α‐Syn mice. Two brain regions were quantified for their α‐Syn levels, the brain stem and cortex. Following ∼95 days of the diet, significantly higher α‐Syn cytopathology was detected in the brain stem but not in the cortex. However, following 230 days of high‐DHA diet, significantly higher α‐Syn cytopathology was detected in both brain regions. This difference was not related to the age of the mice, as the mice of both the 95‐day and the 230‐day groups were 9–10 months at termination. This result suggests that prolonged exposure to elevated brain PUFA concentrations further enhances the accumulation of α‐Syn cytopathology.
The apparent time‐dependent “spread” of α‐Syn cytopathology from the brain stem to the cortex in response to the high‐DHA diet provokes a comparison to the Braak stages of α‐Syn pathology (5). This proposed staging scheme for PD is based on patterns of abnormal immunostaining for α‐Syn. According to the Braak scheme, α‐Syn pathology appears in an approximate temporal sequence, with the presumed earliest manifestation in the brain stem and the latest manifestation involving cortical areas.
Originally it was reported that this A53T α‐Syn mouse model developed age‐dependent intraneuronal α‐Syn‐positive lesions that are more common in the posterior parts of the brain, including the brain stem and specifically enriched in the spinal cord. These α‐Syn‐positive lesions correlate with disease onset and recapitulates features of LBs (18). However, in the mouse colony we bred to homozygocity, we found that α‐Syn pathology was indistinguishable from total transgenic α‐Syn protein expression, involving overall enhanced α‐Syn immunoreactivity 11, 32 within neuronal cell bodies and neurites. We considered the increased α‐Syn immunoreactivity obtained by IHC within neuronal cells as potentially cytotoxic α‐Syn, based on the findings that duplications and triplications of the human α‐Syn locus are associated with severe familial forms of PD 22, 47. Additionally, aging and α‐Syn pathology were recently shown to amplify α‐Syn expression and toxicity (11). Nevertheless, the enhanced α‐Syn accumulations observed in the high‐DHA‐fed mice did not correlate with appearance of disease symptoms. This could result from the experimental set up, terminated when mice reached the age of 9–10 months rather than testing the effect of the diets on time of death.
DHA is the in vivo activating ligand for RXR (14) and PPARγ[reviewed in (9)]. RXR belongs to the nuclear hormone receptor (NHR) ligand‐activated transcription factor family, of which it is an obligatory component, forming heterodimers with additional members of the NHR family, including PPARγ. We demonstrate here that activation of PPARγ2 but not PPARγ1, can significantly enhance α‐Syn oligomerization. This result suggests that RXR acts together with PPARγ2 to influence α‐Syn oligomerization. However, the NHR heterodimer that is specifically involved in α‐Syn oligomerization in vivo has yet to be determined. Moreover, the mechanism of action by which the NHRs are involved in α‐Syn oligomerization is still unknown. Nevertheless, the involvement of RXR and PPARγ in α‐Syn oligomerization discovered here adds to earlier evidence from numerous laboratories that brain lipid metabolism has a role in α‐Syn pathogenesis.
The finding that PPARγ2, but not PPARγ1, is involved in enhanced α‐Syn oligomerization is interesting in light of a recent report suggesting a role for PPARγ2 in longevity (1). The activation of NHRs such as PPARγ may therefore link aging and neurodegeneration, including aging and α‐Syn neuropathology.
The lowering effect of the low‐DHA diet on α‐Syn pathogenesis raises questions concerning the mechanisms involved in the accumulation of α‐Syn pathology. Specifically, do low DHA levels prevent the accumulation of toxic α‐Syn forms or rather affects its conformation, making it more available for degradation. An additional question concerns the activity of NHRs in lowering α‐Syn oligomerization in the presence of low brain DHA. Specifically, are different NHR involved in enhanced and reduced α‐Syn oligomers levels?
In this study we have utilized a transgenic mouse model, overexpressing the mutant A53T α‐Syn form, to in vivo examine the effects of brain DHA levels on α‐Syn neuropathology. Elevated DHA levels have similarly enhanced human wt α‐Syn oligomerization in cellular models. As α‐Syn oligomers precede aggregation and inclusion formation (2), it is plausible to suggest that wt and A53T α‐Syn respond to DHA in similar mechanisms.
The results presented herein suggest that elevated brain DHA levels accelerate mechanisms of α‐Syn neuropathology. In contrast, a growing number of reports on wild‐type mice describe various beneficial effects attributed to elevated PUFA and specifically, higher dietary DHA, on several aspects of brain structure and function, including neurodegeneration [for review, see (50)]. It is therefore important to emphasize that similar to these reports, we also observed beneficial effects with the high‐DHA diet in ntg mice. Specifically, enhanced synaptic number, represented by synaptophysin staining, was observed in the ntg mice (Figure 3B). Nevertheless, this beneficial effect could not overcome the adverse increase in α‐Syn expression in the A53T α‐Syn tg mouse brains. We found a lower signal for synaptophysin in young, nonsymptomatic A53T α‐Syn than in ntg mouse brains, a result that represents synaptic loss in this transgenic mouse model. Importantly, further reduction in synaptophysin signal is associated with regional accumulations of α‐Syn pathology. Specifically, we quantified the effect of dietary DHA in two brain regions, the brain stem and cortex, following 95 ± 5 or 230 days feeding. We detected higher levels of pathogenic α‐Syn accumulations and in accord, lower synaptophysin signal in the brain stem but not the cortex of A53T α‐Syn mice fed with the high‐DHA diet for 95 ± 5 days relative to those fed with the low DHA diet (2, 3). However, following 230 days of diet, both α‐Syn accumulations and synaptophysin levels were different in brain stem as well as in cortex of mice fed with the high‐ than the low‐DHA diet. This result suggests that α‐Syn pathogenic levels are strongly associated with synaptic loss. In this regard it is important to note that our finding concerning a deleterious role for DHA in α‐Syn pathogenesis is not supported by epidemiology.
Recently, the neuroprotective effects of n‐3 PUFA were demonstrated in 1‐methyl‐4‐phenyl‐1,2,3,6‐tetrahydrpyridine (MPTP) models of PD. Specifically, DHA was shown to have a neuroprotective effect on DA‐related motor function in a nonhuman primate model (42). Furthermore, a 10‐month‐long diet enriched with n‐3 PUFA prior to MPTP treatment was shown to protect against MPTP‐induced loss of TH‐positive neurons and against MPTP‐induced decrease in dopamine (4). While this study emphasizes the general neuroprotective effects of n‐3 PUFA observed in ntg mice and various neurodegenerative models, it is important to note that this model does not involve any α‐Syn cytopathology.
ACKNOWLEDGMENTS
We thank Dr. Yakov Fellig from the Department of Pathology, Hadassah Medical Organization for critical analyses of α‐Syn pathology. Supported by the National Institutes of Health (grant R01 NS051318), US–Israel binational foundation (RS and DJS) and the Leir Foundation (YY).
REFERENCES
- 1. Argmann C, Dobrin R, Heikkinen S, Auburtin A, Pouilly L, Cock TA et al (2009) Ppargamma2 is a key driver of longevity in the mouse. PLoS Genet 5:e1000752. [DOI] [PMC free article] [PubMed] [Google Scholar]
- 2. Assayag K, Yakunin E, Loeb V, Selkoe DJ, Sharon R (2007) Polyunsaturated Fatty Acids Induce {alpha}‐Synuclein‐Related Pathogenic Changes in Neuronal Cells. Am J Pathol 171:2000–2011. [DOI] [PMC free article] [PubMed] [Google Scholar]
- 3. Barcelo‐Coblijn G, Kitajka K, Puskas LG, Hogyes E, Zvara A, Hackler L Jr, Farkas T (2003) Gene expression and molecular composition of phospholipids in rat brain in relation to dietary n‐6 to n‐3 fatty acid ratio. Biochim Biophys Acta 1632:72–79. [DOI] [PubMed] [Google Scholar]
- 4. Bousquet M, Saint‐Pierre M, Julien C, Salem N Jr, Cicchetti F, Calon F (2008) Beneficial effects of dietary omega‐3 polyunsaturated fatty acid on toxin‐induced neuronal degeneration in an animal model of Parkinson's disease. FASEB J 22:1213–1225. [DOI] [PubMed] [Google Scholar]
- 5. Braak H, Ghebremedhin E, Rub U, Bratzke H, Del Tredici K (2004) Stages in the development of Parkinson's disease‐related pathology. Cell Tissue Res 318:121–134. [DOI] [PubMed] [Google Scholar]
- 6. Broersen K, van den Brink D, Fraser G, Goedert M, Davletov B (2006) Alpha‐synuclein adopts an alpha‐helical conformation in the presence of polyunsaturated fatty acids to hinder micelle formation. Biochemistry 45:15610–15616. [DOI] [PubMed] [Google Scholar]
- 7. Calon F, Cole G (2007) Neuroprotective action of omega‐3 polyunsaturated fatty acids against neurodegenerative diseases: evidence from animal studies. Prostaglandins Leukot Essent Fatty Acids 77:287–293. [DOI] [PubMed] [Google Scholar]
- 8. Calon F, Lim GP, Morihara T, Yang F, Ubeda O, Salem N et al (2005) Dietary n‐3 polyunsaturated fatty acid depletion activates caspases and decreases NMDA receptors in the brain of a transgenic mouse model of Alzheimer's disease. Eur J Neurosci 22:617–626. [DOI] [PubMed] [Google Scholar]
- 9. Chawla A, Repa JJ, Evans RM, Mangelsdorf DJ (2001) Nuclear receptors and lipid physiology: opening the X‐files. Science 294:1866–1870. [DOI] [PubMed] [Google Scholar]
- 10. Choi HK, Won LA, Kontur PJ, Hammond DN, Fox AP, Wainer BH et al (1991) Immortalization of embryonic mesencephalic dopaminergic neurons by somatic cell fusion. Brain Res 552:67–76. [DOI] [PubMed] [Google Scholar]
- 11. Chu Y, Kordower JH (2007) Age‐associated increases of alpha‐synuclein in monkeys and humans are associated with nigrostriatal dopamine depletion: is this the target for Parkinson's disease? Neurobiol Dis 25:134–149. [DOI] [PubMed] [Google Scholar]
- 12. Clayton DF, George JM (1998) The synucleins: a family of proteins involved in synaptic function, plasticity, neurodegeneration and disease. Trends Neurosci 21:249–254. [DOI] [PubMed] [Google Scholar]
- 13. Davidson WS, Jonas A, Clayton DF, George JM (1998) Stabilization of alpha‐synuclein secondary structure upon binding to synthetic membranes. J Biol Chem 273:9443–9449. [DOI] [PubMed] [Google Scholar]
- 14. de Urquiza AM, Liu S, Sjoberg M, Zetterstrom RH, Griffiths W, Sjovall J, Perlmann T (2000) Docosahexaenoic acid, a ligand for the retinoid X receptor in mouse brain. Science 290:2140–2144. [DOI] [PubMed] [Google Scholar]
- 15. Duda JE, Lee VM, Trojanowski JQ (2000) Neuropathology of synuclein aggregates. J Neurosci Res 61:121–127. [DOI] [PubMed] [Google Scholar]
- 16. Ellis CE, Murphy EJ, Mitchell DC, Golovko MY, Scaglia F, Barcelo‐Coblijn GC, Nussbaum RL (2005) Mitochondrial lipid abnormality and electron transport chain impairment in mice lacking alpha‐synuclein. Mol Cell Biol 25:10190–10201. [DOI] [PMC free article] [PubMed] [Google Scholar]
- 17. George JM, Jin H, Woods WS, Clayton DF (1995) Characterization of a novel protein regulated during the critical period for song learning in the zebra finch. Neuron 15:361–372. [DOI] [PubMed] [Google Scholar]
- 18. Giasson BI, Duda JE, Quinn SM, Zhang B, Trojanowski JQ, Lee VM (2002) Neuronal alpha‐synucleinopathy with severe movement disorder in mice expressing A53T human alpha‐synuclein. Neuron 34:521–533. [DOI] [PubMed] [Google Scholar]
- 19. Golovko MY, Rosenberger TA, Feddersen S, Faergeman NJ, Murphy EJ (2007) alpha‐Synuclein gene ablation increases docosahexaenoic acid incorporation and turnover in brain phospholipids. J Neurochem 101:201–211. [DOI] [PubMed] [Google Scholar]
- 20. Golovko MY, Barcelo‐Coblijn G, Castagnet PI, Austin S, Combs CK, Murphy EJ (2009) The role of alpha‐synuclein in brain lipid metabolism: a downstream impact on brain inflammatory response. Mol Cell Biochem 326:55–66. [DOI] [PubMed] [Google Scholar]
- 21. Heyman RA, Mangelsdorf DJ, Dyck JA, Stein RB, Eichele G, Evans RM, Thaller C (1992) 9‐cis retinoic acid is a high affinity ligand for the retinoid X receptor. Cell 68:397–406. [DOI] [PubMed] [Google Scholar]
- 22. Ibanez P, Bonnet AM, Debarges B, Lohmann E, Tison F, Pollak P et al (2004) Causal relation between alpha‐synuclein gene duplication and familial Parkinson's disease. Lancet 364:1169–1171. [DOI] [PubMed] [Google Scholar]
- 23. Innis SM (2008) Dietary omega 3 fatty acids and the developing brain. Brain Res 1237:35–43. [DOI] [PubMed] [Google Scholar]
- 24. Jump DB, Botolin D, Wang Y, Xu J, Demeure O, Christian B (2008) Docosahexaenoic acid (DHA) and hepatic gene transcription. Chem Phys Lipids 153:3–13. [DOI] [PMC free article] [PubMed] [Google Scholar]
- 25. Kitajka K, Sinclair AJ, Weisinger RS, Weisinger HS, Mathai M, Jayasooriya AP et al (2004) Effects of dietary omega‐3 polyunsaturated fatty acids on brain gene expression. Proc Natl Acad Sci USA 101:10931–10936. [DOI] [PMC free article] [PubMed] [Google Scholar]
- 26. Kliewer SA, Sundseth SS, Jones SA, Brown PJ, Wisely GB, Koble CS et al (1997) Fatty acids and eicosanoids regulate gene expression through direct interactions with peroxisome proliferator‐activated receptors alpha and gamma. Proc Natl Acad Sci USA 94:4318–4323. [DOI] [PMC free article] [PubMed] [Google Scholar]
- 27. Kodas E, Vancassel S, Lejeune B, Guilloteau D, Chalon S (2002) Reversibility of n‐3 fatty acid deficiency‐induced changes in dopaminergic neurotransmission in rats: critical role of developmental stage. J Lipid Res 43:1209–1219. [PubMed] [Google Scholar]
- 28. Lee CH, Olson P, Evans RM (2003) Minireview: lipid metabolism, metabolic diseases, and peroxisome proliferator‐activated receptors. Endocrinology 144:2201–2207. [DOI] [PubMed] [Google Scholar]
- 29. Lee VM, Trojanowski JQ (2006) Mechanisms of Parkinson's disease linked to pathological alpha‐synuclein: new targets for drug discovery. Neuron 52:33–38. [DOI] [PubMed] [Google Scholar]
- 30. Lengqvist J, Mata De Urquiza A, Bergman AC, Willson TM, Sjovall J, Perlmann T, Griffiths WJ (2004) Polyunsaturated fatty acids including docosahexaenoic and arachidonic acid bind to the retinoid X receptor alpha ligand‐binding domain. Mol Cell Proteomics 3:692–703. [DOI] [PubMed] [Google Scholar]
- 31. Levin AA, Sturzenbecker LJ, Kazmer S, Bosakowski T, Huselton C, Allenby G et al (1992) 9‐cis retinoic acid stereoisomer binds and activates the nuclear receptor RXR alpha. Nature 355:359–361. [DOI] [PubMed] [Google Scholar]
- 32. Li W, Lesuisse C, Xu Y, Troncoso JC, Price DL, Lee MK (2004) Stabilization of alpha‐synuclein protein with aging and familial parkinson's disease‐linked A53T mutation. J Neurosci 24:7400–7409. [DOI] [PMC free article] [PubMed] [Google Scholar]
- 33. Lim GP, Calon F, Morihara T, Yang F, Teter B, Ubeda O et al (2005) A diet enriched with the omega‐3 fatty acid docosahexaenoic acid reduces amyloid burden in an aged Alzheimer mouse model. J Neurosci 25:3032–3040. [DOI] [PMC free article] [PubMed] [Google Scholar]
- 34. Loeb V, Yakunin E, Saada A, Sharon R (2010) The transgenic over expression of {alpha}‐Synuclein and not its related pathology, associates with complex I inhibition. J Biol Chem 285:7334–7343. [DOI] [PMC free article] [PubMed] [Google Scholar]
- 35. Mangelsdorf DJ, Borgmeyer U, Heyman RA, Zhou JY, Ong ES, Oro AE et al (1992) Characterization of three RXR genes that mediate the action of 9‐cis retinoic acid. Genes Dev 6:329–344. [DOI] [PubMed] [Google Scholar]
- 36. Marszalek JR, Lodish HF (2005) Docosahexaenoic acid, fatty acid‐interacting proteins, and neuronal function: breastmilk and fish are good for you. Annu Rev Cell Dev Biol 21:633–657. [DOI] [PubMed] [Google Scholar]
- 37. Masliah E, Rockenstein E, Adame A, Alford M, Crews L, Hashimoto M et al (2005) Effects of alpha‐synuclein immunization in a mouse model of Parkinson's disease. Neuron 46:857–868. [DOI] [PubMed] [Google Scholar]
- 38. Moore DJ, West AB, Dawson VL, Dawson TM (2005) Molecular pathophysiology of Parkinson's disease. Ann Rev Neurosci 28:57–87. [DOI] [PubMed] [Google Scholar]
- 39. Paxinos G, Franklin KBJ (2004) The Mouse Brain in Stereotaxic Coordinates, 2nd edn. Academic Press: San Diego, CA. [Google Scholar]
- 40. Perrin RJ, Woods WS, Clayton DF, George JM (2001) Exposure to long chain polyunsaturated fatty acids triggers rapid multimerization of synucleins. J Biol Chem 276:41958–41962. [DOI] [PubMed] [Google Scholar]
- 41. Rappley I, Myers DS, Milne SB, Ivanova PT, Lavoie MJ, Brown HA, Selkoe DJ (2009) Lipidomic profiling in mouse brain reveals differences between ages and genders, with smaller changes associated with alpha‐synuclein genotype. J Neurochem 111:15–25. [DOI] [PMC free article] [PubMed] [Google Scholar]
- 42. Samadi P, Gregoire L, Rouillard C, Bedard PJ, Di Paolo T, Levesque D (2006) Docosahexaenoic acid reduces levodopa‐induced dyskinesias in 1‐methyl‐4‐phenyl‐1,2,3,6‐tetrahydropyridine monkeys. Ann Neurol 59:282–288. [DOI] [PubMed] [Google Scholar]
- 43. Shankar GM, Leissring MA, Adame A, Sun X, Spooner E, Masliah E et al (2009) Biochemical and immunohistochemical analysis of an Alzheimer's disease mouse model reveals the presence of multiple cerebral Abeta assembly forms throughout life. Neurobiol Dis 36:293–302. [DOI] [PMC free article] [PubMed] [Google Scholar]
- 44. Sharon R, Goldberg MS, Bar‐Josef I, Betensky RA, Shen J, Selkoe DJ (2001) alpha‐Synuclein occurs in lipid‐rich high molecular weight complexes, binds fatty acids, and shows homology to the fatty acid‐binding proteins. Proc Natl Acad Sci USA 98:9110–9115. [DOI] [PMC free article] [PubMed] [Google Scholar]
- 45. Sharon R, Bar‐Joseph I, Frosch MP, Walsh DM, Hamilton JA, Selkoe DJ (2003) The formation of highly soluble oligomers of alpha‐synuclein is regulated by fatty acids and enhanced in Parkinson's disease. Neuron 37:583–595. [DOI] [PubMed] [Google Scholar]
- 46. Sharon R, Bar‐Joseph I, Mirick GE, Serhan CN, Selkoe DJ (2003) Altered fatty acid composition of dopaminergic neurons expressing alpha‐synuclein and human brains with alpha‐synucleinopathies. J Biol Chem 278:49874–49881. [DOI] [PubMed] [Google Scholar]
- 47. Singleton AB, Farrer M, Johnson J, Singleton A, Hague S, Kachergus J et al (2003) alpha‐Synuclein locus triplication causes Parkinson's disease. Science 302:841. [DOI] [PubMed] [Google Scholar]
- 48. Suzuki K, Takahashi K, Nishimaki‐Mogami T, Kagechika H, Yamamoto M, Itabe H (2009) Docosahexaenoic acid induces adipose differentiation‐related protein through activation of retinoid x receptor in human choriocarcinoma BeWo cells. Biol Pharm Bull 32:1177–1182. [DOI] [PubMed] [Google Scholar]
- 49. Wurtman RJ (2008) Synapse formation and cognitive brain development: effect of docosahexaenoic acid and other dietary constituents. Metabolism 57(Suppl. 2):S6–10. [DOI] [PMC free article] [PubMed] [Google Scholar]
- 50. Yehuda S, Rabinovitz S, Mostofsky DI (2005) Essential fatty acids and the brain: from infancy to aging. Neurobiol Aging 26(Suppl. 1):98–102. [DOI] [PubMed] [Google Scholar]
- 51. Zimmer L, Delion‐Vancassel S, Durand G, Guilloteau D, Bodard S, Besnard JC, Chalon S (2000) Modification of dopamine neurotransmission in the nucleus accumbens of rats deficient in n‐3 polyunsaturated fatty acids. J Lipid Res 41:32–40. [PubMed] [Google Scholar]