Abstract
The plastic changes in the auditory cortex induced by a fear conditioning, through pairing a sound (CS) with an electric foot-shock (US), were investigated using an optical recording method with voltage sensitive dye, RH795. In order to investigate the effects of association learning, optical signals in the auditory cortex in response to CS (12 kHz pure tone) and non-CS (4, 8, 16 kHz pure tone) were recorded before and after normal and sham conditioning. As a result, the response area to CS enlarged only in the conditioning group after the conditioning. Additionally, the rise time constant of the auditory response to CS significantly decreased and the relative peak value and the decay time constant of the auditory response to CS significantly increased after the conditioning. This study introduces an optical approach to the investigation of fear conditioning, representational plasticity, and the cholinergic system. The findings are synthesized in a model of the synaptic mechanisms that underlie cortical plasticity.
Keywords: Auditory cortex, Optical imaging, Voltage sensitive dye, Fear conditioning, Plastic change
Introduction
In sensory cortex, stimulus information is spatially represented, while the anatomical correspondence is maintained. During the past 20 years there has been a paradigmatic shift in the understanding of the primary sensory cortices, most extensively in the primary auditory cortex (A1). Tuning properties were traditionally assumed to be fixed in adulthood after a critical period of developmental plasticity. However, it was found on the basis of many experimental results that this spatial representation in the cortex shows plasticity as a function of learning and experience even after an individual matures (Buonomano and Merzenich 1998; Gilbert 1998). It was also found that tuning properties can be modified rapidly (after only five training trials, in the guinea pig) to emphasize the frequency of sounds that are behaviorally relevant (Edeline et al. 1993). The first reports of signal-specific receptive field tuning shifts during fear conditioning predicted an expanded representation in the tonotopic map, as was later confirmed by Recanzone et al. (1993).
Recent work indicates that the synaptic mechanisms underlying long-term sensory cortical plasticity is a complex, multi-component process involving multiple synaptic and cellular mechanisms. Important issues include sensory use, disuse, long-term potentiation and depression (LTP and LTD) driven by training, homeostatic synaptic plasticity and plasticity of intrinsic excitability, and structural changes following the formation, removal, and morphological remodeling of cortical synapses and dendritic spines (Feldman 2009). Here, we focus on the hypothesis that such plastic changes in the cortex are caused by synaptic plasticity, especially by LTP of the synapse (Buonomano and Merzenich 1998; Finnerty et al. 1999). Although LTP was discovered in dentate gyrus in hippocampus (Bliss and LÁmo 1973) and has been minutely investigated especially in hippocampus (Bliss and Collingidge 1993), it has been reported that LTP also occurs in the cortex both in vivo and in vitro (Kirkwood et al. 1993; Trepel and Racine 1998), and in a theoretical study (Kaneki et al. 2009). The above hypothesis is based on this evidence. To further substantiate this hypothesis, we employed the optical imaging method with a voltage sensitive dye (Cohen et al. 1978; Grinvald et al. 1988; Horikawa et al. 1996, 2001). The optical imaging method has recently attracted attention as one of the useful methods for investigating the dynamic function of the brain. This method is different from conventional measuring methods such as direct insertion of microelectrodes into the brain, in that it can measure from several hundreds to ten thousands of neurons simultaneously and on the order of millisecond.
In this work, the conditioning and measurement were carried out under ketamine anesthesia because even small oscillations can produce large noise for optical imaging. Though reports of conditioning carried out under anesthesia are few, Edeline and Massioui (1988) observed that it was possible to induce fear conditioning through a pairing acoustic information and electric foot-shock under ketamine anesthesia. Therefore, a similar protocol for the fear conditioning was used in this work.
Fear conditioning using sound and electric stimuli is common in research on emotional memory (for a theoretical analysis, see Howe and Levy 2007), but many studies of plasticity in the auditory cortex have also employed this paradigm (LeDoux 2000; Maren 2001). Bakin and Weinberger (1990) reported that receptive fields in the auditory cortex are plastically changed by fear conditioning and the best frequency strongly tunes to the frequency used for the conditioning. Furthermore, they reported that such plastic changes in receptive fields could occur after as few as five pairings of sound and foot-shock (Edeline and Weinberger 1993), and lasted as long as 8 weeks (Weinberger et al. 1993).
It is well established that the primary auditory cortex, and some other adjacent auditory fields, contain tonotopic maps, that is, systematic representations of acoustic frequency (e.g., reviewed in Read et al. 2002). Insofar as such maps are comprised of the preferential tuning of neurons across these fields, and frequency tuning is shifted during learning, it might be expected that the signal frequency would develop an expanded representation in the map during auditory fear conditioning. Such frequency-specific increase in representational area has been found in instrumental reward tasks involving training over months or weeks (Recanzone et al. 1993; Rutkowski and Weinberger 2005; Hui et al. 2009; Bieszczad and Weinberger 2010a, b). However, still unknown is whether such map expansions can develop as rapidly as tuning shifts (Edeline et al. 1993; Weinberger 2004). Also unknown is whether map plasticity develops in aversive or fear-related situations. The current experiment addressed both problems by obtaining frequency map information before and after a single training session of auditory fear conditioning.
Methods
Preparation
The experiments were performed in accordance with the guidelines of the Animal Experiments Committee of Tamagawa University. The experimental subjects were female guinea pigs of 250–450 g, 3–4 weeks old. The body temperature of an animal was maintained at 37°C by using the blanket system for animals (MK-900, Muromachi Kikai Co., LTD.) during the experiment. Each animal was anesthetized with a mixture of Ketamine (40 mg/kg, i.m.) and Xylazine (20 mg/kg, i.m.), and then anesthesia was maintained by supplementary doses of a mixture of Ketamine (20 mg/kg, i.m.) and Xylazine (10 mg/kg, i.m.). The trachea was cannulated and the head was cramped. The scalp was detached and a hole (approximately 8 by 8 mm square) was drilled in the left temporal bone and the dura and arachnoid membrane were removed. The auditory cortex was stained for 40–60 min with a voltage-sensitive dye, RH795 (0.125 mg/ml, dissolved in saline; molecular Probes). Then, the animal was artificially respirated after inducing paralysis with pancuronium bromide (0.2 mg/kg, i.m.). The experiments were carried out in a dark soundproof room. After the end of the experiment, each animal was administrated with an overdose of Nembutal and cardiac arrest was monitored.
Fear conditioning
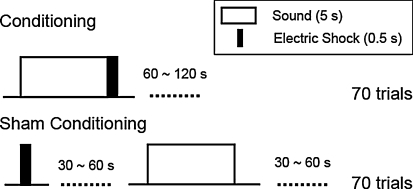
In this work, fear conditioning was carried out by using sound stimuli (as conditioned stimulus, CS) and electric foot shocks (as unconditioned stimulus, US). A normal conditioning group (Normal, n = 5), and a sham-conditioning group (Sham, n = 5) were prepared. The sham-conditioning group served as control group, with the same sound and electric stimuli but without conditioned learning. A pure tone (duration: 5 s, frequency: 12 kHz, sound level: 65 dB SPL) was presented to the right ear of the guinea pig as CS, and an electric shock (duration: 0.5 s, current intensity: 0.5–1.5 mA) was applied to the hind legs as US. The normal and sham conditioning protocols are shown in Fig. 1. In the normal conditioning group, the electric shock was applied just after the sound presentation, this paring was defined to be one trial, and 70 trials were carried out in total. The interval between each trial was randomly 60–120 s. In the sham-conditioning group, the sound stimulus and the electric foot shock were strictly separated in order to prevent conditioning. The interval between electric shock and sound stimulus and that between sound stimulus and electric shock were randomly 30–60 s. As in the normal conditioning group, in the sham-conditioning group, the sound stimulus and the electric shock were repeated 70 times, respectively. It took approximately 2 h to complete all the trials. In order to investigate the effects of conditioning on the auditory cortex, auditory responses were recorded by optical imaging method before and after the conditioning.
Fig. 1.
Normal conditioning and sham conditioning protocol
The waveform of sound stimuli was generated by MATLAB (Version 6.5, Mathworks). The waveform data generated by MATLAB was sent as analog signal through the AD converter board (PCI-3337, Interface) installed in the personal computer. This signal was transmitted via a high-frequency speaker (ED1, ES1: 1041, Tucker-Davis Technologies) through an attenuator (PA5, Tucker-Davis Technologies), and then presented to the right ear of the guinea pig. The electrodes for the foot-shock were attached the hind legs using conductive paste. The electric shock (pulse width: 5 ms, frequency: 60 Hz, duration: 0.5 s) was generated by using a stimulator (SEN-7203, Nihon Kohden) and was applied to the hind legs through an isolator (SS-202 J, Nihon Kohden). The current intensity was adjusted within the range of 0.5–1.5 mA. The condition of the animal was monitored by ECG (Electrocardiogram) throughout the experiment.
Optical recording
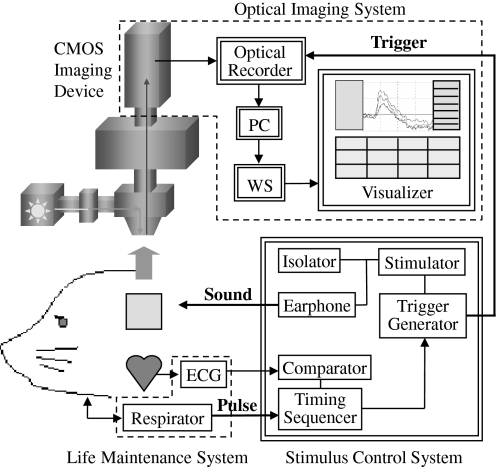
Optical recording was carried out before and after the conditioning, and was accompanied with four kinds of pure tones with a frequency of 4, 8, 12 and 16 kHz (duration: 30 ms, sound level: 65 dB SPL). Figure 2 shows a schematic view of the optical recording system. An epi-illumination fluorescence microscopy (150 W halogen-tungsten lamp, 540 ± 30 nm band-pass filter, 580 nm dichroic mirror, 600 nm long-pass filter, ×1 magnification, NA 0.26) was used for measuring neuron activity of auditory cortex. A 100 × 100 ch CMOS imaging device (MiCAM ULTIMA-L, Brainvision Inc., Tokyo) was used to record the fluorescent signals from the brain surface. The amplified optical image data was sampled via a 12bit A/D converter and sent to a workstation with 2.0 ms time resolution. In order to gain a sufficient S/N, optical data of 16 trials were averaged. The respirator was stopped for a few seconds in order to eliminate the oscillation noise originating from respiration. Noise originating from heart pulsation was reduced by synchronizing the recording with the R-wave in the ECG and subtracting the recording without stimulus from that with stimulus. The illumination was turned on only during the recording period to minimize dye bleaching.
Fig. 2.
A schematic view of the optical recording system
ECG and CR
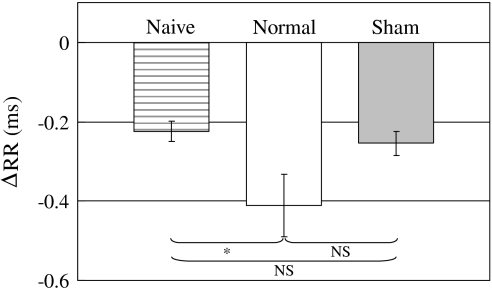
In fear conditioning research, freezing and heart rate variation are usually used as the index of CR. In this work, three groups (normal conditioning, sham conditioning, and naïve) were prepared and ECG was measured after the normal/sham conditioning under anesthesia in order to confirm CR (Conditioned response). In the naïve group, six guinea pigs were prepared as a control; they underwent no CS and US stimuli before ECG measurement. ECG was measured for 20 s in a trial. CS (duration: 5 s, frequency: 12 kHz, sound level: 65 dB SPL) was presented during 5 s at a time region of 5–10 s in a trial. The largest peak of the ECG amplitude is called the R wave. In the present study, the variation of the R–R interval was used as the index of the heart rate variation. Therefore, ΔRR, that is, the change of the R–R interval, was investigated. ΔRR was defined as: ΔRR(t) = RR(t) − RRm, where RR(t) is the R–R interval at a certain time t, and RRm is the mean value of the R–R interval during 5 s prior to the CS onset. The ΔRR shown in Fig. 6 is the mean value of ΔRR(t) during 10 s after CS onset. A negative ΔRR value indicates that the heart rate increases and a fear response is present.
Fig. 6.
Comparison of ΔRR in the three groups of normal/sham conditioning and naïve. ΔRR is change of R–R interval during 10 s after CS onset. (Error bar is SEM. Naïve: n = 6, Normal: n = 5, Sham: n = 5, * P < 0.05, NS no significant differences)
Data analysis
The following processing was carried out on the optical recording data. First, in order to correct for the difference of background fluorescence intensity, each optically detected activity was expressed as the ratio ΔF/F, where F and ΔF were the light intensity at rest and the change in intensity induced by neuronal responses, respectively. Next, in order to eliminate the noise originating from heart pulsation, data recorded without any stimulus was subtracted from data recorded with each stimulus. Finally, in order to reduce noises such as shot noise, a 3 × 3 spatial median filter was used.
In the current study, the effect of conditioning was investigated by comparing the auditory response area, where the calculation of the response area was carried out according to the following procedure. First, the time of the peak response was computed for all the imaging data because the onset latency differs in each case according to the sound frequency. Then, the image at the time when the maximum number of pixels was at peak intensity was defined as the typical image for the data. Next, in order to correct for the difference of response owing to the difference of acoustic stimulus, the threshold was set to 40% of the maximum intensity in the typical image with a peak width at half-height. The response area of the typical image with intensity beyond the threshold was defined as the response area for the data in question.
Results
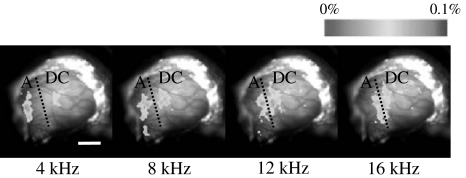
First, neural activities in auditory cortex for each pure tone with a frequency of 4, 8, 12 and 16 kHz were observed by using the optical imaging method in order to confirm the tonotopic map in the auditory cortex of guinea pig. Figure 3 shows the tonotopic map in the auditory cortex of a guinea pig for each pure tone. In order to clarify the tonotopic map, the threshold was set at 60% of the maximum intensity of the auditory response. The fluctuation ratio of the response intensity beyond the threshold was converted to pseudo-color represented in the color bar. The response intensity below the threshold was represented by grayscale in the background. The left and upper sides in Fig. 3 represent rostral and dorsal, respectively. The length of the white solid line in the figure represents 2 mm.
Fig. 3.
Tonotopic map in the auditory cortex of guinea pig
It has already been established using microelectrode recording that field A and field DC have tonotopicity in the rostral and caudal side of the auditory cortex of guinea pig, respectively (Redies et al. 1989; Wallace et al. 2000). In field A, cells that respond to a sound are arranged from rostral to caudal direction with increasing sound frequency. In contrast, in field DC, cells are arranged from caudal to rostral direction with increasing sound frequency. Figure 3 shows a trend of mirror-symmetrical tonotopic mapping in fields A and DC, similar to previous findings on the basis of microelectrode methods (Redies et al. 1989; Wallace et al. 2000) and optical imaging (Horikawa et al. 2001).
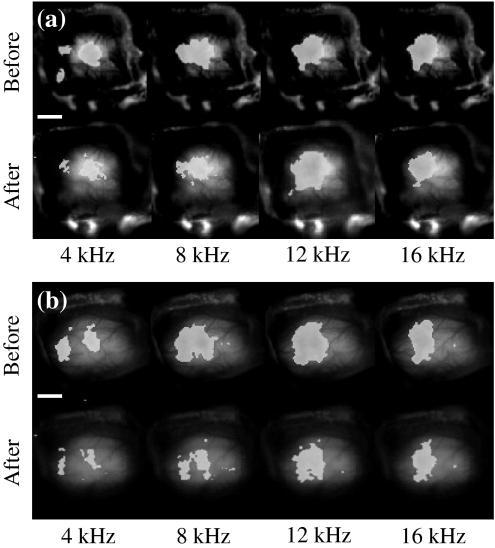
Second, in order to investigate the plastic changes of the auditory response induced by fear conditioning, auditory responses to a pure tone with a frequency of 4, 8, 12 and 16 kHz were recorded by optical imaging before and after the conditioning. Figure 4 shows auditory responses to each pure tone recorded before and after the fear conditioning in the normal and sham conditioning groups. The white solid line in the image represents 2 mm. It was found from the result of Fig. 4a that the auditory response area markedly increased only for CS (12 kHz) after the conditioning, while such an increase of the auditory response area could not be observed for the other non-CS sounds (4, 8 and 16 kHz). The auditory response recorded by optical imaging usually tends to show a decrease in the intensity and the size of the response area a few hours after the staining due to several factors, such as a bleaching, photo damage and depression of cell activity induced by toxicity of the dye. Yet, despite the possible presence of such factors, the auditory response area for the CS sound (12 kHz) increased even after 2 h of conditioning, as evident in Fig. 4a.
Fig. 4.
a Auditory responses to CS (12 kHz) and non-CS (4, 8, 16 kHz) recorded before and after the normal conditioning. b Auditory responses to CS (12 kHz) and non-CS (4, 8, 16 kHz) recorded before and after the sham conditioning
The non-CS sounds (4, 8 and 16 kHz) were presented to the guinea pig exclusively during the optical recording, whereas, the CS sound (12 kHz) was repeated 70 times during the fear conditioning. Therefore, the possibility that the enlargement of the auditory response area to CS (12 kHz) was induced not by fear conditioning, but by the mere repetition of the same sound should be eliminated. For this reason, we prepared a sham-conditioning group. In this group, the same 12 kHz pure tone and electric foot shock were used, and also the number of stimulus repetitions was the same as in the normal conditioning group. However, the protocol for the sham-conditioning group prevented associative learning by presenting CS and US non-contiguously and in reversed order. Figure 4b shows the auditory responses for each pure tone recorded before and after the sham conditioning in the sham-conditioning group. No increase of auditory response area could be observed for any of the CS and non-CS sounds after sham conditioning. This negative finding confirms that not repetition, but fear conditioning was the crucial factor causing the increased response area to CS after conditioning in the normal conditioning group.
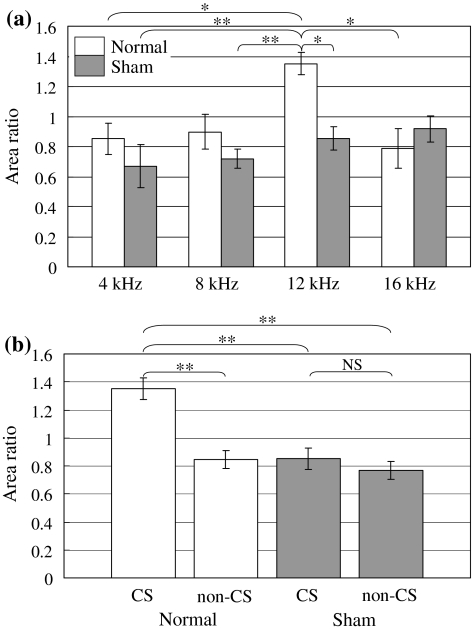
Next, the activated area in the auditory cortex was quantitatively compared before and after the normal/sham conditioning. Figure 5a shows the area ratio of each group at a sound frequency of 4–16 kHz. The area ratio is defined as follows: area ratio = auditory activated area measured after the conditioning/auditory activated area measured before the conditioning. We found that the area ratio of CS (12 kHz) in the normal conditioning group showed a significant increase compared to that of 4 and 16 kHz in the normal conditioning group, and 4, 8 and 12 kHz in the sham-conditioning group. Figure 5b shows the comparison of the area ratio among 4 groups: normal, sham, non-CS and CS. The area ratio of CS (12 kHz) in the normal conditioning group showed significant increase compared to the other three groups.
Fig. 5.
a Area ratio of each group at the sound frequency of 4–16 kHz. b Comparison of area ratio between normal, sham, non-CS and CS groups. (Error bar is SEM. Normal: n = 5, Sham: n = 5, * P < 0.05; ** P < 0.01, NS no significant differences)
Figure 6 shows the comparison of ΔRR in the three groups of normal conditioning, sham conditioning and naïve. White and gray bars represent the ΔRR measured after normal/sham conditioning. The gray striped bar represents the ΔRR in the naïve group. In the naïve group, the guinea pigs did not undergo any sound or electric stimuli before the ECG measurement. The three bars also represent the mean value of ΔRR measured for 10 s after CS onset. Error bars are SEM, n = 6 in the naïve group and n = 5 in each of the normal and sham conditioning groups. There was no significant difference between the normal and the sham conditioning group; there was also no significant difference between the naïve and the sham conditioning group. However, there was a significant difference between the naïve and the normal conditioning group (P < 0.05), suggesting that the guinea pigs in the normal conditioning group were fear conditioned.
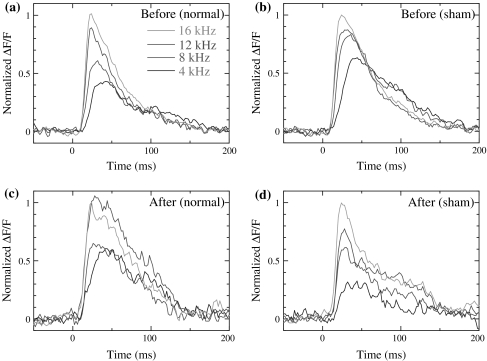
Figure 7 shows the time course of the auditory response to CS (12 kHz) and non-CS (4, 8 and 16 kHz) recorded before and after the conditioning in the normal/sham conditioning groups. The data represent single pixel data of the field A in the frequency map that showed the maximum optical response. The vertical axis shows the normalized ΔF/F, where optical response ΔF/F at each frequency was normalized by the optical response at 16 kHz because this was the largest and most stable of all frequencies. The solid lines colored blue, red, green and orange show the normalized optical response to 4, 8, 12 and 16 kHz, respectively. A large increase of peak value and activity after the peak response was observed only at 12 kHz after the normal conditioning. Such an increase was not observed for the other non-CS sounds in the conditioning group and for any of the CS and non-CS sounds in the sham-conditioning group. In order to evaluate the changes quantitatively, we compared the peak value, rise time and decay time constant of the time course of the optical responses.
Fig. 7.
Time course of normalized ΔF/F at 4–16 kHz a before and b after normal conditioning. Time course of normalized ΔF/F at 4–16 kHz c before and d after sham conditioning
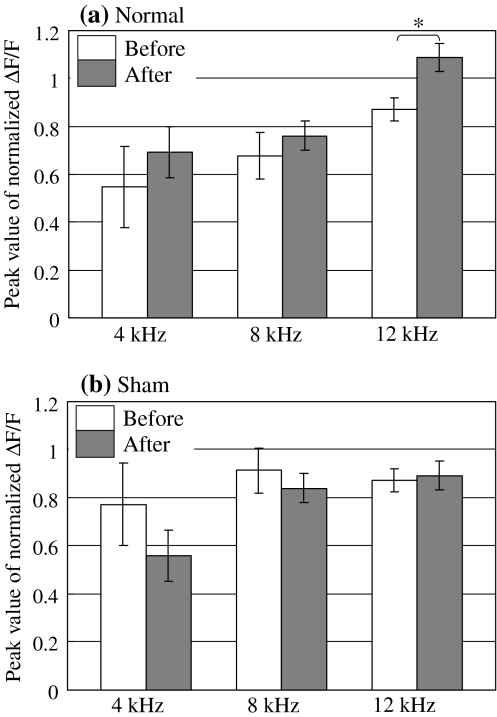
Figure 8a shows the peak value of the normalized ΔF/F in the normal conditioning group; Fig. 8b shows the data for the sham-conditioning group. A significant increase of the peak value of the normalized ΔF/F was observed only at 12 kHz (CS) in the normal conditioning group (P < 0.05).
Fig. 8.
a Peak value of normalized ΔF/F at 4–12 kHz before and after normal conditioning. b Peak value of normalized ΔF/F at 4–12 kHz before and after sham conditioning. (Error bar is SEM. Normal: n = 5, Sham: n = 5, * P < 0.05)
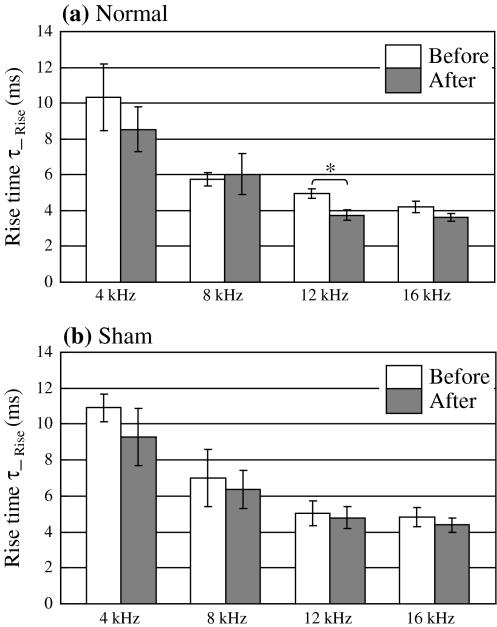
Figure 9 shows the rise time constant of the ΔF/F in the normal conditioning group (a) versus the sham-conditioning group (b). The rise time constant was calculated by fitting with an exponential curve of y = A*exp {B*(t − C)/τ_Rise}. A significant decrease of the rise time constant was observed only at 12 kHz (CS) in the normal conditioning group (P < 0.05).
Fig. 9.
a Rise time constant of optical response at 4–16 kHz before and after normal conditioning. b Rise time constant of optical response at 4–16 kHz before and after sham conditioning. (Error bar is SEM. Normal: n = 5, Sham: n = 5, * P < 0.05)
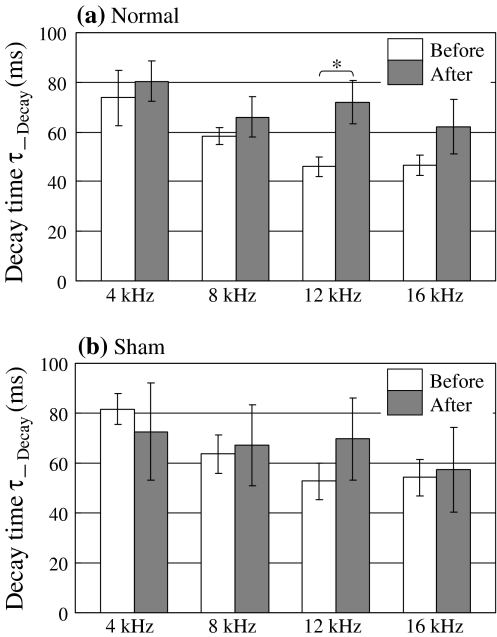
Figure 10 shows the decay time constant of optical response ΔF/F in the normal conditioning group (a) and in the sham-conditioning group (b). The decay time constant was calculated by fitting with an exponential curve of y = A*exp {−B*(t − C)/τ_Decay}. This measure showed a significant increase only at 12 kHz (CS) in the normal conditioning group (P < 0.05).
Fig. 10.
a Decay time constant of optical response at 4–16 kHz before and after normal conditioning. b Decay time constant of optical response at 4–16 kHz before and after sham conditioning. (Error bar is SEM. Normal: n = 5, Sham: n = 5, * P < 0.05)
Discussion
Through optical imaging, we found that the activated area of auditory cortex enlarged significantly for the CS sound only in the normal conditioning group (Figs. 4, 5). Moreover, The ECG measurements as shown in Fig. 6 indicated that the guinea pigs showed a significant CR only in the normal conditioning group. This was verified by means of the changes of R–R interval. The result suggested that the enlarged activation area of auditory cortex in response to the CS sound reflected cortical plastic change induced by fear conditioning. In principle, it would appear possible that the subjects in the sham conditioning group underwent a well-known type of inhibitory learning, given that the shocks did not follow the presentation of tones, implying that the tones could function as safety signals (Shimoff 1972). However, Fig. 5b shows no significant differences between the area ratio of CS (12 kHz) and non-CS (4, 8, 16 kHz), suggesting that the sham conditioning group exhibited no inhibitory learning.
It has already been reported that large plastic changes can be induced in the tonotopic map of auditory cortex after long-term training (Recanzone et al. 1993). Here we were able to confirm that plastic changes were induced in the tonotopic map only in a few hours of the conditioning, resulting that the plastic changes were induced in the tonotopic map in a few hours of the conditioning. It is possible that receptive field changes at the single-cell level closely relate to the reorganization in the tonotopy map. Indeed, data suggestive of such a process have been reported in the basal forebrain (Kilgard and Merzenich 1998). In this study, changes of the tonotopic map were observed with an experimental protocol similar to that by Weinberger et al. (1993) in a study that showed receptive field plasticity after short-term training. These results suggest that changes of the receptive field and reorganization of the tonotopic map occurred simultaneously within a few hours after the conditioning.
The area enlargement for the CS sound after the normal conditioning suggests that the activity affected neighboring regions, adjacent to the core area of the CS sound, which were not activated before the conditioning. It has been reported that the excitatory postsynaptic potential (EPSP) on the dendrites is involved in the optical response from the cortex observed by in vivo optical imaging with voltage sensitive dye (Grinvald et al. 1994; Horikawa et al. 1996). It is conceivable that fear conditioning promoted the efficiency of synaptic transmission in the core and/or border area of the CS sound.
It has been reported that LTP enhanced neural activities by approximately 150% compared to control conditions, typically in both the slope and the amplitude of EPSP, both in vitro and vivo (Diamond et al. 1988; Fazeli et al. 1993; Kudoh and Shibuki 1997; Fujii et al. 1999, 2000; Yamazaki et al. 2002; Taufiq et al. 2005; Gruart et al. 2006; Karpova et al. 2006; Tsukada et al. 2007; Campanac and Debanne 2008; Chen et al. 2009). In the present study, the amplitude of EPSP increased up to approximately 125% compared to the level before conditioning, as shown in Fig. 8a. The measure of, 1/τ_Rise in EPSP, corresponding to the slope of EPSP reported in the previous papers, increased up to 133% as compared to levels before conditioning as shown in Fig. 9a. These results imply that the plastic changes of the auditory cortex in this study are most likely based on LTP.
Cerebral cortex consists of six layers, and it has been understood that the difference of information processing depending on each layer is important. It has been reported that optical imaging may record neuronal responses mainly from layers II and III in the cerebral cortex (Horikawa et al. 1996; Lippert et al. 2006), implying that synaptic plasticity may have been induced in these layers of the auditory cortex in the present study. These results correspond to reports that layers II and III of the barrel cortex play an important role in cortical plastic changes (Huang et al. 1998) and that LTP can be induced in the horizontal connections in layers II and III of the motor cortex (Hess et al. 1996).
Pharmacological experimental data in vivo have shown that responses for acoustic stimuli recorded by optical imaging consist of the following three main components: (1) non-NMDA (N-methyl-D-aspartate) glutamate receptor dependent excitatory postsynaptic potential (EPSP), which is a fast response component (2) NMDA glutamate receptor dependent EPSP, which is a slow response component and (3) GABA (γ-amino butyric acid) receptor dependent inhibitory postsynaptic potential (IPSP) (Horikawa et al. 1996). Furthermore, it has been reported that neural circuits involving the medial geniculate body, the amygdale, the basal forebrain and the auditory cortex are very important for fear conditioning using sound and foot-shock, and that plastic changes in the auditory cortex are induced by the release of acetylcholine (ACh) from the basal forebrain to cortex during conditioning (Weinberger and Bakin 1998; Edeline 1999).
Finally, it has also been reported that ACh affects NMDA glutamate receptors in layers II and III of cortex and promotes plastic changes in auditory cortex (Rasmusson 2000; Bandrowski et al. 2001; Metherate and Hsieh 2003). Metherate and Ashe (1993) found that muscarinic ACh release to the auditory cortex induced by NB (nucleus basalis) stimulation enhanced the amplitude and slope of EPSP in the rat auditory cortex, supporting our results as shown in Figs. 7, 8, 9. Froemke et al. (2007) used in vivo whole cell recording to show that EPSCs and IPSCs in the auditory cortex were balanced in the steady state, however their balance shifted by pairing tones with NB stimulation, resulting in EPSC increase and IPSC decrease at the frequency of the tone paired with NB stimulation. These findings are consistent with our results that the amplitude and time decay constant increased at the frequency of the CS sound, as shown in Figs. 8a, 10a.
Taking all these notions together, we propose that the large increase of the decay time constant of EPSP to the CS sound reflected the enhancement of late-EPSP, which is dependent on NMDA glutamate receptors. This would be induced by the release of ACh from basal forebrain to cortex during conditioning.
It has been reported that excitatory neuron activities based on NMDA glutamate receptor laterally exists beyond the iso-frequency band in the tonotopic map of auditory cortex (Horikawa et al. 1996). From this observation, we suggest that the increase of the auditory response area for the CS sound (12 kHz) after the conditioning in our study might have been based on LTP in layers II and III, dependent on NMDA glutamate receptors. This LTP could have been triggered by the release of ACh from basal forebrain to cortex during conditioning. Such a scheme can explain the enhancement of the response area and the activity after the peak in the time course for the CS sound.
In this study, we investigated the effects of fear conditioning on optical signals in the auditory cortex to CS (12 kHz pure tone) and non-CS (4, 8 and 16 kHz pure tone) before and after normal/sham conditioning. The activation increased only for CS after conditioning in the normal conditioning group. For this specific case, the peak value and the decay time constant of the optical response significantly increased and the rise time constant of the optical response significantly decreased. The current findings of plastic changes in the auditory cortex are compatible with LTP during fear conditioning. This study’s primary innovation resides in the introduction of an optical approach to the investigation of fear conditioning, representational plasticity, and the cholinergic system. The study also has merit in synthesizing the findings into a model of the synaptic mechanisms that underlie cortical plasticity.
Acknowledgments
This work was supported by the 21st Century Center of Excellence (COE) Program and the Global COE Program at Tamagawa University and Grants-in-Aid for Scientific Research (A) 19200014, Grants-in-Aid for Young Scientists (B) 21700435 and Grants-in-Aid for Scientific Research on Innovative Areas 21120006 from the Ministry of Education, Culture, Sports, Science and Technology of Japan. We are grateful to H. Fujii for usuful advice and discussion.
References
- Bakin JS, Weinberger NM. Classical conditioning induces CS-specific receptive field plasticity in the auditory cortex of the guinea pig. Brain Res. 1990;536:271–286. doi: 10.1016/0006-8993(90)90035-A. [DOI] [PubMed] [Google Scholar]
- Bandrowski AE, Moore SL, Ashe JH. Cholinergic synaptic potentials in the supragranular layers of auditory cortex. Synapse. 2001;41:118–130. doi: 10.1002/syn.1066. [DOI] [PubMed] [Google Scholar]
- Bieszczad KM, Weinberger NM. Remodeling the cortex in memory: increased use of a learning strategy increases the representational area of relevant acoustic cues. Neurobiol Learn Mem. 2010;94(2):127–144. doi: 10.1016/j.nlm.2010.04.009. [DOI] [PMC free article] [PubMed] [Google Scholar]
- Bieszczad KM, Weinberger NM. Representational gain in cortical area underlies increase of memory strength. Proc Natl Acad Sci USA. 2010;107(8):3793–3798. doi: 10.1073/pnas.1000159107. [DOI] [PMC free article] [PubMed] [Google Scholar]
- Bliss TVP, Collingidge GL. A synaptic model of memory: long-term potentiation in the hippocampus. Nature. 1993;361(6407):31–39. doi: 10.1038/361031a0. [DOI] [PubMed] [Google Scholar]
- Bliss TVP, LÁmo T. Long lasting potentiation of synaptic transmission in the dentate area of the anaesthetized rabbit following stimulation of the perforant path. J Physiol. 1973;232(2):331–356. doi: 10.1113/jphysiol.1973.sp010273. [DOI] [PMC free article] [PubMed] [Google Scholar]
- Buonomano DV, Merzenich MM. Cortical plasticity: from synapses to maps. Annu Rev Neurosci. 1998;21:149–186. doi: 10.1146/annurev.neuro.21.1.149. [DOI] [PubMed] [Google Scholar]
- Campanac E, Debanne D. Spike timing-dependent plasticity: a learning rule for dendritic integration in rat CA1 pyramidal neurons. J Physiol. 2008;586(3):779–793. doi: 10.1113/jphysiol.2007.147017. [DOI] [PMC free article] [PubMed] [Google Scholar]
- Chen PE, Errington ML, Kneussel M, Chen G, Annala AJ, Rudhard YH, Rast GF, Specht CG, Tigaret CM, Nassar MA, Morris RG, Bliss TV, Schoepfer R. Behavioral deficits and subregion-specific suppression of LTP in mice expressing a population of mutant NMDA receptors throughout the hippocampus. Learn Mem. 2009;16:635–644. doi: 10.1101/lm.1316909. [DOI] [PMC free article] [PubMed] [Google Scholar]
- Cohen LB, Salzberg BM, Grinvald A. Optical methods for monitoring neuron activity. Annu Rev Neurosci. 1978;1:171–182. doi: 10.1146/annurev.ne.01.030178.001131. [DOI] [PubMed] [Google Scholar]
- Diamond DM, Dunwiddie TV, Rose GM. Characteristics of hippocampal primed burst potentiation in vitro and in the awake rat. J Neurosci. 1988;8(11):4079–4088. doi: 10.1523/JNEUROSCI.08-11-04079.1988. [DOI] [PMC free article] [PubMed] [Google Scholar]
- Edeline JM. Learning-induced physiological plasticity in the thalamo-cortical sensory systems: a critical evaluation of receptive field plasticity, map changes and their potential mechanisms. Prog Neurobiol. 1999;57:165–224. doi: 10.1016/S0301-0082(98)00042-2. [DOI] [PubMed] [Google Scholar]
- Edeline J-M, Massioui NN-E. Retention of CS-US association learned under ketamine anesthesia. Brain Res. 1988;457:274–280. doi: 10.1016/0006-8993(88)90696-8. [DOI] [PubMed] [Google Scholar]
- Edeline J-M, Weinberger NM. Receptive field plasticity in the auditory cortex during frequency discrimination training: selective retuning independent of task difficulty. Behav Neurosci. 1993;107(1):82–103. doi: 10.1037/0735-7044.107.1.82. [DOI] [PubMed] [Google Scholar]
- Edeline J-M, Pham P, Weinberger NM. Rapid development of learning-induced receptive field plasticity in the auditory cortex. Behav Neurosci. 1993;107(4):539–551. doi: 10.1037/0735-7044.107.4.539. [DOI] [PubMed] [Google Scholar]
- Fazeli MS, Corbet J, Dunn MJ, Dolphin AC, Bliss TV. Changes in protein synthesis accompanying long-term potentiation in the dentate gyrus in vivo. J Neurosci. 1993;13(4):1346–1353. doi: 10.1523/JNEUROSCI.13-04-01346.1993. [DOI] [PMC free article] [PubMed] [Google Scholar]
- Feldman DE. Synaptic mechanisms for plasticity in neocortex. Annu Rev Neurosci. 2009;32:33–55. doi: 10.1146/annurev.neuro.051508.135516. [DOI] [PMC free article] [PubMed] [Google Scholar]
- Finnerty GT, Roberts LSE, Connors BW. Sensory experience modifies the short-term dynamics of neocortical synapses. Nature. 1999;400:367–371. doi: 10.1038/22553. [DOI] [PubMed] [Google Scholar]
- Froemke RC, Merzenich MM, Schreiner CE. A synaptic memory trace for cortical receptive field plasticity. Nature. 2007;450:425–429. doi: 10.1038/nature06289. [DOI] [PubMed] [Google Scholar]
- Fujii S, Ji Z, Morita N, Sumikawa K. Acute and chronic nicotine exposure differentially facilitate the induction of LTP. Brain Res. 1999;846:137–143. doi: 10.1016/S0006-8993(99)01982-4. [DOI] [PubMed] [Google Scholar]
- Fujii S, Jia Y, Yang A, Sumikawa K. Nicotine reverses GABAergic inhibition of long-term potentiation induction in the hippocampal CA1 region. Brain Res. 2000;863:259–265. doi: 10.1016/S0006-8993(00)02119-3. [DOI] [PubMed] [Google Scholar]
- Gilbert CD. Adult cortical dynamics. Physiol Rev. 1998;78(2):467–485. doi: 10.1152/physrev.1998.78.2.467. [DOI] [PubMed] [Google Scholar]
- Grinvald A, Frostig RD, Lieke E, Hildesheim R. Optical imaging of neuronal activity. Physiol Rev. 1988;68(4):1285–1366. doi: 10.1152/physrev.1988.68.4.1285. [DOI] [PubMed] [Google Scholar]
- Grinvald A, Lieke EE, Frostig RD, Hildesheim R. Cortical point spread function and long-range lateral interactions revealed by real-time optical imaging of macaque monkey primary visual cortex. J Neurosci. 1994;14(5):2545–2568. doi: 10.1523/JNEUROSCI.14-05-02545.1994. [DOI] [PMC free article] [PubMed] [Google Scholar]
- Gruart A, Muñoz MD, Delgado-García JM. Involvement of the CA3-CA1 synapse in the acquisition of associative learning in behaving mice. J Neurosci. 2006;26(4):1077–1087. doi: 10.1523/JNEUROSCI.2834-05.2006. [DOI] [PMC free article] [PubMed] [Google Scholar]
- Hess G, Aizenman CD, Donoghue JP. Conditions for the induction of long-term potentiation in layer II/III horizontal connections of the rat motor cortex. J Neurophysiol. 1996;75(5):1765–1778. doi: 10.1152/jn.1996.75.5.1765. [DOI] [PubMed] [Google Scholar]
- Horikawa J, Hosokawa Y, Kubota M, Nasu M, Taniguchi I. Optical imaging of spatiotemporal patterns of glutamatergic excitation and GABAergic inhibition in the guinea-pig. J Physiol. 1996;497(3):629–638. doi: 10.1113/jphysiol.1996.sp021795. [DOI] [PMC free article] [PubMed] [Google Scholar]
- Horikawa J, Hess A, Nasu M, Hosokawa Y, Scheich H, Taniguchi I. Optical imaging of neural activity in multiple auditory cortical fields of guinea pigs. Neuroreport. 2001;12(15):3335–3339. doi: 10.1097/00001756-200110290-00038. [DOI] [PubMed] [Google Scholar]
- Howe AG, Levy WB. A hippocampal model predicts a fluctuating phase transition when learning certain trace conditioning paradigms. Cogn Neurodyn. 2007;1(2):143–155. doi: 10.1007/s11571-006-9012-7. [DOI] [PMC free article] [PubMed] [Google Scholar]
- Huang W, Armstrong-James M, Rema V, Diamond ME, Ebner FF. Contribution of supragranular layers to sensory processing and plasticity in adult rat barrel cortex. J Neurophysiol. 1998;80:3261–3271. doi: 10.1152/jn.1998.80.6.3261. [DOI] [PubMed] [Google Scholar]
- Hui GK, Wong KL, Chavez CM, Leon MI, Robin KM, Weinberger NM. Conditioned tone control of brain reward behavior produces highly specific representational gain in the primary auditory cortex. Neurobiol Learn Mem. 2009;92(1):27–34. doi: 10.1016/j.nlm.2009.02.008. [DOI] [PMC free article] [PubMed] [Google Scholar]
- Kaneki K, Araki O, Tsukada M. Dual synaptic plasticity in the hippocampus: Hebbian and spatiotemporal learning dynamics. Cogn Neurodyn. 2009;3(2):153–163. doi: 10.1007/s11571-008-9071-z. [DOI] [PMC free article] [PubMed] [Google Scholar]
- Karpova A, Mikhaylova M, Thomas U, Knöpfel T, Behnisch T. Involvement of protein synthesis and degradation in long-term potentiation of schaffer collateral CA1 synapses. J Neurosci. 2006;26(18):4949–4955. doi: 10.1523/JNEUROSCI.4573-05.2006. [DOI] [PMC free article] [PubMed] [Google Scholar]
- Kilgard MP, Merzenich MM. Cortical map reorganization enabled by nucleus basalis activity. Science. 1998;279:1714–1718. doi: 10.1126/science.279.5357.1714. [DOI] [PubMed] [Google Scholar]
- Kirkwood A, Dudek SM, Gold JT, Aizenman CD, Bear MF. Common forms of synaptic plasticity in the hippocampus and neocortex in vitro. Science. 1993;260:1518–1521. doi: 10.1126/science.8502997. [DOI] [PubMed] [Google Scholar]
- Kudoh M, Shibuki K. Importance of polysynaptic inputs and horizontal connectivity in the generation of tetanus-induced long-term potentiation in the rat auditory cortex. J Neurosci. 1997;17(24):9458–9465. doi: 10.1523/JNEUROSCI.17-24-09458.1997. [DOI] [PMC free article] [PubMed] [Google Scholar]
- LeDoux JE. Emotion circuits in the brain. Annu Rev Neurosci. 2000;23:155–184. doi: 10.1146/annurev.neuro.23.1.155. [DOI] [PubMed] [Google Scholar]
- Lippert TM, Takagaki K, Xu W, Huang X, Wu J-Y. Methods for voltage-sensitive dye imaging of rat cortical activity with high signal-to-noise ratio. J Neurophysiol. 2006;98:502–512. doi: 10.1152/jn.01169.2006. [DOI] [PMC free article] [PubMed] [Google Scholar]
- Maren S. Neurobiology of pavlovian fear conditioning. Annu Rev Neurosci. 2001;24:897–931. doi: 10.1146/annurev.neuro.24.1.897. [DOI] [PubMed] [Google Scholar]
- Metherate R, Ashe JH. Nucleus basalis stimulation facilitates thalamocortical synaptic transmission in the rat auditory cortex. Synapse. 1993;14(2):132–143. doi: 10.1002/syn.890140206. [DOI] [PubMed] [Google Scholar]
- Metherate R, Hsieh CY. Regulation of glutamate synapses by nicotinic acetylcholine receptors in auditory cortex. Neurobiol Learn Mem. 2003;80:285–290. doi: 10.1016/S1074-7427(03)00062-5. [DOI] [PubMed] [Google Scholar]
- Rasmusson DD. The role of acetylcholine in cortical synaptic plasticity. Behav Brain Res. 2000;115:205–218. doi: 10.1016/S0166-4328(00)00259-X. [DOI] [PubMed] [Google Scholar]
- Read HL, Winer JA, Schreiner CE. Functional architecture of auditory cortex. Curr Opin Neurobiol. 2002;12:433–440. doi: 10.1016/S0959-4388(02)00342-2. [DOI] [PubMed] [Google Scholar]
- Recanzone GH, Schreiner CE, Merzenich MM. Plasticity in the frequency representation of primary auditory cortex following discrimination training in adult owl monkeys. J Neurosci. 1993;13(1):87–103. doi: 10.1523/JNEUROSCI.13-01-00087.1993. [DOI] [PMC free article] [PubMed] [Google Scholar]
- Redies H, Sieben U, Creutzfeldt OD. Functional subdivisions in the auditory cortex of the guinea pig. J Comp Neurol. 1989;282:473–488. doi: 10.1002/cne.902820402. [DOI] [PubMed] [Google Scholar]
- Rutkowski RG, Weinberger NM. Encoding of learned importance of sound by magnitude of representational area in primary auditory cortex. Proc Natl Acad Sci USA. 2005;102:12664–13669. doi: 10.1073/pnas.0506838102. [DOI] [PMC free article] [PubMed] [Google Scholar]
- Shimoff E. Avoidance responding as a function of stimulus duration and relation to free shock. J Exp Anal Behav. 1972;17(3):451–461. doi: 10.1901/jeab.1972.17-451. [DOI] [PMC free article] [PubMed] [Google Scholar]
- Taufiq AM, Fujii S, Yamazaki Y, Sasaki H, Kaneko K, Li J, Kato H, Mikoshiba K. Involvement of IP3 receptors in LTP and LTD induction in guinea pig hippocampal CA1 neuron. Learn Mem. 2005;12:594–600. doi: 10.1101/lm.17405. [DOI] [PMC free article] [PubMed] [Google Scholar]
- Trepel C, Racine RJ. Long-term potentiation in the neocortex of the adult, freely moving rat. Cereb Cortex. 1998;8:719–729. doi: 10.1093/cercor/8.8.719. [DOI] [PubMed] [Google Scholar]
- Tsukada M, Yamazaki Y, Kojima H. Interaction between the Spatiotemporal Learning Rule (STLR) and Hebb type (HEBB) in single pyramidal cells in the hippocampal CA1 Area. Cogn Neurodyn. 2007;1(2):157–167. doi: 10.1007/s11571-006-9014-5. [DOI] [PMC free article] [PubMed] [Google Scholar]
- Wallace MN, Rutkowski RG, Palmer AR. Identification and localization of auditory areas in guinea pig cortex. Exp Brain Res. 2000;132:445–456. doi: 10.1007/s002210000362. [DOI] [PubMed] [Google Scholar]
- Weinberger NM. Specific long-term memory traces in primary auditory cortex. Nat Rev Neurosci. 2004;5:279–290. doi: 10.1038/nrn1366. [DOI] [PMC free article] [PubMed] [Google Scholar]
- Weinberger NM, Bakin JS. Learning-induced physiological memory in adult primary auditory cortex: receptive field plasticity, model, and mechanisms. Audiol Neurootol. 1998;3:145–167. doi: 10.1159/000013787. [DOI] [PubMed] [Google Scholar]
- Weinberger NW, Javid R, Lepan B. Long-term retention of learning induced receptive field plasticity in the auditory cortex. Proc Natl Acad Sci USA. 1993;90:2394–2398. doi: 10.1073/pnas.90.6.2394. [DOI] [PMC free article] [PubMed] [Google Scholar]
- Yamazaki Y, Hamaue N, Sumikawa K. Nicotine compensate for the loss of cholinergic function to enhance long-term potentiation induction. Brain Res. 2002;946:148–152. doi: 10.1016/S0006-8993(02)02935-9. [DOI] [PubMed] [Google Scholar]


