

Abstract
Introduction
Noninvasive imaging methods that can distinguish apoptosis from necrosis may be useful in furthering our understanding of diseases characterized by apoptotic dysregulation as well as aiding drug development targeting apoptotic pathways. We evaluated the ability of radiolabeled isatins to quantify caspase-3 activity induced by the activation of the extrinsic apoptotic pathway by the anti-Fas antibody in mice.
Methods
The behavior of three different radiolabeled isatins ([18F]WC-II-89, [18F]WC-IV-3, and [11C]WC-98), was characterized in mice with and without anti-Fas antibody treatment by microPET imaging and biodistribution studies. The activity of [18F]WC-II-89 was also compared with [99mTc]mebrofenin. The effect of pan-caspase inhibition with Q-VD-OPH on [18F]WC-II-89 uptake was studied. Caspase-3 activity was confirmed by a fluorometric enzyme assay.
Results
All three tracers behaved similarly in microPET and biodistribution studies. Increased retention of all tracers was observed in the livers of treated animals and several other organs, all of which demonstrated increased caspase-3 enzyme activity; however, impaired hepatobiliary excretion made attribution of these findings to caspase-3 activity difficult. The isatin [18F]WC-II-89 was retained at statistically significantly higher levels in the organs after anti-Fas antibody treatment while [99mTc]mebrofenin activity cleared, suggesting specific binding to activated caspase-3, but the magnitude of increased binding was still relatively low. Caspase inhibition with Q-VD-OPH partially blocked [18F]WC-II-89 retention but completely blocked caspase-3 enzyme activity in the liver.
Conclusions
The radiolabeled isatins appear to bind specifically to caspase-3 in vivo, but their sensitivity is limited. Further optimization is required for these tracers to be useful for clinical applications.
INTRODUCTION
Abnormal activation of apoptosis and necrosis can cause a number of pathophysiologic conditions, including oncologic, neurologic, and cardiovascular disease. Methods that can identify or even quantify apoptosis specifically may be useful in aiding the development of therapeutics targeting the apoptotic pathways. Such methods could help both demonstrate that these therapies are modulating their intended target mechanism as well as monitor the patients’ response to treatment.
Noninvasive imaging with positron emission tomography (PET) may be a useful method for imaging apoptosis. PET imaging allows quantification of the uptake of targeted radiopharmaceuticals and thus can be used to estimate enzyme activity or receptor binding capacity in vivo. A number of approaches have been developed for distinguishing apoptotic from necrotic cells using PET. Annexin V, which binds to phosphatidylserine (PS) residues that are exposed in apoptotic cells but not in normal healthy cells, has been labeled with F-18 for PET imaging [1]. However, annexin V will also bind to PS residues exposed by necrotic cells. The small molecule [18F]fluorobenzyltriphenylphosphonium cation ([18F]FBnTP) has also been labeled for apoptosis imaging [2,3]. This tracer accumulates in normal mitochondria due to the maintained mitochondrial membrane potential (ΔΨm) and washes out when apoptosis activation induces the loss of the ΔΨm. While this approach is promising as the mechanism of tracer uptake reflects a known mechanism of apoptosis, drops in signal theoretically may be difficult to interpret without a known baseline level of uptake against which to compare. Whether this is a true limitation of this approach remains to be determined. Finally, [18F]ML-10, a small carboxylic acid, is being evaluated as an apoptosis-specific tracer [4]. The proposed mechanism for the ability of this molecule to enter apoptotic cells appears to require the presence of both carboxyl groups [5]; however, the relationship of this mechanism to apoptosis is still unclear.
Caspase-3 activity is an attractive target for imaging apoptosis. Caspases are activated as a result of apoptosis induction, resulting in characteristic cellular morphologic changes [6-8]. Treatment with pan-caspase inhibitors can block the progression of apoptosis and divert cells into necrotic cell death [9-11]. Two classically described pathways, the mitochondrial or “intrinsic” and death receptor or “extrinsic” pathways [12], both lead to activation of the downstream effector caspase-3 [7,11,13]. Therefore, radiopharmaceuticals targeting the active caspase-3 enzyme are potentially useful in distinguishing apoptotic from necrotic cells in vivo.
Isatin sulfonamide analogs are potent inhibitors of caspase-3 [14,15]. We and others have radiolabeled these compounds to detect apoptotic activation in various animal models of apoptosis, including liver injury [16,17], cardiac ischemia-reperfusion [18], and chemotherapy-treated tumors [19]. However, caspase-3 was not directly activated in any of these models. The anti-Fas antibody induces liver injury in mice by binding to the CD95 cell surface antigen, which activates the extrinsic apoptosis pathway [20], causing very high levels of caspase-3 activation. This model has been used to demonstrate the effectiveness of [99mTc]annexin V as a radiotracer for imaging apoptosis [21] and therefore may be useful in evaluating the efficacy of the radiolabeled isatins for binding caspase-3 in vivo. We sought to evaluate the ability of the isatin sulfonamide analogs to quantify caspase-3 activation in this model. However, the use of this model with the isatin sulfonamides was potentially limited as the liver is the primary route of metabolism for these tracers. Because the anti-Fas antibody induces such severe liver injury, we also compared the behavior of the radiolabeled isatins with [99mTc] mebrofenin, a tracer that is dependent on normal hepatobiliary transport for excretion and would not be expected to remain in apoptotic cells by a specific mechanism [22]. This comparison would then also give us information regarding the specificity of the isatins for caspase-3 in this model.
METHODS
Radiolabeling Synthesis
[18F]WC-II-89, [18F]WC-IV-3, and [11C]WC-98 were synthesized as previously described [16,17,23]. [99mTc]mebrofenin was produced using a commercially available kit (Bracco Diagnostics, Inc, Princeton, NJ) according to the manufacturer’s instructions.
Animal Preparation and Experimental Groups
The protocol for these studies was reviewed and approved by the Animal Studies Committee at Washington University School of Medicine. The anti-Fas liver injury model is a well-characterized model of apoptotic activation via the extrinsic pathway [20]. Female Balb/c mice (8-10 weeks old, 18-20 g) were placed in the treated group, which was injected intravenously (i.v.) with 10 μg of anti-Fas antibody (BD Biosciences), or left untreated. All animals were anesthetized with isoflurane 1-2% prior to euthanization.
MicroPET Imaging Acquisition and Analysis
Treated and untreated mice were imaged with [18F]WC-II-89, [18F]WC-IV-3, or [11C]WC-98 (60 -78 MBq i.v.) in 3 separate imaging sessions on a Focus 220 microPET scanner (Siemens/CTI). Animals were anesthetized with isoflurane 1-2% for the duration of the scan and then euthanized immediately afterward. After obtaining a transmission scan, images were dynamically acquired over 60 minutes after injecting the tracer i.v. in 100 μI total volume of a 15% ethanol and normal saline solution. Scans were reconstructed using filtered back-projection. Volumes of interest (VOI) were placed over the medial aspect of the liver using ASIPro VM (CTI/Concorde MicroSystems) to generate time-activity curves.
Biodistribution Studies
Separate biodistribution studies for each of the three tracers, [18F]WC-II-89, [18F]WC-IV-3, and [11C]WC-98, were performed to quantify the tracer uptake levels over time starting at 90 minutes after anti-Fas antibody administration. Animals were divided into treated and untreated control groups, with N = 4 in each group at each time point except for the [11C]WC-98 study in which N=3 in each of the 5 minute groups and N=5 in each of the 30 minute groups. Mice were sacrificed at 5 min, 30 min and 1 h after injection of either 11.5±0.4 MBq (31±1 μCi) of [18F]WC-II-89 or 16.3±0.7 MBq (44±2 μCi) of [18F]WC-IV-3 and at 5 min and 30 min after injection of 19.5±0.7 MBq (50±2 μCi) of [11C]WC-98. The following organs were harvested: blood, brain, bone, fat, heart, kidney, liver, lung, muscle, spleen, thymus, and tail. The bone, brain, and thymus, were not harvested during the [11C]WC-98 study due to the short half-life of C-11. All organs were blotted to remove excess blood, weighed, and counted in a Beckman Gamma 6000 counter. Any animal with 10% or more of the injected dose in the tail was excluded from the analysis. The percent injected dose per gram (%ID/g) of tissue was determined for each organ. The liver samples from each study were flash frozen immediately after harvest, counted while frozen, and then stored for later analysis for caspase-3 enzyme activity.
Based on our previously published data demonstrating that [18F]WC-II-89 appeared to be more effective in binding caspase-3 activity outside the liver [16] and that the differences in [18F]WC-II-89 and [18F]WC-IV-3 in organs outside the liver were not very different in the single-tracer biodistribution studies, we chose to use [18F]WC-II-89 in subsequent studies to determine the specificity of the radiolabeled isatins for binding caspase-3 in vivo.
Dual tracer study with [18F]WC-II-89 and [99mTc]mebrofenin
The radiolabeled isatins are excreted by the hepatobiliary system [16]. Therefore, these tracers could be retained in the organs from treated animals simply due to the impaired hepatobiliary clearance induced by the anti-Fas antibody-induced liver injury instead of specific binding to caspase-3 activity. [99mTc]mebrofenin is transported by the same mechanisms as bilirubin in the liver [22]. In a rat liver transplant model, [99mTc]mebrofenin liver uptake appeared to correlate with liver injury rather than rejection-associated apoptosis [24]. The retention of [99mTc]mebrofenin in the liver or other organs in response to liver injury is thus not mechanistically tied to the cause of liver injury and should provide information regarding the degree of nonspecific retention of [18F]WC-II-89 in this model. Therefore, a separate biodistribution study was performed to compare the uptake of both [18F]WC-II-89 and [99mTc]mebrofenin in the same mice (N=4 in each group). Treated animals were injected i.v. with 11±2 μCi of [18F]WC-II-89 followed immediately by 31±1 μCi of [99mTc]mebrofenin i.v. at 60 minutes after anti-Fas antibody injection and the uptake compared with untreated controls. We chose 60 minutes instead of 90 minutes for this study and the blocking study described below as we observed that several of the mice in the 60 minute time point from the prior single-tracer biodistribution studies began experiencing circulatory collapse, which we wanted to avoid. Animals were sacrificed at 5 min, 30 min, and 60 min after tracer injection. The following organs were harvested: blood, bone, fat, heart, kidney, liver, lung, muscle, spleen, and thymus. All samples were counted immediately after harvest as above to determine the %ID/g of [18F]WC-II-89. The samples were then left overnight to allow the F-18 to decay and approximately 16 hours later were counted again to determine the %ID/g of [99mTc]mebrofenin in each organ.
Blocking Study with the Pan-Caspase Inhibitor Q-VD-OPH
The pan-caspase inhibitor Q-VD-OPH was used in a separate study to inhibit caspase activity induced by the anti-Fas antibody. For this study, animals were divided into the following groups (N=4 in each group): untreated control (no interventions), control plus inhibitor (Q-VD-OPH), treated (anti-Fas antibody only), and treated plus inhibitor (anti-Fas antibody plus Q-VD-OPH). Q-VD-OPH (400 μg in 100% DMSO) was injected intraperitoneally 30 minutes after injection of the anti-Fas antibody and 60 minutes prior to [18F]WC-II-89 (31±1 μCi) injection. The mice were sacrificed at 30 minutes after the tracer injection. The liver samples from this study were frozen and analyzed for caspase-3 activity as above. This study was performed twice, with a total of N=8 in the untreated control group and N=7 in all of the other treatment groups.
Caspase-3 enzyme activity determination
Caspase-3 activity levels were determined by a fluorometric enzyme activity assay of the liver samples obtained during the biodistribution studies to confirm that the antibody had indeed induced liver injury. Caspase-3 enzyme activity measurement in the organs harvested for the biodistribution studies was limited as the organs needed to remain frozen through the counting process. Additionally, we noted that the tracers were consistently retained in several of the organs measured. Therefore, we also conducted two separate experiments to characterize the induced levels of caspase-3 activation in various organs using the fluorometric enzyme activity assay. Caspase-3 activity was determined in the blood, lungs, heart, liver, spleen, kidneys, muscle, and fat in treated animals (total N=10) 2 to 2.5 hours prior to euthanization and in untreated controls (total N=6).
For the assay, all organs analyzed were flash-frozen on dry ice immediately after harvest. The liver samples from the biodistribution studies were counted for tracer activity prior to processing and remained frozen during the counting. All samples were homogenized in protein extraction buffer as previously described [23]. One hundred μg of protein from each organ was incubated with the fluorogenic substrate Ac-DEVD-AMC in triplicate on a 96-well plate. Fluorescence units were recorded every 15 minutes in a plate reader (Perkin-Elmer) over 4 hours and plotted over time. The average of the slopes determined from linear portion of this curve from each wells per sample, normalized for the amount of protein, determined the rate of caspase-3 activity in each sample in arbitrary fluorescence units per microgram of protein per minute (AFU/ug protein/min).
Statistical Analysis
The Student’s t-test with bootstrap correction for multiple comparisons, performed with SAS 9.2 for Windows, assessed for differences between the treated and control groups in the single tracer biodistribution studies and in the dual tracer study with [18F]WC-II-89 and [99mTc]mebrofenin. The same analysis was applied to the fluorometric enzyme assay results for the experiment in which multiple organs were measured. Degrees of freedom were calculated using the Satterthwaite method for heterogeneous variance in the different groups. One-tailed t-tests were performed as the anti-Fas antibody treatment was expected only to increase caspase-3 levels and tracer binding. A two-way analysis of variance (ANOVA), performed with SigmaStat 3.5 for Windows (Systat Software, Inc.), assessed for differences in the liver caspase-3 levels measured by fluorometric enzyme assay in the Q-VD-OPH caspase inhibitor study to determine the effects of the anti-Fas antibody treatment, Q-VD-OPH treatment, and the combination of the two treatments. The same 2-way ANOVA was applied to the measured [18F]WC-II-89 uptake in the blood and liver in the different treatment groups from the biodistribution study. Post-hoc analysis with the Holm-Sidak method for the ANOVA determined the statistically significant relationships among the treatment groups. A p-value of < 0.05 determined statistical significance.
RESULTS
MicroPET Imaging Studies
MicroPET images of a mouse treated with anti-Fas antibody and an untreated control mouse obtained with [18F]WC-II-89 are shown in Figure 1. Time-activity curves obtained from a volume of interest (VOI) placed over the left lobe of the liver are shown adjacent to the microPET images. The liver of the treated mouse clearly retains the tracer to a greater extent when compared with that of the untreated control but continues to clear over time. Similar results were obtained with [18F]WC-IV-3 (not shown) and [11C]WC-98 (images previously published [23]). The continued clearance of the tracer suggests that some of the liver is still functioning despite the liver injury; however, nonspecific retention simply due to the induced liver injury may still be contributing to the liver retention of the tracers.
Figure 1.
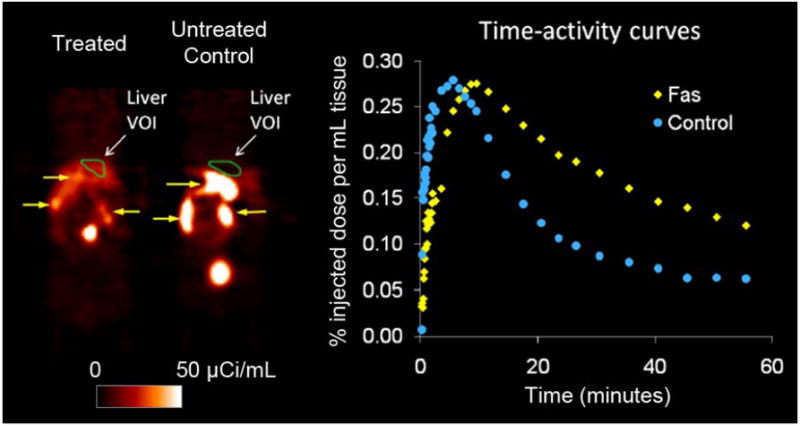
MicroPET imaging results with [18F]WC-II-89 in a mouse treated with anti-Fas antibody (60 MBq [162 μCi] of [18F]WC-II-89 i.v.) and an untreated control mouse (70 MBq [190 μCi] of [18F]WC-II-89 i.v.). MicroPET images were acquired dynamically for 60 minutes after injection of each tracer, with each mouse anesthetized with 1-3% isoflurane during the entire image acquisition. Images shown are coronal images (head at top) from the last 5 minute-frame of the 60-minute dynamic scan. There is increased retention in the liver in the treated mouse that washes out at a slower rate than that of the normal mouse that is also evident from the time-activity curves. The green regions-of-interest, labeled “Liver VOI,” denote the location of the volumes of interest (VOI) used to generate the time-activity curves. These results were representative of that observed with [18F]WC-IV-3 and [11C]WC-98. The yellow arrows point to tracer excreted by the hepatobiliary system into the gastrointestinal tract. The top yellow arrow in the control animal points to the gallbladder.
Biodistribution studies
Caspase-3 tracer studies
The data obtained from the biodistribution studies evaluating each of the three tracers [18F]WC-II-89, [18F]WC-IV-3, and [11C]WC-98 are summarized in Table 1. At 5 minutes, none of the tracers was significantly increased in the treated group when compared to the untreated controls (data not shown). [18F]WC-II-89 was statistically significantly increased in the liver and spleen by 30 minutes and increased in nearly all of the organs by 60 minutes, with approximately half of the organs demonstrating statistically significant increases. [18F]WC-IV-3 and [11C]WC-98 uptake was also statistically significantly elevated in the liver. However, again because the isatins are excreted by the hepatobiliary system, the contributions of specific caspase-3 binding and nonspecific retention to the liver uptake were difficult to determine.
Table 1.
Biodistribution data for radiolabeled isatin sulfonamides
| [18F]WC-II-89 | [18F]WC-IV-3 | [11C]WC-98 | ||||||||
|---|---|---|---|---|---|---|---|---|---|---|
| 30 min | 60 min | 30 min | 60 min | 30 min | ||||||
| Control | Treated | Control | Treated | Control | Treated | Control | Treated | Control | Treated | |
| Blood | 1.4 ± 0.1 (1.3, 1.6) | 3.7 ± 1.3 (2.4, 5.0) | 0.8 ± 0.1 (0.7, 0.9) | 4.3 ± 1.2* (3.2, 5.8) | 1.5 ± 0.1 (1.4, 1.6) | 4.6 ± 1.5* (2.6, 6.1) | 1.6 ± 1.0 (1.0, 3.1) | 5.5 ± 2.4 (3.6, 9.0) | 0.3 ± 0.1 (0.2, 0.5) | 4.2 ± 2.5† (2.8, 8.7) |
| Bone | 0.7 ± 0.1 (0.9, 1.2) | 1.0 ± 0.2 (0.9, 1.2) | 0.9 ± 0.4 (0.4, 0.7) | 1.1 ± 0.3 (0.8, 1.5) | 0.8 ± 0.1 (0.7, 1.0) | 1.5 ± 0.3* (1.1, 1.8) | 1.2 ± 0.2 (0.9, 1.4) | 1.9 ± 0.3* (1.4, 2.1) | — | — |
| Brain | 0.42 ± 0.04 (0.38, 0.48) | 0.46 ± 0.08 (0.39, 0.55) | 0.40 ± 0.05 (0.34, 0.45) | 0.42 ± 0.02 (0.40, 0.44) | 0.85 ± 0.09 (0.72, 0.96) | 0.78 ± 0.06 (0.71, 0.83) | 0.70 ± 0.09 (0.6, 0.8) | 0.73 ± 0.06 (0.7, 0.8) | 0.10 ± 0.02 (0.06, 0.12) | 0.17 ± 0.03* (0.14, 0.22) |
| Fat | 1.9 ± 0.4 (1.4, 2.3) | 2.6 ± 0.3 (2.3, 2.9) | 0.9 ± 0.2 (0.8, 1.2) | 2.2 ± 0.8† (1.4, 3.3) | 1.3 ± 0.2 (1.1, 1.6) | 2.4 ± 0.5* (1.9, 2.9) | 0.5 ± 0.1 (0.4, 0.7) | 1.8 ± 0.8† (1.0, 2.8) | 0.8 ± 0.1 (0.6, 0.9) | 1.6 ± 0.3* (1.3, 2.0) |
| Heart | 1.5 ± 0.2 (1.4, 1.8) | 2.6 ± 0.6 (2.1, 3.2) | 0.7 ± 0.1 (0.7, 0.8) | 2.3 ± 0.7* (1.6, 3.3) | 1.4 ± 0.1 (1.3, 1.5) | 2.8 ± 0.7* (1.9, 3.4) | 0.9 ± 0.1 (0.8, 1.0) | 2.5 ± 0.9* (1.7, 3.7) | 0.5 ± 0.1 (0.3, 0.6) | 1.9 ± 0.5* (1.1, 2.4) |
| Kidney | 2.4 ± 0.3 (2.1, 2.9) | 8.4 ± 2.7 (5.9, 11.3) | 1.0 ± 0.1 (0.9, 1.1) | 6.4 ± 2.7* (3.5, 9.8) | 2.5 ± 0.3 (2.2, 2.9) | 12.2 ± 4.2* (7.4, 17.5) | 1.2 ± 0.1 (1.0, 1.4) | 12.2 ± 2.8* (10.2, 16.3) | 0.8 ± 0.2 (0.6, 1.1) | 7.6 ± 2.9* (3.8, 11.7) |
| Liver | 6.6 ± 1.0 (5.7, 7.9) | 13.9 ± 1.3* (12.3, 14.7) | 2.1 ± 0.4 (1.5, 2.5) | 6.8 ± 3.0† (3.9, 9.7) | 5.5 ± 0.5 (4.9, 6.0) | 26.9 ± 9.2* (16.4, 37.3) | 2.2 ± 0.3 (1.8, 2.4) | 11.2 ± 5.0* (8.3, 18.6) | 2.5 ± 0.5 (1.7, 3.1) | 13.9 ± 4.2* (8.6, 20.1) |
| Lung | 1.8 ± 0.2 (1.6, 2.1) | 3.4 ± 0.8 (2.7, 4.3) | 1.0 ± 0.1 (0.8, 1.1) | 3.3 ± 1.1* (2.5, 4.9) | 2.0 ± 0.2 (1.8, 2.2) | 4.9 ± 1.2* (3.1, 5.9) | 1.4 ± 0.1 (1.3, 1.6) | 4.8 ± 1.8* (3.2, 7.3) | 0.8 ± 0.3 (0.4, 1.2) | 2.8 ± 0.9* (1.6, 3.9) |
| Muscle | 1.0 ± 0.1 (0.9, 1.2) | 1.6 ± 0.4 (1.3, 2.1) | 0.7 ± 0.1 (0.6, 0.8) | 1.6 ± 0.5† (1.1, 2.3) | 1.3 ± 0.2 (1.1, 1.6) | 2.1 ± 0.4† (1.5, 2.6) | 0.8 ± 0.1 (0.7, 1.0) | 1.9 ± 0.7† (1.1, 2.8) | 0.4 ± 0.1 (0.3, 0.4) | 1.1 ± 0.3* (0.8, 1.4) |
| Spleen | 1.5 ± 0.2 (1.4, 1.8) | 2.6 ± 0.3* (2.2, 2.9) | 0.8 ± 0.1 (0.7, 1.0) | 2.1 ± 0.6* (1.6, 3.0) | 2.4 ± 1.9 (1.3, 5.3) | 2.7 ± 0.4* (2.0, 3.0) | 1.4 ± 0.7 (0.9, 2.3) | 2.4 ± 0.5† (2.1, 3.2) | 0.5 ± 0.1 (0.4, 0.6) | 1.9 ± 1.4 (1.1, 4.4) |
| Thymus | 1.4 ± 0.3 (1.0, 1.9) | 2.6 ± 0.7 (1.8, 3.2) | 0.8 ± 0.1 (0.7, 0.9) | 2.3 ± 1.2 (1.4, 4.0) | 1.3 ± 0.1 (1.2, 1.4) | 2.3 ± 0.4* (1.8, 2.7) | 0.9 ± 0.1 (0.7, 1.0) | 1.9 ± 0.6† (1.2, 2.7) | — | — |
Data represented as mean ± standard deviation (range). N=4 in all groups except for the Treated group at 30 minutes for [18F]WC-II-89 (N=3) and the Control group at 30 minutes for [11C]WC-98 (N=5).
Organ not measured
: p<0.05 compared to control
: p<0.10 compared to control (trend towards significance)
Focusing instead on the other organs evaluated, all of the tracers were also retained at higher levels in the organs from the treated mice. The statistically significant differences in the organs from the treated mice vs. the untreated control mice at 30 and 60 minutes for all three tracers are shown in Table 1. In comparing the biodistribution of the tracers in the untreated control (“normal”) mice, the %ID/g of [11C]WC-98 was lower than either of the F-18 labeled tracers at 30 minutes after tracer injection. The %ID/g of the two F-18-labeled tracers at both 30 and 60 minutes was similar. The increased retention of the F-18 labeled tracers in other organs such as the heart (3.3-fold increase in the mean [18F]WC-II-89 activity in the treated animals over the control group at 60 minutes vs. 2.8-fold increase in the mean [18F]WC-IV-3 activity) and lungs (3.3-fold increased in the mean [18F]WC-II-89 activity at 60 minutes vs. 3.4-fold increase in the mean [18F]WC-IV-3 activity) was also similar. Interestingly, the amount of the F-18 labeled tracers in the blood appeared to increase between 30 and 60 minutes in the treated group despite stable or decreasing tracer levels in all the other organs, including the liver and kidneys (which also excrete these tracers to a lesser extent than the hepatobiliary system).
Caspase-3 activity in various organs after anti-Fas antibody treatment
Anti-Fas antibody consistently caused increases in measured caspase-3 enzyme activity levels, all of which were statistically significant (Table 2). The increased caspase-3 levels correlated with the increased tracer levels observed in the analyzed organs (Table 1), suggesting that the radiolabeled isatin activity tracks with caspase-3 activity. However, the degree of caspase-3 enzyme activation varied considerably between animals.
Table 2.
Fluorometric enzyme assay determination of caspase-3 activity in mice treated with anti-Fas antibody vs untreated controls.
| Caspase-3 activity (AFU/min/μg protein) | ||
|---|---|---|
| Control (N=6) | Treated (N=10) | |
| Blood** | 0.11 ± 0.089 (0 – 0.21) | 35 ± 34* (0.53 – 82) |
| Fat | 0.76 ± 0.38 (0.29 – 1.3) | 20.3 ± 21.8* (0.21 – 72.8) |
| Heart† | 1.7 ± 0.7 (1.1 – 2.9) | 18.9 ± 13.6* (2.5 – 41.2) |
| Kidney | 1.44 ± 1.11 (0.11 – 3.37) | 13.3 ± 12.4* (0.6 – 37.7) |
| Liver | 8.6 ± 5.8 (2.2 – 18) | 481 ± 205* (32 – 724) |
| Lung | 2.2 ± 0.57 (1.4 – 3.0) | 43 ± 23* (5.7 – 76) |
| Muscle | 0.27 ± 0.29 (0.00 – 0.80) | 7.91 ± 8.47* (0.42 – 28.7) |
| Spleen | 28.2 ± 11.6 (17.1 – 49.1) | 65.6 ± 38.5* (29.3 – 166) |
Data expressed as mean ± standard deviation (range).
AFU = Arbitrary fluorescence units
p<0.05
N=8 in the Treated group for this organ.
N=5 in the control group. Including a single high outlier (N=6), the mean and standard deviation for this group was 3.4 ± 4.4 (range 1.1 – 12). The difference remained statistically significant including the high outlier in the analysis.
Dual tracer study with [18F]WC-II-89 and [99mTc]mebrofenin
Because the behavior of [18F]WC-II-89 and [18F]WC-IV-3 in organs other than the liver was similar, taken together with our previously published data demonstrating that [18F]WC-II-89 retention in the spleen correlated better with caspase-3 enzyme activity in rats treated with cycloheximide, we used [18F]WC-II-89 to evaluate the specificity of the isatins for binding caspase-3 with this dual tracer study and a caspase inhibition study.
A separate study was performed to compare the uptake of [18F]WC-II-89 and [99mTc]mebrofenin in the same mice with and without treatment with the anti-Fas antibody (Table 3). No differences between treated and untreated control groups were observed at 5 minutes with either tracer (data not shown). The livers from the treated animals retained both tracers at 30 minutes, but [99mTc]mebrofenin cleared more rapidly from the liver than [18F]WC-II-89. At 60 minutes, the amount of [99mTc]mebrofenin in the livers from the treated animals was not statistically different from that of controls but was statistically different with [18F]WC-II-89, despite the similarity in the treated:control ratios for each tracer. Clearance of [99mTc]mebrofenin from the blood in the treated animals was initially reduced as a result of the liver injury but continued to clear by 60 minutes, with no statistically significant difference at this time point. In contrast, the relative level of [18F]WC-II-89 activity in the blood of the treated animals compared to the controls increased between 30 and 60 minutes. This was statistically significant at 60 minutes after excluding the present of an outlier of 17 %ID/g in a single animal in the control group (compared with 1.4±0.15 %ID/g in the remaining three measurements in that group and 0.8±0.1 %ID/g at 60 minutes in the single-tracer biodistribution study with [18F]WC-II-89, Table 1). As in the prior studies, although less prominent, [18F]WC-II-89 activity was statistically significantly increased in several of the organs from the treated animals when compared to the controls. However, no differences in [99mTc]mebrofenin activity levels were observed in any other organs by 60 minutes after tracer injection, with only trends towards significance in the kidneys and lungs.
Table 3.
[18F]WC-II-89 vs [99mTc]mebrofenin uptake in anti-Fas antibody treated mice vs untreated controls
| Ratio of Mean %ID/g in Treated vs Control Groups (Treated:Control Ratio) | ||||
|---|---|---|---|---|
| [18F]WC-II-89 | [99mTc]Mebrofenin | |||
| 30 min | 60 min | 30 min | 60 min | |
| Blood | 1.8† | 2.9*‡ | 1.5* | 1.5 |
| Bone | 1.3 | 1.3† | 1.7* | 1.3 |
| Fat | 1.1† | 2.1† | 1.2 | 1.3 |
| Heart | 1.6* | 2.1* | 1.3* | 1.1 |
| Kidney | 2.2† | 4.8* | 1.5 | 1.7† |
| Liver | 3.4* | 2.3* | 7.6† | 2.0 |
| Lung | 1.8* | 2.2* | 1.6 | 1.7† |
| Muscle | 1.6* | 0.6 | 2.1 | 0.2 |
| Spleen | 1.8* | 1.9* | 1.5 | 1.7 |
| Thymus | 1.3 | 1.8† | 0.8 | 1.2 |
N=4 in all groups.
%ID/g = Percent injected dose per gram of tissue
p<0.05 when comparing the mean %ID/g of the treated vs untreated control groups for each tracer
p<0.10 when comparing the mean %ID/g of the treated vs untreated control groups for each tracer
Analysis for blood excludes one data point in the control group deemed contaminated (17 %ID/g vs 1.4±0.15 %ID/G for remaining 3 values in the control group for blood; %ID/g for blood from untreated controls in prior experiments was 0.8±0.1, N=4, Table 2). The treated:control ratio for the control blood including the high outlier was 0.77. The p-value was not significant if this outlier was included in the analysis.
Caspase-3 inhibition with Q-VD-OPH
The activity levels of [18F]WC-II-89 were compared in mice treated with the anti-Fas antibody or left untreated, with or without the pan-caspase inhibitor Q-VD-OPH (treated, treated + inhibitor, control, and control + inhibitor). The liver activity levels in the treated group were statistically significantly higher than the control and control + inhibitor groups and trended towards being increased compared to the treated + inhibitor group (Figure 2, left panel). However, treatment with Q-VD-OPH completely suppressed any measurable caspase-3 levels in the liver to that of the untreated control (Figure 2, right panel). These findings suggest that nonspecific retention contributes to the measured [18F]WC-II-89 levels in the liver.
Figure 2.
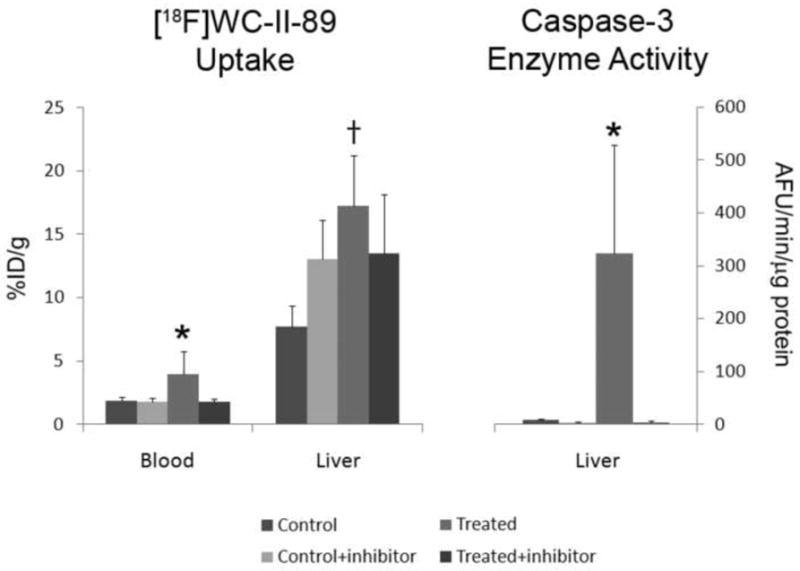
Blocking study with [18F]WC-II-89 using the pan-caspase inhibitor Q-VD-OPH. Q-VD-OPH was injected 30 minutes after anti-Fas antibody injection. Tracer was injected 60 minutes after inhibitor administration (90 min after anti-Fas antibody injection). Q-VD-OPH suppressed all measureable caspase-3 activity in the liver, even after anti-Fas antibody injection. *p<0.05 when compared to all other treatment groups. †p<0.05 when compared to the Control and Control+inhibitor groups but p=0.056 when compared to the Treated+inhibitor group. Data is represented as mean + standard deviation error bars. N=8 in the Control group; N=7 in all other groups. AFU=arbitrary fluorescence units.
In contrast, the blood levels of [18F]WC-II-89 levels increased in the treated group but appeared to be completely blocked after Q-VD-OPH treatment. The increased blood activity in the treated group (without inhibitor) was statistically different when compared with all of the other treatment groups (Figure 2, left panel).
DISCUSSION
The purpose of this study was to evaluate the performance of three different radiolabeled isatin sulfonamide analogs to detect caspase-3 activation in a model of extrinsic-pathway apoptotic activation. The anti-Fas antibody consistently activated caspase-3. While the degree of caspase-3 activation varied considerably between animals, the increased caspase-3 activity could be detected and quantified by the fluorometric assay. The results from the single tracer biodistribution studies, along with the fluorometric enzyme assay data and our previously published data in the cycloheximide-induced liver injury model in rats [16], support the hypothesis that the radiolabeled isatin sulfonamides bind to caspase-3 in vivo. Additionally, the bone uptake remained stable at low levels (less than 2 %ID/g) with both F-18 labeled tracers, indicating that defluorination did not occur to a significant extent with either of these tracers.
To determine whether the tracer retention observed in the liver in our experiments was due primarily to specific caspase-3 binding or nonspecific retention due to impaired tracer clearance, we performed two studies. In the first, we compared the liver retention of [18F]WC-II-89 and [99mTc]mebrofenin in the same mice with and without treatment with the anti-Fas antibody. In the second, we administered the pan-caspase inhibitor Q-VD-OPH 30 minutes after administration of the anti-Fas antibody to determine whether Q-VD-OPH would block tracer binding to caspase-3 activation. The liver retention of both [18F]WC-II-89 and [99mTc]mebrofenin at 30 minutes was increased due to the anti-Fas antibody treatment. However, [18F]WC-II-89 cleared more slowly from the liver than [99mTc]mebrofenin. Q-VD-OPH also partially blocked [18F]WC-II-89 uptake in the livers of anti-Fas antibody treated animals, although the degree of the tracer uptake blockade was not as great as the inhibition of caspase-3 activity by Q-VD-OPH. Taken together, these results suggest that the liver retention of the radiolabeled isatin sulfonamides is most likely due to a combination of tracer binding to activated caspase-3 in the liver and impaired clearance of the tracer due to the induced liver injury.
The impaired tracer clearance observed in this model may have also contributed to the increased tracer activity observed in many of the organs analyzed during the single-tracer biodistribution studies. The treated animals had more activity in the blood than in the controls, which could lead to the increased activity in the other organs. However, we noted that the activity in the organs of the treated animals in the single-tracer biodistribution studies with [18F]WC-II-89 and [18F]WC-IV-3 as well as the dual tracer study with [18F]WC-II-89 and [99mTc]mebrofenin actually remained stable or decreased between 30 and 60 minutes with the exception of the blood. However, the clearance of [99mTc]mebrofenin was more rapid from these other organs than that of [18F]WC-II-89. No statistically significant differences were observed in any of the measured organs at 60 minutes with [99mTc]mebrofenin, but these same organs still had increased [18F]WC-II-89. Additionally, the subset of organs analyzed by the fluorometric caspase-3 enzyme assay had measurable increases in caspase-3 activity that were statistically significant. These findings together suggest that impaired tracer clearance alone does not explain the increased activity of the radiolabeled isatins in these organs and that specific binding to caspase-3 is a more likely explanation.
All of the treated animals in the single-tracer biodistribution study had increased tracer levels in the blood. The increased blood activity levels could also be another explanation for the increased activity in all of the organs, as the blood was not removed from these organs before counting. However, while the activity in the organs remained stable or decreased between 30 and 60 minutes, the activity measured in the blood actually increased in these same animals. In the dual tracer study, the [99mTc]mebrofenin levels in the treated animals continued to decrease between 30 and 60 minutes, while [18F]WC-II-89 activity increased. The fact that the blood activity levels increased while the activity in the other organs remained stable or decreased suggests that the increased activity observed in organs from the treated animals is not fully explained simply by the blood activity levels. Additionally, Q-VD-OPH reduced the measured levels of [18F]WC-II-89 in the blood of anti-Fas antibody treated animals to that untreated controls. These data suggest that the blood contains a trapping compartment for the radiolabeled isatins with this model. This is most likely due to apoptosis induced in the lymphocytes, as these cells express the CD95 receptor and are sensitive to apoptosis induction through this receptor [25].
Our data overall support the hypothesis that the radiolabeled isatins do indeed bind specifically to caspase-3 in vivo. However, sensitivity remains an issue. No caspase-3 activity could be detected in the livers from any animals treated with Q-VD-OPH. However, the increased tracer activity in the livers from same animals treated with the anti-Fas antibody could not be completely blocked by Q-VD-OPH. Additionally, the magnitude of increased tracer activity in the single-tracer biodistribution studies did not match the much greater magnitude of increased measured caspase-3 activity. Therefore, these compounds will likely need further optimization before they can be used to detect clinical levels of apoptosis in human disease.
CONCLUSION
The radiolabeled isatins appear to bind specifically to caspase-3 in vivo. However, further optimization will be needed to improve their sensitivity for clinical applications.
Acknowledgments
The authors would like to thank Nicole Fettig, Margaret Morris, Amanda Roth, Ann Stroncek and Lori Strong in the Washington University MicroPET Facility for assistance with imaging and biodistribution studies and Richard Laforest for assistance in reconstructing the microPET images. These studies were funded by NIH HL13851 and EB006702.
Footnotes
Publisher's Disclaimer: This is a PDF file of an unedited manuscript that has been accepted for publication. As a service to our customers we are providing this early version of the manuscript. The manuscript will undergo copyediting, typesetting, and review of the resulting proof before it is published in its final citable form. Please note that during the production process errors may be discovered which could affect the content, and all legal disclaimers that apply to the journal pertain.
References
- 1.Yagle KJ, Eary JF, Tait JF, Grierson JR, Link JM, Lewellen B, et al. Evaluation of 18F-annexin V as a PET imaging agent in an animal model of apoptosis. J Nucl Med. 2005;46(4):658–66. [PubMed] [Google Scholar]
- 2.Madar I, Ravert H, Nelkin B, Abro M, Pomper M, Dannals R, et al. Characterization of membrane potential-dependent uptake of the novel PET tracer 18F-fluorobenzyl triphenylphosphonium cation. Eur J Nucl Med Mol Imaging. 2007;34(12):2057–65. doi: 10.1007/s00259-007-0500-8. [DOI] [PubMed] [Google Scholar]
- 3.Madar I, Ravert HT, Du Y, Hilton J, Volokh L, Dannals RF, et al. Characterization of uptake of the new PET imaging compound 18F-fluorobenzyl triphenyl phosphonium in dog myocardium. J Nucl Med. 2006;47(8):1359–66. [PubMed] [Google Scholar]
- 4.Reshef A, Shirvan A, Waterhouse RN, Grimberg H, Levin G, Cohen A, et al. Molecular imaging of neurovascular cell death in experimental cerebral stroke by PET. J Nucl Med. 2008;49(9):1520–8. doi: 10.2967/jnumed.107.043919. [DOI] [PubMed] [Google Scholar]
- 5.Cohen A, Shirvan A, Levin G, Grimberg H, Reshef A, Ziv I. From the Gla domain to a novel small-molecule detector of apoptosis. Cell Res. 2009 doi: 10.1038/cr.2009.17. [DOI] [PubMed] [Google Scholar]
- 6.Reed JC. Apoptosis mechanisms: implications for cancer drug discovery. Oncology (Williston Park) 2004;18(13 Suppl 10):11–20. [PubMed] [Google Scholar]
- 7.Green DR. Apoptotic pathways: ten minutes to dead. Cell. 2005;121(5):671–4. doi: 10.1016/j.cell.2005.05.019. [DOI] [PubMed] [Google Scholar]
- 8.Thornberry NA, Lazebnik Y. Caspases: enemies within. Science. 1998;281(5381):1312–6. doi: 10.1126/science.281.5381.1312. [DOI] [PubMed] [Google Scholar]
- 9.Broker LE, Kruyt FA, Giaccone G. Cell death independent of caspases: a review. Clin Cancer Res. 2005;11(9):3155–62. doi: 10.1158/1078-0432.CCR-04-2223. [DOI] [PubMed] [Google Scholar]
- 10.Kitanaka C, Kuchino Y. Caspase-independent programmed cell death with necrotic morphology. Cell Death Differ. 1999;6(6):508–15. doi: 10.1038/sj.cdd.4400526. [DOI] [PubMed] [Google Scholar]
- 11.Salvesen GS, Dixit VM. Caspases: intracellular signaling by proteolysis. Cell. 1997;91(4):443–6. doi: 10.1016/s0092-8674(00)80430-4. [DOI] [PubMed] [Google Scholar]
- 12.Vaux DL, Strasser A. The molecular biology of apoptosis. Proc Natl Acad Sci U S A. 1996;93(6):2239–44. doi: 10.1073/pnas.93.6.2239. [DOI] [PMC free article] [PubMed] [Google Scholar]
- 13.Elmore S. Apoptosis: a review of programmed cell death. Toxicol Pathol. 2007;35(4):495–516. doi: 10.1080/01926230701320337. [DOI] [PMC free article] [PubMed] [Google Scholar]
- 14.Chapman JG, Magee WP, Stukenbrok HA, Beckius GE, Milici AJ, Tracey WR. A novel nonpeptidic caspase-3/7 inhibitor, (S)-(+)-5-[1-(2-methoxymethylpyrrolidinyl)sulfonyl]isatin reduces myocardial ischemic injury. Eur J Pharmacol. 2002;456(1-3):59–68. doi: 10.1016/s0014-2999(02)02484-6. [DOI] [PubMed] [Google Scholar]
- 15.Lee D, Long SA, Adams JL, Chan G, Vaidya KS, Francis TA, et al. Potent and selective nonpeptide inhibitors of caspases 3 and 7 inhibit apoptosis and maintain cell functionality. J Biol Chem. 2000;275(21):16007–14. doi: 10.1074/jbc.275.21.16007. [DOI] [PubMed] [Google Scholar]
- 16.Chen DL, Zhou D, Chu W, Herrbrich PE, Jones LA, Rothfuss JM, et al. Comparison of radiolabeled isatin analogs for imaging apoptosis with positron emission tomography. Nucl Med Biol. 2009;36(6):651–8. doi: 10.1016/j.nucmedbio.2009.03.008. [DOI] [PMC free article] [PubMed] [Google Scholar]
- 17.Zhou D, Chu W, Rothfuss J, Zeng C, Xu J, Jones L, et al. Synthesis, radiolabeling, and in vivo evaluation of an 18F-labeled isatin analog for imaging caspase-3 activation in apoptosis. Bioorg Med Chem Lett. 2006;16(19):5041–6. doi: 10.1016/j.bmcl.2006.07.045. [DOI] [PubMed] [Google Scholar]
- 18.Faust A, Wagner S, Law MP, Hermann S, Schnockel U, Keul P, et al. The nonpeptidyl caspase binding radioligand (S)-1-(4-(2-[18F]Fluoroethoxy)-benzyl)-5-[1-(2-methoxymethylpyrrolidinyl)s ulfonyl]isatin ([18F]CbR) as potential positron emission tomography-compatible apoptosis imaging agent. Q J Nucl Med Mol Imaging. 2007;51(1):67–73. [PubMed] [Google Scholar]
- 19.Nguyen QD, Smith G, Glaser M, Perumal M, Arstad E, Aboagye EO. Positron emission tomography imaging of drug-induced tumor apoptosis with a caspase-3/7 specific [18F]-labeled isatin sulfonamide. Proc Natl Acad Sci U S A. 2009;106(38):16375–80. doi: 10.1073/pnas.0901310106. [DOI] [PMC free article] [PubMed] [Google Scholar]
- 20.Ogasawara J, Watanabe-Fukunaga R, Adachi M, Matsuzawa A, Kasugai T, Kitamura Y, et al. Lethal effect of the anti-Fas antibody in mice. Nature. 1993;364(6440):806–9. doi: 10.1038/364806a0. [DOI] [PubMed] [Google Scholar]
- 21.Blankenberg FG, Katsikis PD, Tait JF, Davis RE, Naumovski L, Ohtsuki K, et al. In vivo detection and imaging of phosphatidylserine expression during programmed cell death. Proc Natl Acad Sci U S A. 1998;95(11):6349–54. doi: 10.1073/pnas.95.11.6349. [DOI] [PMC free article] [PubMed] [Google Scholar]
- 22.Ghibellini G, Leslie EM, Pollack GM, Brouwer KL. Use of tc-99m mebrofenin as a clinical probe to assess altered hepatobiliary transport: integration of in vitro, pharmacokinetic modeling, and simulation studies. Pharm Res. 2008;25(8):1851–60. doi: 10.1007/s11095-008-9597-0. [DOI] [PMC free article] [PubMed] [Google Scholar]
- 23.Zhou D, Chu W, Chen DL, Wang Q, Reichert DE, Rothfuss J, et al. [18F]- and [11C]-labeled N-benzyl-isatin sulfonamide analogues as PET tracers for apoptosis: synthesis, radiolabeling mechanism, and in vivo imaging study of apoptosis in Fas-treated mice using [11C]WC-98. Org Biomol Chem. 2009;7(7):1337–48. doi: 10.1039/b819024k. [DOI] [PMC free article] [PubMed] [Google Scholar]
- 24.Ogura Y, Krams SM, Martinez OM, Kopiwoda S, Higgins JP, Esquivel CO, et al. Radiolabeled annexin V imaging: diagnosis of allograft rejection in an experimental rodent model of liver transplantation. Radiology. 2000;214(3):795–800. doi: 10.1148/radiology.214.3.r00mr34795. [DOI] [PubMed] [Google Scholar]
- 25.Leithauser F, Dhein J, Mechtersheimer G, Koretz K, Bruderlein S, Henne C, et al. Constitutive and induced expression of APO-1, a new member of the nerve growth factor/tumor necrosis factor receptor superfamily, in normal and neoplastic cells. Lab Invest. 1993;69(4):415–29. [PubMed] [Google Scholar]