

Abstract
Malignant gliomas are highly invasive brain tumors that currently lack effective treatment. Unlike other cancers, gliomas do not metastasize via the vasculature but invade surrounding brain solely along extracellular routes, primarily moving along the vasculature and nerve tracts. This study uses several model systems to visualize and quantitatively assess cell volume changes of human glioma cells invading within the brain's extracellular space of C.B.17 severe combined immunodeficient (scid) mice and tumor cells invading in a modified Boyden chamber using three-dimensional multiphoton and confocal time-lapse microscopy. Regardless of model system used to quantitatively assess volume changes, invading glioma cells maximally decreased their volume by 30–35%, a value that was independent of barrier and cell size. Through osmotic challenges, we demonstrate that the observed cellular volume changes during invasion represent the smallest achievable cell volume and require glioma cells to release all free unbound cytoplasmic water. Water osmotically follows the release of Cl− through ion channels and cotransporters and blockade of Cl− flux inhibits both volume changes and cell invasion. Hence, invading glioma cells use hydrodynamic volume changes to meet the spatial constraints imposed within the brain, using essentially all free, unbound cytoplasmic water to maximally alter their volume as they invade.
Introduction
Glial-derived tumors, also known as gliomas, have limited treatment options and carry a dismal prognosis with median patient survival time of 12 months from diagnosis (Krex et al., 2007). Notoriously, gliomas invade into surrounding brain tissue, limiting successful surgical resection and increasing recurrence (Giese et al., 1994). The capacity of gliomas to infiltrate the brain has been extensively studied, emphasizing intercellular interactions and the invading cell's ability to degrade the extracellular matrix (Berens et al., 1994; Giese et al., 1994; Tysnes et al., 1996; Ohnishi et al., 1997; Beliën et al., 1999; Demuth and Berens, 2004). Rather than spreading hematogenously, as is common among tumors, glioma cells migrate along white matter tracks or use the vasculature's abluminal surface as a conduit (Rutka et al., 1988; Pedersen et al., 1995). It is unclear how the physical constraints of extracellular spaces affect invading cells. Electron micrographic images portray invading glioma cells as elongated, slender wedge-shaped (Soroceanu et al., 1999), consistent with cell volume reduction. Volume changes may permit cells to adapt to environmental spatial constraints, yet alternatively cells may undergo shape changes while maintaining a constant volume. Therefore, one principal objective of this study was to determine whether cell invasion is intrinsically associated with and may even require changes in overall cell volume.
Previous studies suggest that cell volume changes that occur as a result of osmotic changes use K+ and Cl− ions. These ions flux via channels and transporters along with obligated water to reestablish the normal cellular volume (Sontheimer, 2008). Putative K+ and Cl− channels that engage in volume changes of glioma cells have been identified through molecular cloning and biophysical studies. These channels include gBK, a Ca2+-activated K+ channel, and ClC-2 and ClC-3, voltage-gated Cl− channels (Liu et al., 2002; Olsen et al., 2003). However, it unknown whether spontaneously occurring volume changes of invading cells are similarly accompanied by ion flux, yet indirect evidence using pharmacological inhibition or experimental downregulation of channel expression with shRNA suggests this to be the case (Soroceanu et al., 1999; Ransom et al., 2001; McFerrin and Sontheimer, 2006; Weaver et al., 2006; Habela et al., 2009; Cuddapah and Sontheimer, 2010; Lui et al., 2010).
Hence in this study, we set out to examine whether glioma cells modulate their cell volume during invasion through extracellular spaces in the living brain, in brain tissue, or in artificial barrier membranes. We asked whether cell volume changes are necessary for cell invasion and, if so, whether these are mediated by the coordinated flux of ions acting as osmolytes. Using quantitative three-dimensional multiphoton and confocal time-lapse microscopy, we imaged cell invasion in vivo, in situ, and in vitro. We show that in each condition, invading glioma cells decreased their volume by 30–35%, regardless of their starting volume or the size of the barrier encountered. These values resembled the maximally achievable cellular volume decrease as determined through hyperosmotic dehydration experiments, suggesting that invading cells secrete essentially all the osmotically active cytoplasm to maximize their chance of crossing narrow barriers.
Materials and Methods
Cell culture.
D54-MG and U251-MG glioma cells (WHO IV, glioblastoma multiforme) were gifts from Dr. D. Bigner (Duke University, Durham, NC), and Dr. Yancey Gillespie (University of Alabama at Birmingham, Birmingham, AL), respectively. Stable EGFP-expressing daughter lines (D54-EGFP and U251-EGFP) were developed through transfection with pEGFP-N1 (Clontech). Cells were grown in DMEM/F-12 supplemented with 2 mm l-glutamine (Invitrogen) with 7% fetal bovine serum (FBS; Aleken Biologicals) at 37°C and 10% CO2. Plasmid insertion was maintained with G418 disulfate salt (Invitrogen).
Solutions.
Unless otherwise stated, all reagents used were purchased from Sigma Aldrich. Drugs were directly added to 17% serum in media or migration assay buffer (MAB; 0.1% fatty acid free-BSA in serum-free media supplemented with 2 mm l-glutamine) from stock solutions. 5-Nitro-2-(3-phenylpropylamino)benzoic acid (NPPB) and R-(+)-[(2-n-butyl-6,7-dichloro-2-cyclopentyl-2,3-dihydro-1-oxo-1H-inden-5-yl)oxy]acetic acid (DIOA) were suspended at ×1000 final concentration in DMSO, epidermal growth factor (EGF) was dissolved at ×1000 final concentration in 0.2% BSA in water, and CdCl2 was dissolved at ×1000 final concentration in double-distilled water.
In vivo invasion/migration assay.
Experiments were performed in accordance with the University of Alabama Institutional Animal Care and Use Committee. Six- to 12-week-old C.B.-17 scid mice of either sex were anesthetized by 2–5% isoflurane. A midline scalp incision was cut followed by a 0.5 mm burr hole 1.0–2.0 mm to the left or right of the midline in the frontal brain. D54-EGFP tumor cells (1.25–5.0 × 10⁵) in methylcellulose were stereotactically injected 1.5–2.0 mm deep via a 250 μl Hamilton syringe with a 30 gauge needle (BD Biosciences) mounted in a Stoelting stereotaxic apparatus. The incision was closed using skin glue and mice recovered for 2–3 weeks to allow tumor growth. Three to 5 d before imaging studies, animals had an 8-mm-diameter cranial glass window placed over the area of tumor implantation with a metal immobilization bar placed on the anterior skull, following a previously described protocol (Holtmaat et al., 2009). On the day of imaging, tail vein injections of 300 μl of 5 mg/ml 70,000 molecular weight tetramethylrhodamine dextran (Invitrogen) were administered. For imaging, the animal was mounted via the immobilization bar under the microscope. Cells migrating away from the tumor mass were imaged for 3–4 h periods using a multiphoton laser scanning fluorescence microscope (Prairie Technologies) equipped with a ×60/0.90 W water-immersion objective (Olympus). Image analysis was performed using Imaris 6.15 Software (Bitplane Scientific Software) and volume measurements were obtained by reconstruction analysis using Image Pro 3D Suite software (Media Cybernetics). Individual cell volume changes were calculated relative to each cell's maximum volume measured and then averaged.
Ex vivo invasion/migration assay.
Tumor implantation surgeries were done as mentioned above using D54-EGFP and U251-EGFP cells. On the day of the experiment, mice were anesthetized by injection of ∼100 μl of a ketamine/xylazine mixture (25 mg/ml each). Careful dissection of the thoracic cavity was performed to visualize the heart. Two hundred to 400 μl of 5 mg/ml 2,000,000 molecular weight tetramethylrhodamine dextran solution (Invitrogen) was intracardially injected and allowed to circulate. Following this, a rapid craniotomy was executed with the cerebellum removed and discarded. The brain was then placed in ice-cold artificial CSF (ACSF) (120.0 mm NaCl, 3.0 mm KCl, 1.0 mm MgCl2, 26.2 mm NaHCO3, 11.1 mm glucose, and 5.0 mm HEPES) oxygenated with 95% O2/5% CO2 to maintain pH at 7.4. Three-hundred-micrometer coronal slices were cut and allowed to recover for 0.5–1.5 h at room temperature in oxygenated ACSF supplemented with 0.1% FBS and 2 mm CaCl2. Individual slices were placed in a heated chamber and under constant perfusion of oxygenated ACSF supplemented with CaCl2 and FBS. Invading tumor cells were imaged for 3–4 h using an Olympus Fluoview 300 laser scanning microscope (LSM) with a ×60/0.90 W water-immersion lens. EGFP was excited by an argon laser (excitation 488 nm), and the rhodamine dextran was excited by a helium laser (excitation 555). Z-stacks consisting of 100–400 optical sections 800 nm apart were acquired every 15–20 min. Volume measurements were made using Image Pro 3D Suite software and individual cell volume changes were calculated relative to each cell's maximum volume measured and then averaged.
In situ invasion/migration assay.
Staining of the vasculature and preparation of acute brain slices were performed as described above. After recovering at room temperature for 0.5–1.5 h, slices were transferred to an incubator maintaining them at 37°C and 5% CO2 for 0.5–1.0 h. D54-EGFP or U251-EGFP cells were resuspended in ACSF supplemented with FBS and CaCl2. Seventy thousand to 100,000 cells were seeded onto the surface of the acute brain slice and allowed to invade for 0.5–1.5 h before being transferred to the heated chamber on the microscope. Tumor cells adherent to blood vessels were imaged as in the ex vivo invasion assay. In the studies using application of chloride channel and cotransporter inhibitors, stock drug solutions were diluted into ACSF supplemented with FBS and CaCl2 after individual cells adherent to blood vessels were identified.
Transwell migration assays.
Cell culture filter inserts (8.0 μm pores) were coated on the lower surface with 3 μg/ml vitronectin in PBS at 37°C, 10% CO2 overnight. Four hundred microliters of MAB were added to the lower chamber. Forty thousand D54-EGFP cells in MAB were seeded in the top chamber for 30 min to allow for adherence to the filter's membrane. Drugs were added to the lower chamber and returned to 37°C, 10% CO2 for 3.5 h. To assay the percentage of cells migrating as a function of time, cells on the lower filter surface were fixed and stained with crystal violet for nuclei visualization and counting. The cells remaining on the top of the filters were wiped away. For each filter, five fields of view were imaged using a 20× objective on a Zeiss Axiovert 200 M microscope. Migrated cells were counted using ImageJ (NIH Image, NIH).
For imaging of cell migration across the Transwell barrier, 10,000 cells D54-EGFP or U251-EGFP cells were seeded in 8.0 μm pore cell culture filter inserts (BD Biosciences), coated on the bottom with 3 μg/ml vitronectin. The lip of the insert was coated with vacuum grease and the inside volume of the insert was filled with MAB, inverted, and allowed to adhere to a plastic chamber so that no MAB could escape from the volume held within the insert itself. Warm 3% agar in PBS was added to further secure the insert if necessary. A prewarmed solution of 17% serum-containing media and 10 ng/ml EGF was poured into the chamber to completely surround the insert and cover the entire membrane's surface. The chamber was maintained at 37°C and 10% CO2. Cells were imaged with a Olympus Fluoview 300 LSM using a 60×/0.90 W water-immersion lens following individual cells migrating from one side of the membrane to the other. Z-stacks consisting of 50–120 optical sections 800 nm apart were acquired every 15–25 min. Volume measurements were generated using Image Pro 3D Suite software and individual cell volume changes were calculated relative to each cell's maximum volume measured and then averaged. These experiments were repeated with 3.0 μm (BD Biosciences) and 5.0 μm cell culture filter inserts (Millipore) with slight modification to the protocol above: vitronectin was not coated on the top surface of the filter before seeding the cells on the top of the membrane's surface. In the studies using chloride channel and cotransporter inhibitors, the drugs were applied to the chemoattractant-containing volume upon initiation of invasion/migration.
Hyperosmotic challenges during in situ invasion/migration assay.
The in situ invasion assay was repeated as previously described using D54-EGFP. Once cells had invaded the tissue, a single Z-stack was acquired consisting of 50–200 optical sections 800 nm apart. Following this, the ACSF supplemented with CaCl2 perfusing the slice was exchanged for ACSF supplemented with CaCl2 containing increasing amounts of mannitol. A Z-stack was acquired to capture new cell volumes after challenge. Each tissue slice was subjected to acute 100, 150, 300, 600, and 900 mOsm mannitol challenges added to ACSF in a stepwise manner, and Z-stacks were acquired for each condition from which the total cellular volumes were determined. Individual cell volume changes were calculated relative to each cell's initial volume measured at 300 mOsm and then averaged.
Data analysis.
All data obtained were analyzed using Origin 6.0 software (Microcal Software). Statistical tests were performed using GraphPad Instat (GraphPad Software). All measurements are reported with SEM.
Results
Dynamic volume changes accompany cell invasion in vivo
A key question of this study was whether glioma cells undergo cell volume changes as they move through narrow extracellular brain spaces. Volume changes may allow cells to adapt to spatial constrictions in their environment; however, cells may undergo rather pronounced shape changes while maintaining a constant volume. Our first approach was to measure volume changes occurring as glioma cell invade the brain of a living mouse, taking advantage of multiphoton LSM. EGFP-expressing human glioma cells (D54-EGFP cells), derived from a WHO grade IV glioma (Bigner et al., 1981), were stereotactically implanted into the cerebrum of scid mice and allowed to proliferate and invade brain tissue for 2–4 weeks. A cranial glass window was then positioned over the area of implantation. Rhodamine dextran dye was injected into the tail vein, resulting in a clear outline of the vasculature including fine branches. A representative image (Fig. 1A) shows significant tumor burden associated with the vasculature, and under higher magnification, single migratory cells could be identified (Fig. 1B). Individual cells were imaged for 3–4 h, the duration of the anesthesia, acquiring Z-stacks consisting of 100–400 optical sections 400 nm apart every 15 min. The resulting image stacks were rendered in three dimensions (3D) for volume and velocity determination using ImagePro software. Invasion/migration speed ranged from 6.50 to 13.25 μm/h. Figure 1C shows cell volumes as a function of time for two representative cells, which exhibited significant cell volume fluctuations. Average volume change observed in four migrating glioma cells in vivo was of 32.41 ± 1.61%.
Figure 1.

Invading/migrating glioma cells from mice bearing xenograft tumors undergo dynamic volume changes. A, Low-power image (100×) of D54-EGFP tumor mass (green) associated with vasculature (red) as viewed through a cranial window. Shown is a 3D reconstruction of 350 sections taken 400 nm apart. Scale bar, 100 μm. B, High-power image (600×) of individual tumor cells (green) invading and migrating away from the main tumor mass. Vasculature is red. Shown is a two-dimensional reconstruction of 90 sections taken 400 nm apart. Scale bar, 50 μm. C, Volume changes of the two invading cells depicted in B over a 4 h time course. Every 15 min, Z-stacks consisting of 80–110 optical sections 400 nm apart were acquired. In all images, the vasculature was highlighted (red) by rhodamine dextran administered by tail vein injection.
Glioma cells invading/migrating along vasculature in situ undergo dynamic volume changes
To complement the above studies, we next asked whether similar volume changes can be observed in acute brain slices that are more amendable to experimental manipulation. For the first series of studies, we isolated 300 μm acute brain slices from the tumor bearing scid mice described above, implanted with either D54-EGFP or U251-EGFP human glioma cells. Akin to the in vivo studies, the vasculature was labeled by rhodamine dextran delivered via intracardiac injection. This facilitated the identification of tumor cells adherent to blood vessels. Volume measurements were made from individual cells as they migrated along the vasculature over a time period of 3–4 h. Volume changes in tumor cells from animals xenografted with D54-EGFP and U251-EGFP human glioma cells were 30.71 ± 1.28% (n = 7) and 29.97 ± 1.98% (n = 11), respectively, values remarkably similar to those observed in vivo. Figure 2A displays still-frame images taken at three different time points for representative D54-EGFP glioma cells migrating along blood vessels over a 4 h time period. Quantitative assessment of volume changes that accompanied the cell's movement are plotted in Figure 2B.
Figure 2.

Invasion in brain slices is associated with cell volume changes. A, 3D reconstructions of various time points during ex vivo invasion/migration assay (Time 0, 120, and 240 min) highlighting shape and volume changes occurring. Every 15 min, 600× Z-stacks of 50–150 sections taken 800 nm apart were acquired. Scale bar, 20 μm. B, Volume measurements of single glioma cell invading along the vasculature highlighted in A (arrowhead). C, Volume reconstructions of various time points during in situ invasion/migration assay (Time 0, 120, and 240 min) highlighting shape and volume changes occurring. Every 15 min, 600× Z-stacks of 50–150 sections taken 800 nm apart were acquired. Scale bar, 20 μm. D, Volume measurements of single glioma cell invading and migrating along the vasculature highlighted in C. E, Comparison of cellular volume changes occurring during glioma invasion/migration in various model systems using D54-EGFP and U251-EGFP cells.
In a second invasion model system, we seeded D54-EGFP or U251-EGFP human glioma cells on the surface of freshly sectioned 300 μm scid mouse brain slices and allowed cells to invade into the tissue (Soroceanu et al., 1999; Montana and Sontheimer, 2011). Cells rapidly attached to blood vessels and were imaged over a period of 2–4 h. Figure 2C shows a series of still frames of a representative D54-EGFP cell found adherent to a blood vessel at three different time points. Over time the cell traveled from one vasculature bifurcation to another, extending a cellular process forward followed by retracting its posterior end. Figure 2D show the corresponding volume fluctuations for this glioma cell, analyzed as described above. Cell volume measurements of additional cells demonstrated averages of 33.13 ± 4.08% (n = 7) and 30.84 ± 1.78% (n = 6) volume changes in D54-EGFP and U251-EGFP cells, respectively. Volume changes for each model system are summarized in Figure 2E.
Since we hypothesize that the observed volume changes are intrinsically linked to glioma cell invasion and migration, including process extension and retraction, “sedentary” cells that neither move nor extend processes should not show equal volume changes. Indeed, sedentary glioma cells showed significantly smaller volume fluctuations (17.10 ± 1.23% in 11 D54-EGFP cells and 16.17 ± 1.42% in 5 U251-EGFP cells, p = 0.0007 and p = 0.0002, respectively, comparing invading versus sedentary cells, two-tailed unpaired t test).
Maximal volume changes are independent of barrier or cell size
The above-described invasion assays are used to model the human disease. However, they do not allow the visualization of physical barriers and constraints encountered by invading cells. To determine whether volume changes occur in concert with cell process extension or whether they relate to cells adjusting to the physical barriers encountered, we adopted a 3D invasion assay that permits imaging the invasion of cells through a barrier of a defined size. This modified Transwell (Boyden) invasion/migration chamber (Fig. 3A) was maintained at 37°C and pH 7.2 with images acquired using a Fluoview 300 LSM microscope through a water-immersion 60× objective. Image stacks of 50–150 sections at 800 nm were used for 3D rendering and quantitative volume analysis. Figure 3B shows multiple cells traversing pores at various stages. Figure 3C shows a representative series of 3D renderings with volume projections over 4 h for an individual glioma cell extending its process through an 8.0 μm pore in the Transwell insert, gradually traversing through the pore from one side of the membrane onto the opposite side. Chemotactic movement was initiated by presenting EGF and serum-containing media on the opposite side of the membrane, and cells moved against gravity from the bottom of the chamber to the top.
Figure 3.

Modified Transwell assay allowing real-time confocal imaging with defined barrier. A, Schematic of barrier used to image cells actively invading through pores of various sizes on the membrane of a Transwell insert. 1, Water-immersion objective (60×); 2, vitronectin (3 μg/ml); 3, Transwell invasion/migrating assay insert with pores of various size (3.0 μm, 5.0 μm, or 8.0 μm); 4, human glioma cells (D54-EGFP or U251-EGFP); 5, chemoattractant (10 ng/ml EGF in 17% serum-containing media); 6, migration assay buffer; 7, 3% agar; 8, vacuum grease. Temperature and pH were maintained at physiologic conditions and cells were imaged using a laser scanning confocal microscope. B, Confocal image of invading D54-EGFP cells (green) traversing 8.0 μm × 15.0 μm pores present on the membrane of a Transwell invasion/migration insert. Image represents a snapshot of cells midway through the process of invasion with the cell body present on either side of the membrane. Scale bar, 50 μm. C, Volume reconstructions of an individual glioma cell that successfully migrated from one side of the membrane, through the pore, to the other side of the membrane. Green, red, and blue lines represent the x-, y-, and z-axes, respectively. Image reconstructions were made from Z-stacks of 80 sections taken 800 nm apart and acquired every 20 min.
These image series allowed us to assess the cell's volume with regard to the stage of invasion, i.e., the degree to which the cell had traversed the barrier. We analyzed Transwell migration for 27 glioma cells and two different cell types, D54-EGFP (n = 19) and U251-EGFP (n = 8) cells, which did not differ significantly in their overall behavior (p = 0.4418, two-tailed unpaired t test), yielding average volume changes of 32.21 ± 2.13% for D54-EGFP and 29.43 ± 2.03% for the U251-EGFP glioma cells. Therefore, we used D54-EGFP cells for the remaining experiments. A universal pattern of volume changes emerged whereby cells underwent an initial cell volume decrease, reaching a minimum when cells appeared to be approximately halfway through the pore, resembling a dumbbell in the 3D rendering (Fig. 4A, inset), followed by a gradual volume increase as the cell completed migration through the pore (Fig. 4A). To illustrate that this was shared by all cells, we determined the relative percentage of the cell that had migrated through the Transwell filter at the lowest recorded cell volume for each cell (Fig. 4B). This value was 51.32 ± 7.21%, suggesting that on average the lowest volume was recorded with approximately half of the cell on each side of the membrane (Fig. 4B, p = 0.7972, two-tailed unpaired t test). The maximal rate of volume decrease, 53.54 ± 7.58 fl/min, observed as the cell approaches its minimum, and the ensuing volume increase, 58.77 ± 7.61 fl/min, are not significantly different (p = 0.6294, two-tailed unpaired t test), suggesting that cells increase and decrease their volume at equivalent rates. The velocity during the process of volume decrease, as the cell crossed the barrier's membrane, ranged from 2.40 to 57.60 μm/h with an average of 18.00 ± 3.13 μm/h. Regression analysis suggested that velocity was not correlated with the rate of volume decrease (data not shown, y = −17.587x + 2653.3, R2 = 0.01277, R = −0.1130).
Figure 4.

Comparable cellular volume changes occur during in vitro invasion/migration assay. A, Cell volume measurements of cells that successfully traversed 8.0 μm pores were obtained every 15–30 min for each cell examined. Each cell volume was normalized to its minimum cell volume measured and set to time 0. Minimum cell volumes were observed when the cell had traversed halfway through the pore forming a characteristic dumbbell shape (inset; scale bar, 15 μm). B, Percentage of cell volume located on either side of the membrane of Transwell invasion/migration insert at the cell's minimum volume measured. The initial plane of the membrane facing the surface the cells were initially seeded onto (initial side) was used as the reference value. p = 0.7972, two-tailed unpaired t test. C, Comparison of total volume change of cells that invaded and migrated through 8.0 μm pores (invading) versus noninvading and nonmigrating cells (sedentary). p = 0.0001; two-tailed unpaired t test. D, Fluctuations of volumes exhibited by sedentary glioma cells. Each cell volume was normalized to its median cell volume. E, A linear correlation exists between the total volume change and the maximum total volume measured in cells migrating through an 8.0 μm pore, y = 0.3365x − 111.93, R2 = 0.7366, R = 0.8583. F, Total volume change occurring in glioma cells during the process of invasion and migration is independent of the size of the barrier. p = 0.8633, two-tailed unpaired t test.
For control purposes, volume changes were measured for glioma cells that were exposed to the same experimental conditions but failed to invade through the pores. The overall volume changes of these sedentary glioma cells were significantly less than the invading cells (Fig. 4C, invading cells = 32.21 ± 2.13%, sedentary cells = 14.55 ± 1.00%, n = 6, p = 0.0001, two-tailed unpaired t test). Additionally, the significantly larger overall volume changes observed in invading cells were specifically associated with movement across the barriers, since sedentary cells, which failed to migrate, showed only random volume fluctuations of ±7% relative to the median cell volume measured (Fig. 4D).
The size/volume of individual cells in these assays varied considerably from cell to cell. Therefore, we questioned whether the degree of the volume change that a cell undergoes during invasion correlated with its maximal volume. Figure 4E shows a linear relationship between the maximum total cell volume and the change in the total cell volume of invading cells (Fig. 4E, y = 0.3365x − 111.93, R2 = 0.7366, R = 0.8583), suggesting that large cells require proportionally larger volume changes for invasion.
An important question was whether the volume change was dictated by the barrier size. Surprisingly, there was no significant difference in the mean cell volume of cells migrating through 5.0 μm as compared to 8.0 μm pores with values of 32.89 ± 2.65% and 32.21 ± 2.13% %, respectively (Fig. 4F, p = 0.8633, two-tailed unpaired t test). Smaller 3.0 μm pores prevented migration in all but one of 145 cells, and the one cell changed its volume by 33.04%.
Invading glioma cells approach a minimum achievable volume as they invade in situ
A cell's interior consists of the cytoskeleton and organelles, such as the nucleus, mitochondria, endoplasmic reticulum, and Golgi, along with the cytoplasm, which is a mixture of water, ions, and small organic molecules. The relative contribution of cytoplasmic water to the cellular content varies from cell to cell but is generally believed to be ∼50%. Of the cytoplasm, not all is freely diffusible, but up to 50% is bound by proteins, nucleic acids, and surfaces of organelles (Clegg, 1984b). Any rapid decrease in cell volume requires cytosol to leave the cell, most likely in the form of ions or osmolytes being released with cytosolic “free” water to follow. The above observed 30–35% volume decrease observed in invading cells may resemble the available “cytoplasmic free water space” that a cell can lose while staying viable.
To test this hypothesis, we determined the maximal decrease in cell volume possible through hyperosmotic challenges. Like most cells, glioma cells attempt to maintain a constant cell volume when hyperosmotically challenged through a process called regulatory volume increase (RVI) (Ernest and Sontheimer, 2007; McCoy and Sontheimer, 2007; Haas and Sontheimer, 2010), but in gliomas, RVI can be inhibited by removal of glutamine from the medium (Ernest and Sontheimer, 2007). Invading glioma cells in brain slices were exposed to step-like increases in osmolarity ranging from normal 300 mOsmol to 1200 mOsmol (in the absence of glutamine to inhibit RVI), and the total cell volume was determined by 3D image reconstruction in situ. These experiments were done in cells actively invading the brain and hence completely embedded in a brain slice environment and fully adherent to extracellular matrix and surrounding cells. Representative images are shown in Figure 5A for three different osmolarities. Figure 5B compares the total volume changes that occur when glioma cells were subjected to a series of osmotic challenges to the volume changes expected if the cells mimicked perfect osmometers.
Figure 5.
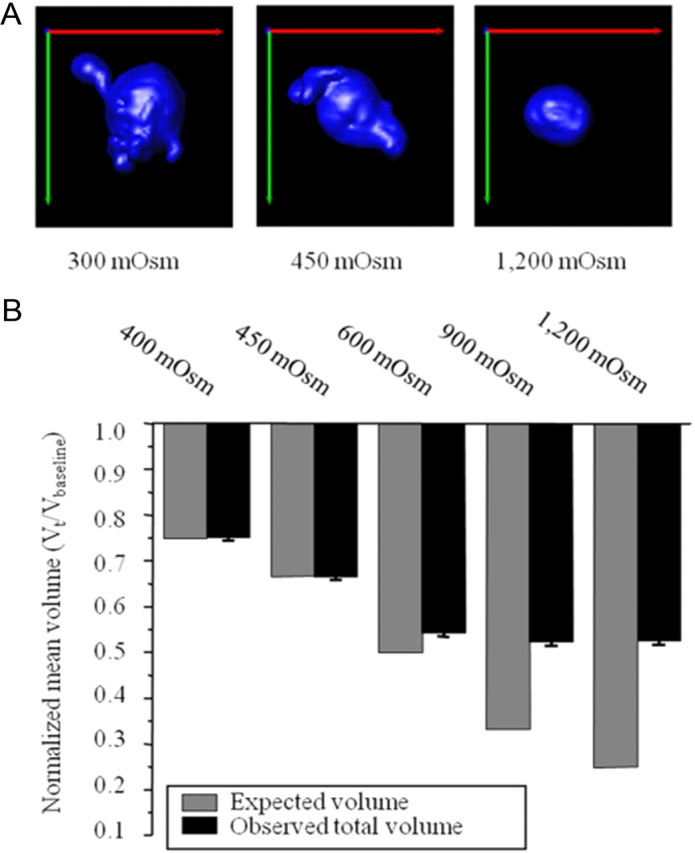
Minimal achievable cell volume. A, Representative images of glioma cells at various osmolarities (300, 450, and 1200 mOsm). Green, red, and blue lines represent the x-, y-, and z-axes, respectively. B, Actual normalized mean total cell volumes measured after hyperosmotic challenge compared to the theoretical expected for cells behaving like a perfect osmometer.
Close examination of total volume changes revealed that glioma cells appear to behave like perfect osmometers (expected volume) up to a cell volume ∼65%, i.e., up to a 35% volume decrease. Any larger challenges caused cell volume changes that deviated considerably from ideal, eventually plateauing at close to 50%. For example, when exposed to a 900 mOsm challenge of mannitol, i.e. a final osmolarity of 1200 mOsm, the total cell volume decreased 49.25 ± 5.76%, dramatically different from the expected 75% cell volume change. The inability to undergo condensation beyond 50% of the measured baseline volume suggests that all available cytoplasmic water had been secreted from the cells, and the remaining volume appears to be occupied by stationary organelles and/or bound water.
These studies provide an extreme and unphysiological lower limit for the total nuclear and cell size as being ∼50% of normal. The deviation from behaving like an osmometer at ∼65% suggests that with any changes exceeding 35%, free diffusion of water no longer suffices and that the cell poses a force to prevent lowering the cell's volume. Interestingly, an unrelated study with the same cells found that a reduction in overall cell volume to <65% of its original cell volume for extended periods of time is sufficient to activate caspase-3, thereby inducing apoptosis (Ernest et al., 2008).
Our interpretation of these studies is that the total water content of glioma cells is ∼50% of their total volume, yet the free water space is ∼35%. This value is close to the 30–33% volume change occurring in invading cells, suggesting that invading cells use essentially all of the free water when they invade.
Chloride provides the energetic driving force for cell volume reduction during invasion
Previous studies have suggested that glioma cell shrinkage is due to channel- or transporter-mediated Cl− efflux driving water out of the cells (Ernest et al., 2005). To determine whether this applies for the here-observed volume changes, the in vitro and in situ invasion/migration assays were repeated in the presence of chloride channel and transport inhibitors. The available pharmacologic inhibitors lack specificity, and our experiments merely assess the requirement for Cl− flux to accomplish volume changes in invading cells. NPPB (200 μm) and Cd2+ (250 μm) were used to block Cl− flux through chloride channels, DIOA (40 μm) was used to inhibit K+ and Cl− flux through KCl cotransporters. The concentrations used have previously been shown to significantly inhibit volume regulation in glioma cells (Ernest et al., 2005), and the drug mixture yielded a reduction in Transwell migration by 62.51 ± 11.64% compared to vehicle conditions (p = 0.0223, two-tailed unpaired t test, Fig. 6A).
Figure 6.

Chloride flux is required for volume change occurring during glioma cell invasion. A, Mixture of chloride channels and transport inhibitors (200 μm NPPB, 250 μm Cd2+, and 40 μm DIOA) significantly reduced glioma invasion through Transwell filters (*p = 0.0223, two-tailed unpaired t test). B, Fluctuations in volume exhibited by glioma cells exposed to the mixture of chloride channel and cotransporter inhibitors. Each cell volume measurement is normalized to its median cell volume. C, In vitro invasion/migration assay comparing cellular volume changes in invading (Invading) cells, noninvading and nonmigrating cells (Sedentary), and glioma cells that initiated the process of invasion and migration but were exposed to a mixture of drugs that inhibit the movement of chloride ions through chloride channels and cotransporters (+ Inhibitors). #p < 0.001, Tukey–Kramer multiple-comparisons test. D, Representative 3D reconstructions from in situ invasion/migration assay demonstrating the lack of cellular shape and volume changes that occur in the presence of chloride channel and cotransporter inhibitors. Green, D54-EGFP cells; red, vasculature. Scale bar, 20 μm. E, In situ invasion/migration assay comparing cellular volume changes in invading and migrating cells (Invading), noninvading and nonmigrating cells (Sedentary), and glioma cells that initiated the process of invasion and migration but were subsequently exposed to the mixture of drugs (+ Inhibitors). #p < 0.001, **p < 0.01; Tukey–Kramer multiple-comparisons test.
Next we imaged volume changes of cells that already extended a process through a Transwell pore and acutely received the drug mixture. Image stacks and 3D rendering as described above yielded maximum volume changes of 10.78 ± 0.41% (n = 30), significantly different from the 32.21 ± 2.13% (n = 19) volume change seen in glioma cells that successfully traversed 8.0 μm pores (Fig. 6C, p < 0.001, two-tailed unpaired t test). Interestingly, these volume changes are similar to those measured in the sedentary cells, suggesting that Cl− flux is required to achieve volume changes needed to support cell invasion. Volume change over 4 h fluctuated randomly by approximately ±5% around the median cell volume measured (Fig. 6B).
We repeated these studies imaging migration of glioma cells adherent to the vasculature in situ. The mixture of channel inhibitors prevented translocation along the blood vessel while simultaneously arresting the volume changes as illustrated for a representative cell in Figure 6D showing a lack of locomotion and cell volume and shape changes. Specifically, cells exposed to the mixture of inhibitors demonstrated maximal volume changes of 19.97 ± 2.31% (n = 5), significantly different from the 33.13 ± 4.08% (n = 7) observed in invading cells and similar to the 17.10 ± 1.23% (n = 11) seen in sedentary cells (Fig. 6E, p < 0.001, Tukey–Kramer multiple-comparisons test). These studies further suggest that the volume changes associated with invasion and migration are due to the osmotic movement of water initiated by the movement of ions.
Discussion
Using quantitative time-lapse 3D imaging, this study provides the first in vivo evidence that invading glioma cells modulate their volume as they invade the brain. Cells imaged while crossing Transwell barriers show a volume decrease by ∼30–35%, and this value was independent of cell size or the barrier size encountered. Additional experiments suggest that the observed 30–35% volume decrease represents the smallest readily achievable cell volume. This requires cells to release essentially all unbound cytoplasmic water and involved the coordinated efflux of Cl− and K+ ions along with obliged cytoplasmic water.
All volume measurements were derived from time-lapse 3D multiphoton and confocal imaging of EGFP-expressing cells allowing rendition of cells in 3D. The EGFP label was constitutively expressed and hence fluorescent intensities did not vary over the time course of the experiments, minimizing potential errors associated with thresholding cell boundaries. Stationary cells showed only small fluctuations in volume (<7% of the median cell volume) that were significantly smaller than the 30–35% volume decrease exhibited by invading cells, suggesting that the volume change facilitated the process of invasion. Pharmacological inhibition of Cl− channels not only inhibited cell invasion but also reduced volume changes to a comparable level observed in stationary cells, proposing that volume changes are mechanistically tied to cell invasion.
Cell migration is a complex and multifactorial process in which the here-observed volume changes work in concert with other well described aspects of cell invasion. Most notably, invading gliomas interact with ECM proteins via a variety of cell adhesion molecules (Merzak et al., 1994; Owens et al., 1998; Nakada et al., 2007; Kohutek et al., 2009) and release matrix-metalloproteinases (Lakka et al., 2002; Nakada et al., 2007) to degrade the extracellular matrix. Actin-myosin molecular motors propel cells as focal adhesion sites attach and detach cellular processes in a highly regulated manner (Abbas and Whitfield, 2009).
Given the spatial constraints that migrating cells encounter in brain, the observed volume changes were not unexpected, yet we were surprised that the magnitude of the volume changes invariably converged on a value of 30–35%, regardless of the model system examined and independent of the cell size and the barrier size encountered. This led us to hypothesize that this value may represent the lowest readily achievable volume of the cell, requiring the release of all unbound cytoplasmic water along with K+ and Cl−. This conclusion is supported by experiments determining volume changes of glioma cells challenged to shrink by exposure to increasing concentrations of mannitol while invading in tissue. These osmotically challenged cells behaved like perfect osmometers provided that the hyperosmotic challenge did not force cells to shrink by >35%, which was the case at an osmolarity of 450 mOsm. For larger challenges (600–1200 mOsm), actual cell volume deviated substantially and lagged behind the predicted values. This suggests that up to 35% of the cell volume is occupied by water that freely diffuses along the osmotic gradient and therefore resembles “free cytoplasmic water.” Larger osmotic gradients were able to reduce glioma cell volume by an additional 15%, but required high osmotic pressures since water was most likely bound to proteins, macromolecules, and/or organelles. Previous studies have separated cytoplasmic water into two categories with only a portion exhibiting properties of pure water and the remainder showing properties we describe, including bound water interacting with organelles, cytoskeleton, and other proteins (Clegg, 1984a,b). The absolute lowest limit that glioma cell could reach was ∼50%, a value that agrees with a literature suggesting that in most mammalian cell 50% of the cell volume is occupied by cytoplasm. At this volume, however, cells may no longer be viable. In a previous study, the sustained decrease of glioma cell volume by >35% led to apoptotic cell death presumably via the autoactivation of caspase-3 (Ernest et al., 2008). Hence the observed 35% volume decrease appears to be the maximal physiologically sustainable decrease in glioma cell volume. It is worth mentioning that the smallest barrier that glioma cells were able to traverse was 5 μm, and this size limit appears to be imposed by the size of the nucleus, which decreased in volume concomitant with the cytoplasmic volume (data not shown). Finally, we were surprised that the magnitude of the cell volume decrease did not correlate with the barrier size. One may have intuitively assumed that cells adjust their volume proportionally to the size of the barrier encountered. Our data instead suggest a possible advantage by extruding all available cytoplasmic water upon encountering a mechanical barrier. Alternatively, the osmotic change inside the cell achieved through the egress of water may create an optimal environment for the motility machinery to operate.
The above-described experiments established an osmotic gradient to extract all available cytoplasmic water from the cell. In contrast, invading cells initiate the volume decrease by releasing osmotically active ions with obligated cytoplasmic water to follow. Consistent with this model, inhibition of Cl− efflux through channels and transporters inhibited cell volume decrease and rendered cells unable to migrate across barriers in our studies. The anti-invasive action of Cl− channel/transport inhibitors agrees with numerous previous studies in gliomas and other cancers that have implicated channels and transporters in cell migration (Schwab, 2001; McFerrin and Sontheimer, 2006; Mao et al., 2007, 2008), where inhibitors of K+ and Cl− channels in particular have been shown to retard cell invasion and migration (Soroceanu et al., 1998, 1999; Ransom et al., 2001; Kim et al., 2004; Mao et al., 2005, 2009; McFerrin and Sontheimer, 2006; Weaver et al., 2006). These and other studies have ascribed a unique role to Cl− as an essential osmolyte responsible for the movement of water in and out of the glioma cell (Wang et al., 2000; Okada and Maeno, 2001; Sardini et al., 2003; Ernest et al., 2005). Consistent with this notion, various Cl− channel blockers inhibit migration, a phenomenon observed in a number of different cancers (Soroceanu et al., 1998, 1999; Shen et al., 2000; Ransom et al., 2001; Mao et al., 2007). For Cl− to function as the energetic driving force for a volume decrease, an outward-directed gradient has to be maintained. In gliomas, the Na+/K+/2Cl− transporter NKCC1 accumulates Cl− to 100–140 mm, a concentration that is 10-fold greater than observed in neurons or many other cells (Habela et al., 2009). As a result, the opening of Cl− channels is sufficient to lead to cell shrinkage, and persistent opening of Cl− channels under these conditions causes a decrease in the cell volume by 35% (Habela et al., 2009), exactly the same value that we report as the maximally achievable volume decrease by invading cells.
The presented data support a novel “hydrodynamic” glioma cell invasion model whereby ion flow acts as the energetic driving force governing the movement of cytoplasmic water across the cell membrane. Both the relative distribution of Cl− across the membrane and the cytoplasmic free water content ultimately determine the dynamic changes in cell volume and the minimal cell size achievable. We hypothesize that other migratory cells, including immature neurons, glial progenitor cells, microglia, and stem cells may use a similar hydrodynamic mechanism to aid their migration. After all, these cells share many properties with gliomas including a high proliferative potential, self-renewal, and most important to this study, the capacity to migrate. Like gliomas, glial progenitor cells migrate along white matter nerve tracts or blood vessels, and as they migrate, both cell types assume a similar unipolar morphology, extending a leading process that initiate forward movement (Cayre et al., 2009). Additional similarities include overlapping cellular signaling through platelet-derived growth factor (PDGF) and EGF (Canoll and Goldman, 2008; Cayre et al., 2009). In light of these biological traits shared between glioma cells and both neural and glial progenitors, hydrodynamic volume regulation during migration may similarly aid their migration. Consistent with this hypothesis, these cells, like gliomas, accumulate intracellular Cl− and maintain an outward-directed gradient for Cl− (Kakazu et al., 1999; Kuner and Augustine, 2000; Achilles et al., 2007; Habela et al., 2009) that could be harnessed to decrease the cell's volume in the same fashion as shown here for gliomas.
It is important to emphasize that while our data show a requirement for cell volume changes and the associated ion fluxes to aid invasion, we ascribe primarily a facilitatory role to these hydrodynamic changes. We neither show nor imply that these volume changes have an instructive role or are initiating cell movement per se. Future studies shall investigate the interactions of channels that mediate cell volume changes with the cell's cytoskeleton and actin-myosin molecular motors and the signaling events involving cell movement. These interactions may open novel avenues for the development of anti-invasive therapeutics in the future.
Footnotes
This work was supported by NIH Grants 2R01NS036692 and 5R01NS031234. The authors thank the Alabama Neuroscience Blueprint Core Center for providing use of the multiphoton microscope through the Neuroimaging Core supported by the NIH Grant NS57098. Specifically, special thanks go to Dr. Tong Ye and Dr. Lucas Pozzo-Miller for their expertise with the multiphoton experiments.
The authors declare no competing financial interests.
References
- Abbas L, Whitfield TT. Nkcc1 (Slc12a2) is required for the regulation of endolymph volume in the otic vesicle and swim bladder volume in the zebrafish larva. Development. 2009;136:2837–2848. doi: 10.1242/dev.034215. [DOI] [PMC free article] [PubMed] [Google Scholar]
- Achilles K, Okabe A, Ikeda M, Shimizu-Okabe C, Yamada J, Fukuda A, Luhmann HJ, Kilb W. Kinetic properties of Cl uptake mediated by Na+-dependent K+-2Cl cotransport in immature rat neocortical neurons. J Neurosci. 2007;27:8616–8627. doi: 10.1523/JNEUROSCI.5041-06.2007. [DOI] [PMC free article] [PubMed] [Google Scholar]
- Beliën AT, Paganetti PA, Schwab ME. Membrane-type 1 matrix metalloprotease (MT1-MMP) enables invasive migration of glioma cells in central nervous system white matter. J Cell Biol. 1999;144:373–384. doi: 10.1083/jcb.144.2.373. [DOI] [PMC free article] [PubMed] [Google Scholar]
- Berens ME, Rief MD, Loo MA, Giese A. The role of extracellular matrix in human astrocytoma migration and proliferation studied in a microliter scale assay. Clin Exp Metastasis. 1994;12:405–415. doi: 10.1007/BF01755884. [DOI] [PubMed] [Google Scholar]
- Bigner DD, Bigner SH, Pontén J, Westermark B, Mahaley MS, Ruoslahti E, Herschman H, Eng LF, Wikstrand CJ. Heterogeneity of genotypic and phenotypic characteristics of fifteen permanent cell lines derived from human gliomas. J Neuropathol Exp Neurol. 1981;40:201–229. doi: 10.1097/00005072-198105000-00001. [DOI] [PubMed] [Google Scholar]
- Canoll P, Goldman JE. The interface between glial progenitors and gliomas. Acta Neuropathol. 2008;116:465–477. doi: 10.1007/s00401-008-0432-9. [DOI] [PMC free article] [PubMed] [Google Scholar]
- Cayre M, Canoll P, Goldman JE. Cell migration in the normal and pathological postnatal mammalian brain. Prog Neurobiol. 2009;88:41–63. doi: 10.1016/j.pneurobio.2009.02.001. [DOI] [PMC free article] [PubMed] [Google Scholar]
- Clegg JS. Intracellular water and the cytomatrix: some methods of study and current views. J Cell Biol. 1984a;99:167s–171s. doi: 10.1083/jcb.99.1.167s. [DOI] [PMC free article] [PubMed] [Google Scholar]
- Clegg JS. Properties and metabolism of the aqueous cytoplasm and its boundaries. Am J Physiol. 1984b;246:R133–R151. doi: 10.1152/ajpregu.1984.246.2.R133. [DOI] [PubMed] [Google Scholar]
- Cuddapah VA, Sontheimer H. Molecular interaction and functional regulation of ClC-3 by Ca2+/calmodulin-dependent protein kinase II (CaMKII) in human malignant glioma. J Biol Chem. 2010;285:11188–11196. doi: 10.1074/jbc.M109.097675. [DOI] [PMC free article] [PubMed] [Google Scholar]
- Demuth T, Berens ME. Molecular mechanisms of glioma cell migration and invasion. J Neurooncol. 2004;70:217–228. doi: 10.1007/s11060-004-2751-6. [DOI] [PubMed] [Google Scholar]
- Ernest NJ, Sontheimer H. Extracellular glutamine is a critical modulator for regulatory volume increase in human glioma cells. Brain Res. 2007;1144:231–238. doi: 10.1016/j.brainres.2007.01.085. [DOI] [PMC free article] [PubMed] [Google Scholar]
- Ernest NJ, Weaver AK, Van Duyn LB, Sontheimer HW. Relative contribution of chloride channels and transporters to regulatory volume decrease in human glioma cells. Am J Physiol Cell Physiol. 2005;288:C1451–C1460. doi: 10.1152/ajpcell.00503.2004. [DOI] [PMC free article] [PubMed] [Google Scholar]
- Ernest NJ, Habela CW, Sontheimer H. Cytoplasmic condensation is both necessary and sufficient to induce apoptotic cell death. J Cell Sci. 2008;121:290–297. doi: 10.1242/jcs.017343. [DOI] [PMC free article] [PubMed] [Google Scholar]
- Giese A, Rief MD, Loo MA, Berens ME. Determinants of human astrocytoma migration. Cancer Res. 1994;54:3897–3904. [PubMed] [Google Scholar]
- Haas BR, Sontheimer H. Inhibition of the sodium-potassium-chloride cotransporter isoform-1 reduces glioma invasion. Cancer Res. 2010;70:5597–5606. doi: 10.1158/0008-5472.CAN-09-4666. [DOI] [PMC free article] [PubMed] [Google Scholar]
- Habela CW, Ernest NJ, Swindall AF, Sontheimer H. Chloride accumulation drives volume dynamics underlying cell proliferation and migration. J Neurophysiol. 2009;101:750–757. doi: 10.1152/jn.90840.2008. [DOI] [PMC free article] [PubMed] [Google Scholar]
- Holtmaat A, Bonhoeffer T, Chow DK, Chuckowree J, De Paola V, Hofer SB, Hübener M, Keck T, Knott G, Lee WC, Mostany R, Mrsic-Flogel TD, Nedivi E, Portera-Cailliau C, Svoboda K, Trachtenberg JT, Wilbrecht L. Long-term, high-resolution imaging in the mouse neocortex through a chronic cranial window. Nat Protoc. 2009;4:1128–1144. doi: 10.1038/nprot.2009.89. [DOI] [PMC free article] [PubMed] [Google Scholar]
- Kakazu Y, Akaike N, Komiyama S, Nabekura J. Regulation of intracellular chloride by cotransporters in developing lateral superior olive neurons. J Neurosci. 1999;19:2843–2851. doi: 10.1523/JNEUROSCI.19-08-02843.1999. [DOI] [PMC free article] [PubMed] [Google Scholar]
- Kim MJ, Cheng G, Agrawal DK. Cl- channels are expressed in human normal monocytes: a functional role in migration, adhesion and volume change. Clin Exp Immunol. 2004;138:453–459. doi: 10.1111/j.1365-2249.2004.02635.x. [DOI] [PMC free article] [PubMed] [Google Scholar]
- Kohutek ZA, diPierro CG, Redpath GT, Hussaini IM. ADAM-10-mediated N-cadherin cleavage is protein kinase C-α dependent and promotes glioblastoma cell migration. J Neurosci. 2009;29:4605–4615. doi: 10.1523/JNEUROSCI.5126-08.2009. [DOI] [PMC free article] [PubMed] [Google Scholar]
- Krex D, Klink B, Hartmann C, von Deimling A, Pietsch T, Simon M, Sabel M, Steinbach JP, Heese O, Reifenberger G, Weller M, Schackert G. Long-term survival with glioblastoma multiforme. Brain. 2007;130:2596–2606. doi: 10.1093/brain/awm204. [DOI] [PubMed] [Google Scholar]
- Kuner T, Augustine GJ. A genetically encoded ratiometric indicator for chloride: capturing chloride transients in cultured hippocampal neurons. Neuron. 2000;27:447–459. doi: 10.1016/s0896-6273(00)00056-8. [DOI] [PubMed] [Google Scholar]
- Lakka SS, Rajan M, Gondi C, Yanamandra N, Chandrasekar N, Jasti SL, Adachi Y, Siddique K, Gujrati M, Olivero W, Dinh DH, Kouraklis G, Kyritsis AP, Rao JS. Adenovirus-mediated expression of antisense MMP-9 in glioma cells inhibits tumor growth and invasion. Oncogene. 2002;21:8011–8019. doi: 10.1038/sj.onc.1205894. [DOI] [PubMed] [Google Scholar]
- Liu X, Chang Y, Reinhart PH, Sontheimer H, Chang Y. Cloning and characterization of glioma BK, a novel BK channel isoform highly expressed in human glioma cells. J Neurosci. 2002;22:1840–1849. doi: 10.1523/JNEUROSCI.22-05-01840.2002. [DOI] [PMC free article] [PubMed] [Google Scholar]
- Lui VC, Lung SS, Pu JK, Hung KN, Leung GK. Invasion of human glioma cells is regulated by multiple chloride channels including ClC-3. Anticancer Res. 2010;30:4515–4524. [PubMed] [Google Scholar]
- Mao J, Wang L, Fan A, Wang J, Xu B, Jacob TJ, Chen L. Blockage of volume-activated chloride channels inhibits migration of nasopharyngeal carcinoma. Cell Physiol Biochem. 2007;19:249–258. doi: 10.1159/000100644. [DOI] [PubMed] [Google Scholar]
- Mao J, Chen L, Xu B, Wang L, Li H, Guo J, Li W, Nie S, Jacob TJ, Wang L. Suppression of ClC-3 channel expression reduces migration of nasopharyngeal carcinoma cells. Biochem Pharmacol. 2008;75:1706–1716. doi: 10.1016/j.bcp.2008.01.008. [DOI] [PubMed] [Google Scholar]
- Mao J, Chen L, Xu B, Wang L, Wang W, Li M, Zheng M, Li H, Guo J, Li W, Jacob TJ, Wang L. Volume-activated chloride channels contribute to cell-cycle-dependent regulation of HeLa cell migration. Biochem Pharmacol. 2009;77:159–168. doi: 10.1016/j.bcp.2008.10.009. [DOI] [PubMed] [Google Scholar]
- Mao JW, Wang LW, Jacob T, Sun XR, Li H, Zhu LY, Li P, Zhong P, Nie SH, Chen LX. Involvement of regulatory volume decrease in the migration of nasopharyngeal carcinoma cells. Cell Res. 2005;15:371–378. doi: 10.1038/sj.cr.7290304. [DOI] [PubMed] [Google Scholar]
- McCoy E, Sontheimer H. Expression and function of water channels (Aquaporins) in migrating malignant astrocytes. Glia. 2007;55:1034–1043. doi: 10.1002/glia.20524. [DOI] [PMC free article] [PubMed] [Google Scholar]
- McFerrin MB, Sontheimer H. A role for ion channels in glioma cell invasion. Neuron Glia Biol. 2006;2:39–49. doi: 10.1017/S17440925X06000044. [DOI] [PMC free article] [PubMed] [Google Scholar]
- Merzak A, Koocheckpour S, Pilkington GJ. CD44 mediates human glioma cell adhesion and invasion in vitro. Cancer Res. 1994;54:3988–3992. [PubMed] [Google Scholar]
- Montana V, Sontheimer H. Bradykinin promotes the chemotactic invasion of primary brain tumors. J Neurosci. 2011;31:4858–4867. doi: 10.1523/JNEUROSCI.3825-10.2011. [DOI] [PMC free article] [PubMed] [Google Scholar]
- Nakada M, Nakada S, Demuth T, Tran NL, Hoelzinger DB, Berens ME. Molecular targets of glioma invasion. Cell Mol Life Sci. 2007;64:458–478. doi: 10.1007/s00018-007-6342-5. [DOI] [PMC free article] [PubMed] [Google Scholar]
- Ohnishi T, Arita N, Hiraga S, Taki T, Izumoto S, Fukushima Y, Hayakawa T. Fibronectin-mediated cell migration promotes glioma cell invasion through chemokinetic activity. Clin Exp Metastasis. 1997;15:538–546. doi: 10.1023/a:1018422926361. [DOI] [PubMed] [Google Scholar]
- Okada Y, Maeno E. Apoptosis, cell volume regulation and volume-regulatory chloride channels. Comp Biochem Physiol A Mol Integr Physiol. 2001;130:377–383. doi: 10.1016/s1095-6433(01)00424-x. [DOI] [PubMed] [Google Scholar]
- Olsen ML, Schade S, Lyons SA, Amaral MD, Sontheimer H. Expression of voltage-gated chloride channels in human glioma cells. J Neurosci. 2003;23:5572–5582. doi: 10.1523/JNEUROSCI.23-13-05572.2003. [DOI] [PMC free article] [PubMed] [Google Scholar]
- Owens GC, Orr EA, DeMasters BKK, Muschel RJ, Berens ME, Kruse CA. Overexpression of a transmembrane isoform of neural cell adhesion molecule alters the invasiveness of rat CNS-1 glioma. Cancer Res. 1998;58:2020–2028. [PubMed] [Google Scholar]
- Pedersen PH, Edvardsen K, Garcia-Cabrera I, Mahesparan R, Thorsen J, Mathisen B, Rosenblum ML, Bjerkvig R. Migratory patterns of lac-z transfected human glioma cells in the rat brain. Int J Cancer. 1995;62:767–771. doi: 10.1002/ijc.2910620620. [DOI] [PubMed] [Google Scholar]
- Ransom CB, O'Neal JT, Sontheimer H. Volume-activated chloride currents contribute to the resting conductance and invasive migration of human glioma cells. J Neurosci. 2001;21:7674–7683. doi: 10.1523/JNEUROSCI.21-19-07674.2001. [DOI] [PMC free article] [PubMed] [Google Scholar]
- Rutka JT, Apodaca G, Stern R, Rosenblum M. The extracellular matrix of the central and peripheral nervous systems: structure and function. J Neurosurg. 1988;69:155–170. doi: 10.3171/jns.1988.69.2.0155. [DOI] [PubMed] [Google Scholar]
- Sardini A, Amey JS, Weylandt KH, Nobles M, Valverde MA, Higgins CF. Cell volume regulation and swelling-activated chloride channels. Biochim Biophys Acta. 2003;1618:153–162. doi: 10.1016/j.bbamem.2003.10.008. [DOI] [PubMed] [Google Scholar]
- Schwab A. Function and spatial distribution of ion channels and transporters in cell migration. Am J Physiol Renal Physiol. 2001;280:F739–F747. doi: 10.1152/ajprenal.2001.280.5.F739. [DOI] [PubMed] [Google Scholar]
- Shen MR, Droogmans G, Eggermont J, Voets T, Ellory JC, Nilius B. Differential expression of volume-regulated anion channels during cell cycle progression of human cervical cancer cells. J Physiol. 2000;529:385–394. doi: 10.1111/j.1469-7793.2000.00385.x. [DOI] [PMC free article] [PubMed] [Google Scholar]
- Sontheimer HW. An unexpected role for ion channels in brain tumor metastasis. Exp Biol Med (Maywood) 2008;233:779–791. doi: 10.3181/0711-MR-308. [DOI] [PMC free article] [PubMed] [Google Scholar]
- Soroceanu L, Gillespie Y, Khazaeli MB, Sontheimer H. Use of chlorotoxin for targeting of primary brain tumors. Cancer Res. 1998;58:4871–4879. [PubMed] [Google Scholar]
- Soroceanu L, Manning TJ, Jr, Sontheimer H. Modulation of glioma cell migration and invasion using Cl− and K+ ion channel blockers. J Neurosci. 1999;19:5942–5954. doi: 10.1523/JNEUROSCI.19-14-05942.1999. [DOI] [PMC free article] [PubMed] [Google Scholar]
- Tysnes BB, Larsen LF, Ness GO, Mahesparan R, Edvardsen K, Garcia-Cabrera I, Bjerkvig R. Stimulation of glioma-cell migration by laminin and inhibition by anti-alpha3 and anti-beta1 integrin antibodies. Int J Cancer. 1996;67:777–784. doi: 10.1002/(SICI)1097-0215(19960917)67:6<777::AID-IJC5>3.0.CO;2-O. [DOI] [PubMed] [Google Scholar]
- Wang L, Chen L, Jacob TJ. The role of clc-3 in volume-activated chloride currents and volume regulation in bovine epithelial cells demonstrated by antisense inhibition. J Physiol. 2000;524:63–75. doi: 10.1111/j.1469-7793.2000.t01-1-00063.x. [DOI] [PMC free article] [PubMed] [Google Scholar]
- Weaver AK, Bomben VC, Sontheimer H. Expression and function of calcium-activated potassium channels in human glioma cells. Glia. 2006;54:223–233. doi: 10.1002/glia.20364. [DOI] [PMC free article] [PubMed] [Google Scholar]