Abstract
Objectives
We sought to determine the anti-atherosclerotic properties of pioglitazone using multi-modality non-invasive imaging techniques.
Background
Inflammation is an essential component of vulnerable or high risk atheromas. Pioglitazone, a peroxisome proliferator–activated receptor-gamma (PPAR-γ)agonist possesses potent anti-inflammatory properties. We aimed to non-invasively to quantify the anti-inflammatory effects of pioglitazone on atheroma using 18F-fluorodeoxyglucose (18F-FDG)-PET/CT and dynamic contrast enhanced MRI (DCE-MRI).
Methods
Atherosclerotic plaques were induced in the aorta of fifteen New Zealand White (NZW) rabbits by a combination of hyperlipidemic diet and two balloon endothelial denudations. Nine rabbits continued the same diet whereas six received pioglitazone (10mg/kg orally) in addition to the diet. Twelve animals underwent 18F-FDG-PET/CT and fifteen animals underwent DCE-MRI at baseline, one and three months after treatment initiation. Concomitantly, serum metabolic parameters were monitored. After imaging was completed aortic histological analysis and correlation analysis was performed.
Results
18F-FDG-PET/CT detected an increase in average standardized uptake value (SUV) in the control group (p<0.01), indicating progressive inflammation, while stable SUV values were observed in the treatment group, indicating no progression. DCE-MRI detected a significant decrease in area under the curve (AUC) for the pioglitazone group (p<0.01). Immunohistology of the aortas demonstrated a significant decrease in macrophage and oxidized phospholipid immunoreactivity in the pioglitazone group (p=0.04 and p=0.01, respectively) with respect to control animals, underlining the imaging results. Serum metabolic parameters showed no difference between groups. A strong positive correlation between SUV and macrophage density and AUC and neovessels was detected ( r2=0.86, p<0.0001 and r2=0.66, p=0.004, respectively).
Conclusions
18F-FDG-PET/CT and DCE-MRI demonstrate non-invasively the anti-inflammatory effects of pioglitazone on atheroma. Both imaging modalities appear suited to monitor inflammation in atherosclerosis.
Keywords: pioglitazone, atherosclerosis, inflammation, 18F-FDG-PET/CT, dynamic contrast enhanced MRI
Introduction
Cardiovascular disease (CVD) remains the major cause of morbidity and mortality worldwide(1) despite the widespread use of low density lipoproteins cholesterol (LDL-C) lowering therapies. Inflammation, mainly promoted by oxidized lipids in the vessel wall, plays a critical role in all stages of atherosclerosis, but is crucial in plaque rupture and thrombosis which causes the majority of acute coronary events (2,3). “Vulnerable plaques” are characterized by a relatively large lipid core, thin fibrous cap and an abundance of inflammatory cells (especially macrophages) accompanied by neo-vascularization (4). Currently, therapies targeting reversal cholesterol transport and inflammation, in particular recombinant HDL therapeutics and various nuclear receptor agonists, are being developed (5). However, their translation into clinical practice has been difficult because of the lack of clinical outcome studies and validated surrogate endpoints (6).
The peroxisome proliferator–activated receptor gamma (PPAR-γ) belongs to a nuclear receptor superfamily of ligand-dependent transcription factors. Different cells involved in the pathogenesis of atherosclerosis, such as endothelial cells, smooth muscle cells, T-lymphocytes, dendritic cells and mainly macrophages express PPAR-γ-receptor (7,8). Synthetic PPAR-γ-receptor ligands, thiazolidinediones (TZD), are used in clinical practice as oral antidiabetic agents. Besides their antidiabetic properties TZD have demonstrated in animal studies potent anti-atherosclerotic effects, by inhibiting the formation of atherosclerotic plaques (9,10). However, some TZDs may increase the risk of myocardial infarction (11). Pioglitazone, in contrast, in the large clinical secondary prevention trial PROactive (over 5000 subjects) demonstrated a significant reduction of all cause mortality, myocardial infarction and stroke in a diabetic patient population(12). Two subsequent large trials (CHICAGO and PERISCOPE) showed decreased progression of carotid intima-media thickness (as assessed by surface and intra-vascular ultrasounds) after 18 months of treatment with pioglitazone. These two studies confirmed the significant vascular benefits of pioglitazone and highlighted the potential role of imaging in tracking the progression of disease or its regression upon therapeutic intervention. However, the imaging techniques used in these studies do not give any information regarding changes in vascular inflammation induced by pioglitazone, which could help indentifying responsive patients much before anatomical changes become apparent. Non-invasive imaging techniques targeted towards quantifying inflammation, macrophage content and neovascularization of atherosclerotic vessels represent an attractive clinical tool. In an ideal scenario such techniques would allow accurate readout of vessel wall inflammation, delineating cardiovascular risk, guiding therapeutic decisions and defining the role of novel treatments and may therefore aid in risk stratification and provide surrogate therapeutic endpoints (13). Recently, a study in mice showed that non-invasive optical molecular imaging techniques can detect changes in inflammation upon pioglitazone treatment (14). However, the techniques used in these studies cannot be applied in a clinical setting because of the limited depth penetration possible with optical imaging. 18F-FDG/PET and DCE-MRI are non-invasive clinically available techniques and have recently been validated as read-outs of vascular inflammation. 18F-FDG/PET detected vascular macrophage content and DCE MRI neovascularization (15–18). In this study we applied 18F-FDG-PET/CT and DCE-MRI to characterize vascular inflammation and neovascularization and its changes during pioglitazone treatment in a rabbit model of atherosclerosis.
Methods
Animal Model
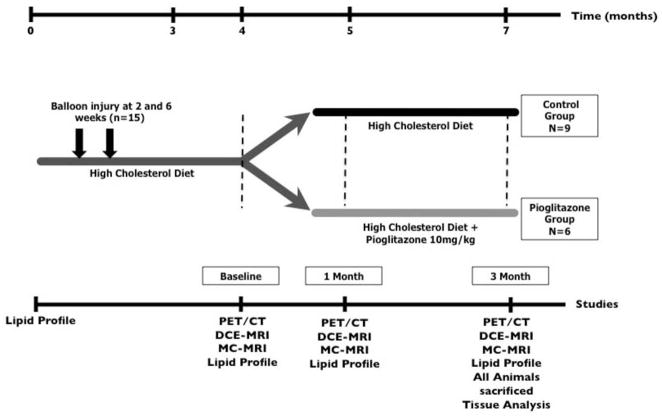
Fifteen New Zealand White rabbits (NZW; Charles River Laboratories) at the age of 3 months (weight of 3.0 kg +/−0.1 kg) were fed a diet containing 0.3% cholesterol and 4.7% coconut oil for 3 months and 0.15% and 4.7% coconut oil thereafter. The development of atherosclerosis was further enhanced with a double balloon injury to the abdominal aorta at weeks 2 and 6 (19). At 4 months animals were divided into two groups (control, n=9 and treatment n=6). The treatment group received pioglitazone (10mg/kg bodyweight) (20) mixed with the high fat diet for 3 months (Figure 1). Three age matched animals on chow diet served as non-atherosclerotic controls. Diets were prepared by Research Diet Inc. All procedures were performed under anesthesia by intramuscular injection of ketamine (20mg/kg; Ft Dodge Animal Health) and xylazine (5mg/kg; Bayer). The protocol was approved by the Mount Sinai School of Medicine Institute Animal Care and Use Committee.
Figure 1. Study Design.
Atherosclerosis was induced in 15 New Zealand White Rabbits through a combination of double balloon injury and high cholesterol diet. After 4 months diet first imaging scans and lipid profiles were performed (baseline) and animals were divided into two groups: control group and pioglitazone group. After a total of 5 months another round of imaging scans and lipid profiles (1 month imaging) were performed. The final imaging scans and lipid profiles were performed after a total of 7 months (3 month imaging). All animals were then immediately sacrificed and tissue analysis was performed.
Serum Analysis and fast protein liquid chromatography (FPLC)
Blood was collected from 12 hour fasting animals at baseline, 4-, 5- and 7 months after high cholesterol diet and separated into serum per standard protocols (21). Serum samples were analyzed using commercial kits for cholesterol, triglycerides, glucose and insulin. In addition, pooled serum at baseline and after 3 months of pioglitazone treatment was subjected to fast protein liquid chromatography.
Immunohistology
Macrophages were detected on adjacent slices by standard immunohistochemistry techniques. The total macrophage-rich (RAM-11-positive) area was quantified digitally as fraction of the media-intimal area (=macrophage density) per slice and expressed as average macrophage density per animal. Similarly, the areas for smooth muscle actin, apolipoprotein B-100 and oxidized phospholipids were evaluated. Neovessels were detected on a single, DCE image matched section with an anti-CD31 antibody as previously described (17).
18F-FDG-PET/CT
Six rabbits from each group were imaged using a combined PET/CT scanner (Discovery LS; GE Healthcare). PET images were acquired for 10 min, 3 h after intravenous injection of 18F-FDG (37 MBq [1 mCi/kg]) (19). The images were acquired in 3-dimensional mode and the acquisition covered the area from the diaphragm to the iliac bifurcation. A Fourier iterative reconstruction of the PET data was used. In addition to a PET scan, a non–contrast-enhanced CT scan was obtained for each rabbit on the same scanner for attenuation correction and anatomical localization of the PET signal. The final reconstructed slice thickness was 4.25mm.
PET/CT Analysis
PET/CT data were displayed in 3 orthogonal planes on a GE Xeleris workstation. Maximal and mean SUVs were recorded on contiguous axial slices of the aorta between the left renal artery and the iliac bifurcation (average number of slices, 13.6) from ROIs encompassing the vessel wall. Results were expressed as the average SUV of the aorta per animal.
Anatomical and Dynamic Contrast Enhanced MRI
Nine control and six pioglitazone treated rabbits were imaged under anesthesia using a 1.5 Tesla MRI system (Siemens Sonata, Siemens Medical Solutions) and a conventional knee coil. Sequential axial, 3-mm thick, images of the aorta were obtained from the left renal artery to the iliac bifurcation using T1-, T2- and PD- (proton density) weighted imaging sequences. DCE-MRI was performed on one selected axial slice using a black blood turbo spin echo (TSE) sequence previously validated against histology (17).
Anatomical multi-contrast(MC)-MRI and DCE-MRI Analysis
Average vessel wall area of the aorta between the left renal artery and iliac bifurcation was quantified on contiguous slices by manual tracing on T2 weighted images (VesselMass software, Leiden University Medical Center).
DCE-MRI quantified the change of signal intensity in a ROI including the entire atherosclerotic plaque during the injection of the contrast agent with a custom made Matlab (The MathWorks) program. The area under the signal intensity versus time curve (AUC) was quantified at 1 and 2 minutes after injection of contrast agent by numerical integration (17).
Statistical Analysis
Numeric values are expressed as mean ± SD. P< 0.05 was considered significant. Continuous DCE and PET outcomes were modeled as linear functions of time for both treatment and control groups. A linear mixed model with random intercepts and compound symmetric covariance structure was used to estimate the regression equations for treatment and control groups while accounting for the correlation between repeated measurements made on each rabbit (22). The models for PET outcomes were weighted by the number of slices analyzed in each animal. To test for differences among the treatment and control groups estimated by linear regression equations, an interaction term between treatment group and time was included in each mixed model along with both main effects. If the interaction term was found to be statistically significant then pair-wise comparisons of treatment group slopes were estimated. All statistical analyses were performed using Proc Mixed in SAS Version 9.2. Average macrophage density per animal was correlated with average animal SUV max or AUC 1min of the corresponding animal. Neovessels were counted on a single section, matched to the DCE-MRI imaged slice, and were correlated with AUC1min or average SUV max of the corresponding animal. AUC1min and average SUV max from corresponding animals were correlated. All correlations were measured using Pearson testing after normality of the data was established. All histological data, animal characteristics data and non-linear regression imaging data were analyzed with a 2-tailed Student-t-test.
Power Analysis
Retrospective power was computed using SAS’s Proc Mixed as previously described (23).
Results
Study design, animal characteristics and serum analysis
The study design is depicted in Figure 1. After 4 months of high cholesterol diet significantly elevated total cholesterol levels were observed (Table 1). There were no significant baseline differences in total cholesterol between the control and pioglitazone treated groups prior to treatment initiation (Table 1). There were no statistically significant differences in fasting serum glucose or insulin levels and in non-fasting triglycerides in either group throughout the study. Both groups had nearly identical weights throughout the study (Table 1). FPLC at baseline and after 3-months revealed no significant difference in lipoprotein profiles after pioglitazone treatment (Supplemental Figure 1).
Table 1.
Animal Characteristics
| control (n=9) | PIO (n=6) | p-value | |
|---|---|---|---|
| weight (kg) | |||
| t=4 months | 3.42 +/− 0.29 | 3.32 +/− 0.33 | 0.52 |
| t=5 months | 3.47 +/− 0.31 | 3.29 +/− 0.40 | 0.32 |
| t=7 months | 3.42 +/− 0.38 | 3.40 +/− 0.28 | 0.90 |
| control (n=5) | PIO (n=5) | ||
|
| |||
| total Cholesterol (mg/dl) | |||
| t=4 months | 1099 +/−291 | 1220 +/− 197 | 0.35 |
| t=5 months | 1158 +/− 282 | 1143 +/− 126 | 0.91 |
| t=7 months | 1154 +/− 230 | 1278 +/− 159 | 0.27 |
| triglycerides (mg/dl)* | |||
| t=4 months | 147 +/−126 | 165 +/−168 | 0.87 |
| t=5 months | 113 +/−95 | 102 +/−65 | 0.84 |
| t=7 months | 172 +/−163 | 105 +/−17 | 0.52 |
| glucose (mg/dl) | |||
| t=4 months | 152 +/− 31 | 132 +/− 25 | 0.29 |
| t=5 months | 178 +/− 40 | 156 +/− 43 | 0.32 |
| t=7 months | 180 +/− 47 | 170 +/− 47 | 0.67 |
| insulin (ng/dl) | |||
| t=4 months | 0.52 +/− 0.37 | 0.49 +/− 0.45 | 0.91 |
| t=5 months | 0.44 +/− 0.39 | 0.32 +/− 0.05 | 0.53 |
| t=7 months | 0.23 +/− 0.13 | 0.21 +/− 0.06 | 0.79 |
Data for weight and fasting values for: total cholesterol, triglycerides*, glucose and insulin are presented for the control and pioglitazone (PIO) group in separate columns. P-values between the control and PIO group were determined with a student t-test and are shown on a separate column. Individual data except p-values are represented as means ± standard deviation.
= nonfasting.
SUV correlates with tissue macrophage content and AUC correlates with neovascularization
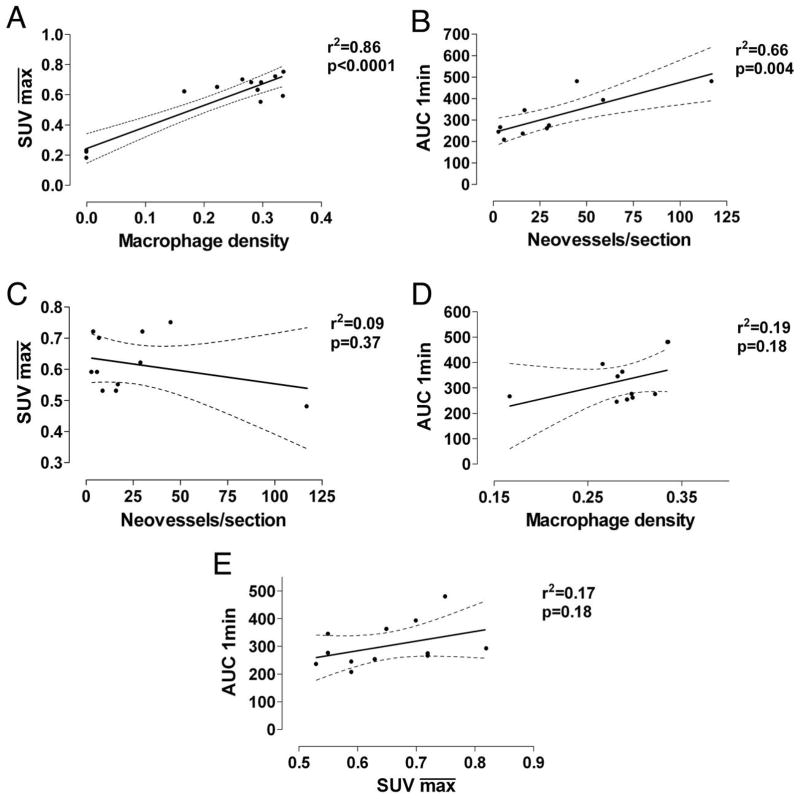
We correlated the and AUC1min respectively against macrophage density and neovessel counts and found a strong positive correlation (r2=0.86, p<0.0001 and r2=0.66, p=0.004, respectively; Figure 2AB) consistent with previous studies (17,24). No strong correlation was found between and neovessel count and between AUC1min and macrophage density (r2=0.09, p=0.37 and r2=0.19, p=0.18, respectively; Figure 2CD). and AUC1min did not strongly correlate (r2=0.17, p=0.18; Figure 2E).
Figure 2. Regression Analysis.
2A. Correlation between standard uptake value ( ) generated from FDG-PET/CT imaging and macrophage density (stained area/intimal area) from histological staining. 2B. Correlation between mean AUC1min generated from DCE-MRI imaging and neovessel count per histological section. 2C . Correlation between mean standard uptake value (SUV) and neovessel count per histological section. 2D. Correlation between mean AUC1min generated from DCE-MRI imaging and macrophage density. 2E. Correlation between mean standard uptake value (SUV) and mean AUC1min. Black line, regression line; dashed line, 95% confidence interval.
Pioglitazone arrests inflammation progression as assessed by 18F-FDG-PET/CT
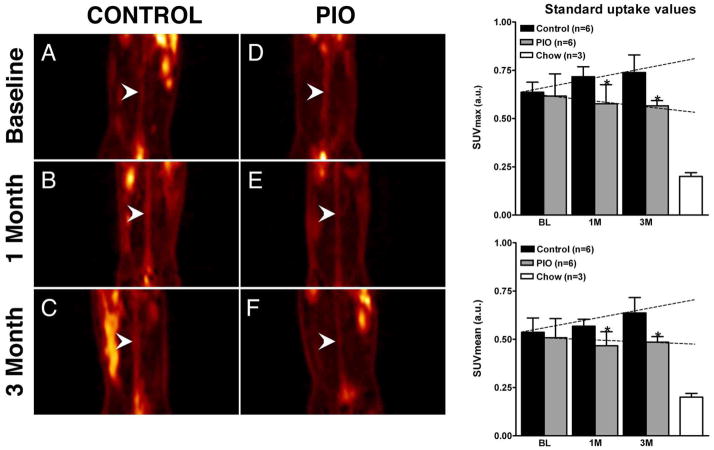
Upon completion of baseline imaging, animals were divided into matched groups, one control group and one treatment group, with both groups displaying similar baseline (0.64 ± 0.05 and 0.62 ± 0.12, p=0.70; Figure 3A and 3C and bar graph). The SUV versus time slope for the control group is positive, therefore indicating an increase of (p=0.10) and (p=0.02) over time. On the contrary the SUV versus time slope for the treatment group was not statistically different from zero ( , p=0.70; , p=0.92), indicating no significant progression in plaque inflammation. Comparison of the two slopes indicated a trend towards significance ( , p=0.15; , p=0.1). Comparison of SUV values between the two groups at 1 and 3 months showed significant differences (p<0.05) for both and . Non-atherosclerotic aged matched animals on chow diet show minimal SUV values.
Figure 3. FDG-PET/CT.
Left hand, Figures 3A–F, coronal PET images through the abdominal aorta (white arrowheads) from one representative animal per group. Figure 3A and 3D, baseline control- and baseline pioglitazone (PIO) group. Figure 3B and 3E, 1-month control and 1-month PIO group. Figure 3C and 3F, 3-month control and PIO group. On the right hand side two bar graphs summarize the changes in SUVmax (top) and SUVmean (bottom) at baseline (BL), one month (1M) and three months (3M) for both groups. Right hand bar shows values for non-atherosclerotic chow fed animals. Values are represented as mean ± standard deviation. *p<0.05 when comparing control and PIO group.
Schematic slopes are indicated as dashed lines.
Pioglitazone decreases neovascularization as assessed by DCE-MRI
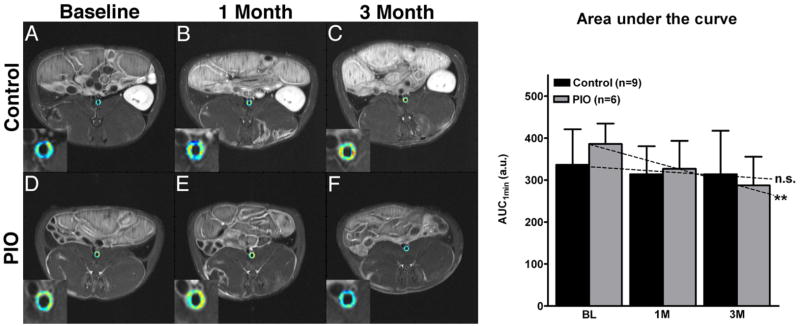
In analogy to the 18F-FDG-PET/CT experiments, we applied DCE-MRI to assess inflammation and neovascularization in atherosclerotic plaques (Figure 4). The AUC versus time slope for the control group was not statistically different from zero for AUC measures (AUC 1min ,p=0.33; AUC 2 min, p=0.18). The AUC versus time slope for the treatment group was negative and significantly different from zero for all AUC measures (p<0.01). A trend towards significance was found when comparing the control and treatment groups slopes (AUC 1min, p= 0.06; AUC 2min, p=0.09). There was a significant difference between baseline and 3 month AUC values in the treatment group (AUC 1min, p=0.01).
Figure 4. Dynamic-contrast-enhanced MRI.
Left hand side, Figures 4A–F show single slice axial T1 weighted MRI images with color encoded overlay of the contrast signal at one minute of the abdominal aorta with insert of the aorta. Figure 4A and 4D, baseline control and baseline pioglitazone (PIO) group. Figure 4B and 4E, 1-month control and PIO group Figure 4C and 4F, 3-month control- and pioglitazone group. Warm colors (orange to red) indicate higher AUC values and cold colors (green to blue) indicate lower AUC values. On the right hand side a bar graph summarizes the changes in the AUC at baseline (BL), one month (1M) and after three month (3M) for the control and PIO group. Values are represented as mean ± standard deviation. *p<0.05 when comparing baseline and 3M in the PIO group. Schematic slopes are indicated as dashed lines; n.s.=non-significant and **p=0.01 when comparing individual slopes against zero.
Pioglitazone has no effect on vessel wall area as assessed by MC -MRI
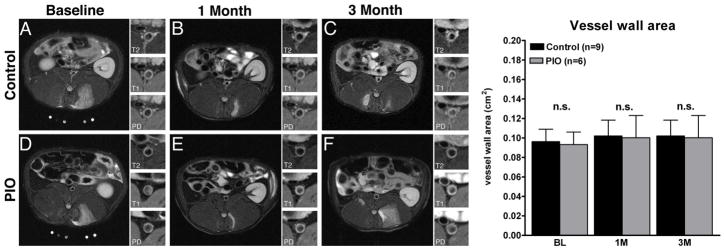
Multi-contrast MRI showed no significant changes in aortic wall area in either group during the study (Figure 5).
Figure 5. Multi-contrast-MRI.
Figure 5A–F, single slice axial T2 weighted representative MRI images with insert of the aorta with T2-, T1- and Proton Density (PD)-weighing. Figure 5A and 5D , baseline control and pioglitazone (PIO) group. Figure 5B and 5E, 1-month control and PIO group. Figure 5C and 5F: 3-month control and PIO group. Right hand side a bar graph summarizes the changes in the vessel wall area at baseline (BL), one month (1M)- and three month (3M) of either control or PIO group. Values are represented as mean ± standard deviation, n.s.=non-significant
Pioglitazone decreases plaque macrophages and oxidized phospholipids
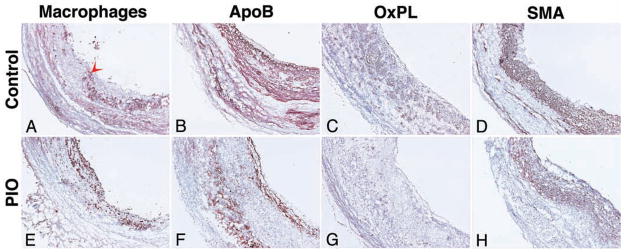
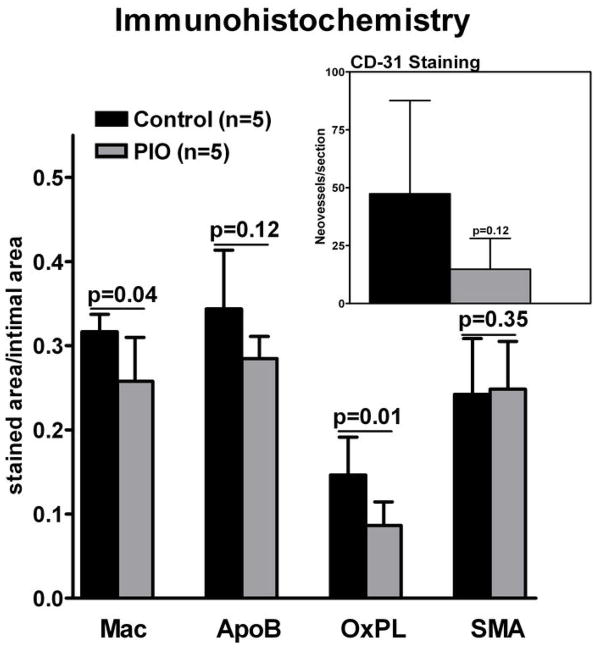
Macrophage staining at the end of imaging study revealed a significant decrease in macrophage density within the pioglitazone group compared to control (0.25 ± 0.05 and 0.32 ± 0.02, (a.u.), respectively, P=0.04; Figure 6 and 7). A trend towards lower apolipoprotein B density was detected in the pioglitazone group compared to control (0.28 ± 0.03 and 0.34 ± 0.07 (a.u.), respectively, p=0.12; Figure 6 and 7). Pioglitazone treatment resulted in a 41% reduction in the oxidized phospholipid density compared to control (0.086 ± 0.026 and 0.146 ± 0.045 (a.u.), respectively, p=0.03; Figure 5 and 6). Average smooth muscle actin density was identical between groups (0.24 ± 0.075 and 0.24 ± 0.078 (a.u.), respectively, p=0.88; Figure 5 and 6). A trend towards lower neovessel content was observed in the pioglitazone treated group (p=0.12; Figure 6).
Figure 6. Immunohistology.
Representative images of immunohistological staining of the abdominal aorta after 3 months of vehicle- (control; Figure 6A–D) and pioglitazone (PIO) treatment (Figure 6E–H). Staining (red-brown, red arrowheads) for macrophages (Mac; Figure 5A and 5E), apolipoprotein B (ApoB; Figure 6B and 6F), oxidized phospholipids (OxPL; Figure 6C and 6G) and smooth muscle actin (SMA; Figure 6D and 6H) is shown. Objective magnification: 10x. The lumen is on the right hand side from the tissue.
Figure 7. Summary Immunohistology.
Macrophages (Mac), apolipoprotein B (ApoB), oxidized phospholipids (OxPL) and smooth muscle actin (SMA) staining at 3 months of vehicle and pioglitazone (PIO) treated animals. Insert shows CD-31 staining for neovessels. Values are represented as means ± standard deviation. Individual p-values between control and PIO group indicated above bar graph.
Power Analysis of 18F-FDG-PET/CT and DCE-MRI
18F-FDG-PET/CT determined values had 30% power to detect a difference between individual group slopes, 43% power to detect a group effect and 15% power to detect a time effect. values had 40% power to detect a difference between individual group slopes, 37% power to detect a group effect and 45% power to detect a time effect.
DCE-MRI determined AUC 1 min values had 46% power to detect a difference between individual group slopes, 14% power to detect a group effect and 87% power to detect a time effect. AUC2 min values had 39% power to detect a difference between individual group slopes, 15% power to detect a group effect and 92% power to detect a time effect.
Discussion
In this study we show significant modulation in inflammation in aortic plaques of atherosclerotic rabbits as measured non-invasively by 18F-FDG-PET/CT and DCE-MRI upon treatment with pioglitazone. The imaging results are confirmed by the histological findings, which show a strong correlation of macrophage density and neovessel content with imaging parameters. In addition, this study provides insight to the diagnostic strengths of both FDG-PET and DCE-MRI while tracking anti-atherosclerotic therapeutic intervention.
Previous studies have tested the potential of FDG-PET to track therapeutic intervention. Tahara et al. (25) investigated the effect of simvastatin on plaque inflammation by FDG-PET in the thoracic aorta of human subjects, while Ogawa et al. (26) investigated the effect of probucol on the aortic plaques of Watanabe heritable hyperlipidemic (WHHL) rabbits. In contrast with the work presented here, both these studies showed no significant increase in FDG uptake in the control groups while regression of inflammation was demonstrated by a significant decrease of FDG uptake over time in the treatments groups. This behavior is different from what we reported in our study, where we show progression of inflammation in the control group and no change in FDG uptake over time in the treatment group. However, some significant differences between this study and the ones described before must be noted. For example the dietary differences (dietary restrictions for patients and chow diet for rabbits as opposed to hyperlipidemic diet in this study with or without drug depending on the group) and the different rabbit model used (WHHL versus NZW). The only study in the literature investigating the use of DCE-MRI to track therapeutic intervention in atherosclerosis shows results comparable to the ones presented here, although the time frame of the two studies is considerably different (48 hours versus 3 months of treatment) (27).
In addition to showing the ability of FDG-PET and DCE-MRI to track therapeutic intervention with pioglitazone, this study sheds light on the possible complementary role in future clinical applications of the two methodologies. For example, FDG-PET shows increase in plaque inflammation in the control group over time, while DCE-MRI measures do not change. Given the established correlation between FDG-PET and DCE-MRI with macrophages and neovessels respectively, this may reflect a difference in the change of these histological variables over time during plaque progression and may provide insight to the natural progression of aortic atherosclerosis in this specific rabbit model. More natural progression studies are needed to clarify this behavior and to plan future pre-clinical drug trials. The difference in FDG-PET and DCE-MRI measures in the treatment groups (impaired progression versus regression) may either reflect the different sensitivity of the techniques or a different impact of pioglitazone on the related histological variables (macrophages and neovessels respectively). In this last case the relationship between the two imaging techniques may be different for every new drug study planned with other therapeutic interventions.
Conclusions
In summary, we demonstrate the effectiveness of the PPARγ-agonist pioglitazone in promoting modulation of vascular inflammation in a rabbit model of atherosclerosis as evaluated by non-invasive imaging techniques and validated by histology. 18F-FDG PET/CT and DCE-MRI were used in this case as surrogate imaging markers of vascular inflammation. Both techniques are already clinically available, which stresses the translational aspect of this study. Dedicated prospective outcome studies are underway (http://www.hrpinitiative.com -due to report in 2011) which will clarify the role of plaque inflammation imaging in patients’ risk stratification. Furthermore, novel anti-atherosclerotic therapies are being developed and their role in clinical practice will need to be established. In this sense, the here described imaging tools may become potent armaments for improved drug development and their translation into clinical practice. Dedicated future clinical studies in non-diabetic patient populations will be needed to evaluate pioglitazone’s effect in atherosclerotic disease.
Supplementary Material
Acknowledgments
We thank Ash Rafique, RT (N) CNMT, BS, Suzanna Zata, CNMT for their support with the PET acquisitions.
Sources of Funding
This investigation was partially supported by an investigator initiated grant from Takeda Pharmaceutical (E.V.), the Fondation Leducq (S.T.) and NIH/NHLBI RO1 HL071021, RO1 HL078667 and NIH/NBIB EB009638 (Z.A.F).
Abbreviations and Acronyms
- FDG-PET/CT
fluorodeoxyglucose PET/CT
- DCE-MRI
dynamic contrast enhanced MRI
- MC-MRI
multi-contrast MRI
- SUV
standard uptake value
- AUC
area under the curve
- ROI
region of interest
Footnotes
Disclosures: None
Publisher's Disclaimer: This is a PDF file of an unedited manuscript that has been accepted for publication. As a service to our customers we are providing this early version of the manuscript. The manuscript will undergo copyediting, typesetting, and review of the resulting proof before it is published in its final citable form. Please note that during the production process errors may be discovered which could affect the content, and all legal disclaimers that apply to the journal pertain.
References
- 1.Dahlöf B. Cardiovascular disease risk factors: Epidemiology and risk assessment. Amer J Cardiol. 2010;105:3A–9A. doi: 10.1016/j.amjcard.2009.10.007. [DOI] [PubMed] [Google Scholar]
- 2.Libby P, Ridker PM, Hansson GK. Inflammation in Atherosclerosis: From Pathophysiology to Practice. J Am Col Cardiol. 2009;54:2129–2138. doi: 10.1016/j.jacc.2009.09.009. [DOI] [PMC free article] [PubMed] [Google Scholar]
- 3.Ross R. Atherosclerosis -- An Inflammatory Disease. N Engl J Med. 1999;340:115–126. doi: 10.1056/NEJM199901143400207. [DOI] [PubMed] [Google Scholar]
- 4.Fuster V, Moreno PR, Fayad ZA, Corti R, Badimon JJ. Atherothrombosis and High-Risk Plaque: Part I: Evolving Concepts. J Am Col Cardiol. 2005;46:937–954. doi: 10.1016/j.jacc.2005.03.074. [DOI] [PubMed] [Google Scholar]
- 5.Natarajan P, Ray KK, Cannon CP. High-Density Lipoprotein and coronary heart disease: Current and future therapies. J Am Coll of Cardiol. 2010;55:1283–1299. doi: 10.1016/j.jacc.2010.01.008. [DOI] [PubMed] [Google Scholar]
- 6.deGoma EM, deGoma RL, Rader DJ. Beyond high-density lipoprotein cholesterol levels: Evaluating high-density lipoprotein function as influenced by novel therapeutic approaches. J Am Col Cardiol. 2008;51:2199–2211. doi: 10.1016/j.jacc.2008.03.016. [DOI] [PMC free article] [PubMed] [Google Scholar]
- 7.Marx N, Mach F, Sauty A, Marx N, Mach F, Sauty A, et al. Peroxisome proliferator-activated receptor-γ activators inhibit IFN-γ-induced expression of the T cell-active CXC chemokines IP-10, Mig, and I-TAC in human endothelial cells. J Immunol. 2000;164:6503–6508. doi: 10.4049/jimmunol.164.12.6503. [DOI] [PMC free article] [PubMed] [Google Scholar]
- 8.Takata Y, Kitami Y, Yang Z-H, Nakamura M, Okura T, Hiwada K. Vascular inflammation is negatively autoregulated by interaction between CCAAT/Enhancer-binding protein-δ and peroxisome proliferator-activated receptor-γ. Circ Res. 2002;91:427–433. doi: 10.1161/01.res.0000031271.20771.4f. [DOI] [PubMed] [Google Scholar]
- 9.Collins AR, Meehan WP, Kintscher U, et al. Troglitazone Inhibits Formation of Early Atherosclerotic Lesions in Diabetic and Nondiabetic Low Density Lipoprotein Receptor-Deficient Mice. Arterioscler Thromb Vasc Biol. 2001;21:365–371. doi: 10.1161/01.atv.21.3.365. [DOI] [PubMed] [Google Scholar]
- 10.Li AC, Brown KK, Silvestre MJ, Willson TM, Palinski W, Glass CK. Peroxisome proliferator-activated receptor gamma ligands inhibit development of atherosclerosis in LDL receptor-deficient mice. J Clin Invest. 2000;106:523–31. doi: 10.1172/JCI10370. [DOI] [PMC free article] [PubMed] [Google Scholar]
- 11.Nissen SE, Wolski K. Rosiglitazone Revisited: An Updated Meta-analysis of Risk for Myocardial Infarction and Cardiovascular Mortality. Arch Intern Med. 170:1191–1201. doi: 10.1001/archinternmed.2010.207. [DOI] [PubMed] [Google Scholar]
- 12.Dormandy JA, Charbonnel B, Eckland DJA, et al. Secondary prevention of macrovascular events in patients with type 2 diabetes in the PROactive Study (PROspective pioglitAzone Clinical Trial In macroVascular Events): a randomised controlled trial. Lancet. 2005;366:1279–1289. doi: 10.1016/S0140-6736(05)67528-9. [DOI] [PubMed] [Google Scholar]
- 13.Rudd JH, Hyafil F, Fayad ZA. Inflammation imaging in atherosclerosis. Arterioscler Thromb Vasc Biol. 2009;29:1009–16. doi: 10.1161/ATVBAHA.108.165563. [DOI] [PMC free article] [PubMed] [Google Scholar]
- 14.Chang K, Francis SA, Aikawa E, et al. Pioglitazone suppresses inflammation in vivo in murine carotid atherosclerosis: novel detection by dual-target fluorescence molecular imaging. Arterioscler Thromb Vasc Biol. 2010;30:1933–9. doi: 10.1161/ATVBAHA.110.206342. [DOI] [PMC free article] [PubMed] [Google Scholar]
- 15.Tawakol A, Migrino RQ, Bashian GG, et al. In vivo 18F-fluorodeoxyglucose positron emission tomography imaging provides a noninvasive measure of carotid plaque inflammation in patients. J Am Coll Cardiol. 2006;48:1818–24. doi: 10.1016/j.jacc.2006.05.076. [DOI] [PubMed] [Google Scholar]
- 16.Rudd JHF, Warburton EA, Fryer TD, et al. Imaging Atherosclerotic Plaque Inflammation With [18F]-Fluorodeoxyglucose Positron Emission Tomography. Circulation. 2002;105:2708–2711. doi: 10.1161/01.cir.0000020548.60110.76. [DOI] [PubMed] [Google Scholar]
- 17.Calcagno C, Cornily JC, Hyafil F, et al. Detection of neovessels in atherosclerotic plaques of rabbits using dynamic contrast enhanced MRI and 18F-FDG PET. Arterioscler Thromb Vasc Biol. 2008;28:1311–7. doi: 10.1161/ATVBAHA.108.166173. [DOI] [PMC free article] [PubMed] [Google Scholar]
- 18.Rudd JH, Myers KS, Bansilal S, et al. Relationships among regional arterial inflammation, calcification, risk factors, and biomarkers: a prospective fluorodeoxyglucose positron-emission tomography/computed tomography imaging study. Circ Cardiovasc Imaging. 2009;2:107–15. doi: 10.1161/CIRCIMAGING.108.811752. [DOI] [PMC free article] [PubMed] [Google Scholar]
- 19.Hyafil F, Cornily JC, Rudd JH, Machac J, Feldman LJ, Fayad ZA. Quantification of inflammation within rabbit atherosclerotic plaques using the macrophage-specific CT contrast agent N1177: a comparison with 18F-FDG PET/CT and histology. J Nucl Med. 2009;50:959–65. doi: 10.2967/jnumed.108.060749. [DOI] [PubMed] [Google Scholar]
- 20.Joner M, Farb A, Cheng Q, et al. Pioglitazone Inhibits In-Stent Restenosis in Atherosclerotic Rabbits by Targeting Transforming Growth Factor-{beta} and MCP-1. Arterioscler Thromb Vasc Biol. 2007;27:182–189. doi: 10.1161/01.ATV.0000251021.28725.e8. [DOI] [PubMed] [Google Scholar]
- 21.McVicar JP, Kunitake ST, Hamilton RL, Kane JP. Characteristics of human lipoproteins isolated by selected-affinity immunosorption of apolipoprotein A-I. Proc Natl Acad Sci U S A. 1984;81:1356–60. doi: 10.1073/pnas.81.5.1356. [DOI] [PMC free article] [PubMed] [Google Scholar]
- 22.Littell Ramon C, Miliken GA, Stroup WW, Wolfinger RD. SAS System for Mixed Models. Cary, NC: SAS Institute Inc; 1996. [Google Scholar]
- 23.Stroup WW. Mixed Model Procedures to Assess Power, Precision, and Sample Size in the Design of Experiments. Proc Biopharmaceutical Section Am Stat Assoc. 1999:15–24. [Google Scholar]
- 24.Tawakol A, Migrino RQ, Hoffmann U, et al. Noninvasive in vivo measurement of vascular inflammation with F-18 fluorodeoxyglucose positron emission tomography. J Nucl Cardiol. 2005;12:294–301. doi: 10.1016/j.nuclcard.2005.03.002. [DOI] [PubMed] [Google Scholar]
- 25.Tahara N, Kai H, Ishibashi M, et al. Simvastatin Attenuates Plaque Inflammation:: Evaluation by Fluorodeoxyglucose Positron Emission Tomography. J Am Col Cardiol. 2006;48:1825–1831. doi: 10.1016/j.jacc.2006.03.069. [DOI] [PubMed] [Google Scholar]
- 26.Ogawa M, Magata Y, Kato T, et al. Application of 18F-FDG PET for monitoring the therapeutic effect of antiinflammatory drugs on stabilization of vulnerable atherosclerotic plaques. J Nucl Med. 2006;47:1845. [PubMed] [Google Scholar]
- 27.Lobatto ME, Fayad ZA, Silvera S, et al. Multimodal Clinical Imaging To Longitudinally Assess a Nanomedical Anti-Inflammatory Treatment in Experimental Atherosclerosis. Molecular Pharmaceutics. 2010:null–null. doi: 10.1021/mp100309y. [DOI] [PMC free article] [PubMed] [Google Scholar]
Associated Data
This section collects any data citations, data availability statements, or supplementary materials included in this article.


