

Abstract
After introduction, West Nile virus (WNV) spread rapidly across the western United States between the years 2001 and 2004. This westward movement is thought to have been mediated by random dispersive movements of resident birds. Little attention has been placed on the role of mosquito vectors in virus dispersal across North America. The mosquito vector largely responsible for WNV amplification and transmission of WNV in the western USA is Culex tarsalis. Here we present population genetic data that suggest a potential role for C. tarsalis in the dispersal of WNV across the western USA. Population genetic structure across the species range of C. tarsalis in the USA was characterized in 16 states using 12 microsatellite loci. STRUCTURE and GENELAND analyses indicated the presence of three broad population clusters. Barriers to gene flow were resolved near the Sonoran desert in southern Arizona and between the eastern Rocky Mountains and High Plains plateau. Small genetic distances among populations within clusters indicated that gene flow was not obstructed over large portions of the West Coast and within the Great Plains region. Overall, gene flow in C. tarsalis appears to be extensive, potentially mediated by movement of mosquitoes among neighboring populations and hindered in geographically limited parts of its range. The pattern of genetic clustering in C. tarsalis is congruent with the pattern of invasion of West Nile virus (WNV) across the western United States, raising the possibility that movement of this important vector may be involved in viral dispersal.
Keywords: Culex tarsalis, West Nile virus, mosquito, gene flow, genetic structure, viral dispersal
INTRODUCTION
First detected in New York in 1999 (CDC 1999), West Nile Virus (WNV) spread rapidly across the United States, reaching the west coast by 2003 (Hayes et al. 2005). The virus spanned a particularly large geographic area between 2001 and 2002, when it crossed the Mississippi River into the Midwest and Great Plains to invade a total of 44 states by the end of the transmission season (CDC 2003). Because migratory birds are thought to be important introductory hosts of WNV in Europe (Hubálek & Halouzka 1999), it was originally hypothesized that a similar pattern would hold true in the New World, with new infections occurring from north to south along migratory bird routes (Rappole et al. 2000) and occurring sporadically in space and time (Rappole et al. 2006). Instead, in 2000 and 2001 WNV radiated steadily outward in all directions from the original site of introduction without showing a long-distance ‘leap frog’ pattern expected from infected migratory birds (Rappole & Hubalek 2003). More recently, modeling studies indicated that both the rate and pattern of WNV spread across the United States is more consistent with random dispersive movements of resident birds as opposed to invasion by long-distance movement of infected migratory birds (Rappole et al. 2006).
Mosquito vectors, also mobile, have not been seriously considered as potential introductory agents of WNV. While there are many competent vectors of WNV in North America (Hayes et al. 2005, Turell et al. 2005), three species account for the majority of WNV transmission: Culex pipiens, Culex quinquefasciatus and Culex tarsalis (Hayes et al. 2005). Culex tarsalis plays a particularly important role in rural and suburban habitats throughout the western United States, where outbreaks have been particularly severe and sustained over the past several years (Lindsey et al. 2008). Culex tarsalis contributes heavily to this emergence and maintenance of the WNV infection cycle (Reisen et al. 2004, DiMenna et al. 2006, Lindsey et al. 2008), perpetuating both viral amplification in bird reservoirs and bridging of virus to mammalian hosts (Reisen et al. 2004, California DHS 2008, Winters et al. 2008b). Late summer feeding shifts from birds to mammals in C. tarsalis were recently shown to intensify epidemics of WNV in Colorado and California (Kilpatrick et al. 2006). Additionally, WNV risk (Wimberly et al. 2008) and incidence of neuroinvasive disease (Lindsey et al. 2008) have remained high in regions where C. tarsalis is the predominant vector (notably in the Great Plains states), indicating that this mosquito may be directly or indirectly responsible for causing WNV outbreaks and a significant proportion of human cases in the western U.S. A. (Bolling et al. 2009, Pitzer et al. 2009).
Consistent with its ability to serve as a bridge vector and feed on a variety of hosts residing in different habitats, C. tarsalis is capable of moving relatively long distances. A series of mark-release-recapture studies conducted in populations in California showed that females can travel several kilometers per night for consecutive nights while hunting and seeking oviposition sites (Reisen and Reeves 1990). This level of dispersal is not vastly different from resident bird movement, which generally ranges between 0-14 km (Rappole & Hubalek 2003), suggesting that the spread of WNV by vector flight may also be feasible.
An indirect measure of C. tarsalis movement by estimation of gene flow was made in a 2005 study, which revealed moderate genetic structure among 12 populations in five western states (Venkatesan et al. 2007a), including barriers to gene flow in southern California, and between Colorado and both Nebraska and New Mexico. Populations in northern California, Washington and Colorado were all found to be panmictic, suggesting that gene flow among populations over a large area is very high. However, only five microsatellites were used in the analysis and large areas between California and Colorado and east of Nebraska were not sampled. Additionally, sequence analysis of a portion of the mitochondrial NADH dehydrogenase subunit 4 (ND4) gene indicated that populations had been homogenized in the past, perhaps during a climate-induced range expansion (Venkatesan et al. 2007a). Because of patchy spatial sampling, the availability of few loci and the potential homogenizing effects of population expansion, it was unclear whether population structure had been well-delineated in C. tarsalis or whether these factors may have contributed to an inflated estimate of gene flow. Therefore, a detailed and more robust examination of population structure throughout the western United States was required to thoroughly characterize gene flow of C. tarsalis across its range.
In this study, we have comprehensively characterized genetic structure and barriers to gene flow in C. tarsalis across 20 populations in 16 states using 12 microsatellite loci. Mitochondrial sequence data, previously shown to be uninformative for population differentiation (Venkatesan et al. 2007a), were not collected. Results of this expanded study support earlier findings, revealing high gene flow across large geographic areas and genetic isolation between three broad population clusters. We found that the observed spatial pattern of genetic structure in C. tarsalis closely mirrors the invasion pattern of WNV across the western United States between 2002-2004. Our findings suggest that population genetic structure of C. tarsalis is not only consistent with its behavior and ecology, but also with the possibility that this mosquito is both an important vector and dispersal agent of WNV in the western United States.
MATERIALS AND METHODS
Mosquito collections and extractions of DNA
Adult mosquitoes were collected in 20 sites between June and August 2007 using CDC light traps (Figure 1). Specimens were either transported from the collection localities to the Johns Hopkins Bloomberg School of Public Health on dry ice or preserved in 100% ethanol and stored at -80° C until processed for DNA extraction. Specimens were identified as C. tarsalis (Darsie & Ward 1981). DNA was extracted from individual mosquitoes using salt extraction/ethanol precipitation as previously described (Black & DuTeau 1997). Extracted DNA was suspended in nuclease-free water, DNA concentration quantified using a NanoDrop spectrophotometer (NanoDrop Technologies, Wilmington, DE), adjusted to 25 – 50 ng/uL and stored at -20° C until used for PCR.
Figure 1.
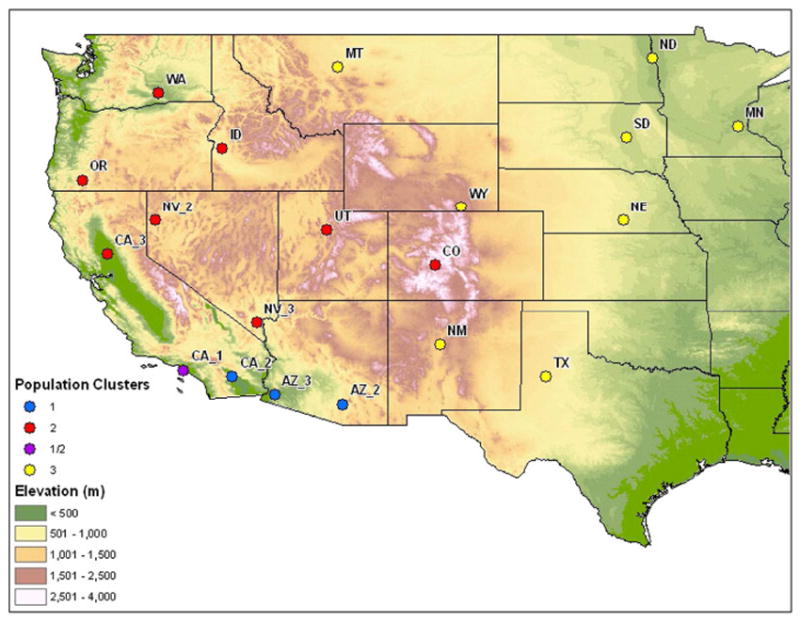
Topographic map of 2007 Cx. tarsalis collection sites. A total of 20 populations were sampled across 16 states. Colored bubbles indicate microsatellite-based genetic clustering of populations. Population CA_1 is shown with membership in the Sonoran cluster (STRUCTURE-based assignment) and the Pacific cluster (phylogenetic assignment).
Microsatellite amplification and fragment size determination
Twelve di- and tri-nucleotide microsatellite loci (Rasgon et al. 2006; Venkatesan et al. 2007b) were selected from a screen of 19 loci in 8 populations (supporting Table S1) based on adherence to Hardy-Weinberg Equilibrium frequencies. 28-32 individuals from each of 20 populations were genotyped at the 12 loci (Total N=602). Forward primers of nine loci were 5’-fluorescently labeled with HEX, 6-FAM or NED. For these loci, PCR was conducted in 10 μl reactions containing 1 unit Taq polymerase, 1 μl ThermoPol buffer (New England Biolabs, Ipswich, MA), 0.2 mM each dNTP, 1 μM each primer and 0.5 μl template DNA. Amplifications occurred in a PTC-200 Peltier thermocycler (Biorad, Hercules, CA) using a protocol of 95 °C for 5 minutes, followed by 35 cycles of: 95 °C for 1 minute, empirically-determined annealing temperature for 1 minute, 72 °C for 1 minute, followed by a 10 minute 72 °C extension. (Rasgon et al. 2006). For the remaining loci we used the M13-tailed primer method (Boutin-Ganache et al. 2001) to label reliably-amplifying PCR products for visualization on the capillary sequencer. Forward primers were 5 ’ -tailed with the 23-basepair M13 (uni-43) sequence (AGGGTTTTCCCAGTCACGACGTT). PCR was conducted in 10 μL reactions containing 0.8 units Taq polymerase, 1.0 μL 10X ThermoPol buffer (New England Biolabs, Ipswich, MA, U.S.A.), 0.2 mm each dNTP, 1 μm each microsatellite-specific primer (using the 5’ M13-tagged forward primer), 0.5 μm 5 ’ -fluorescently labeled M13 (uni-43) and 0.5 μL template DNA. The M13 (uni-43) primer was 5’ -fluorescently tagged with HEX, 6-FAM or NED to facilitate multiplexing. M13 PCR was conducted under the following reaction conditions: 95 °C for 5 min; 10 cycles of 94 °C for 30 s; 57 °C for 1 min and 72 °C for 30 s; 27 cycles of 94 °C for 30 s; 55 °C for 1 min, and 72 °C for 30 s, followed by a 10-min extension at 72 °C. Labeled amplicons were resolved on an ABI Prism Genetic Analyzer 3100 Avant (Applied Biosystems, Foster City, CA). Allele sizes were automatically estimated with an internal ROX-500 size standard (Applied Biosystems) using GeneScan v. 3.1 and Genotyper software (Applied Biosystems, Foster City, CA).
Diversity and population structure analyses
Microsatellite allele frequencies were calculated and analyzed for deviation from Hardy-Weinberg equilibrium using Arlequin 3.1 (Excoffier et al. 2005) and linkage disequilibrium using GenePop 3.4 (Raymond & Rousset 1995). Genetic diversity values were not normally distributed, so allele richness and heterozygosity among populations were compared using the Wilcoxon matched-pairs sign-rank test.
Arlequin 2.0 was used to compute FSTs (Wright 1951, Weir & Cockerham 1984) and determine significance by permuting genotypes among populations (1,000 permutations). A phylogenetic tree inferred from pair-wise linear FSTs was constructed using UPGMA in the program MEGA (Kumar et al. 2004).
STRUCTURE 2.0 (Pritchard et al. 2000) was used to assign individuals from all populations to a pre-determined number of clusters (K) based on multi-locus microsatellite data. For each run, a burn-in period of 30,000 steps was followed by 1 × 10⁶ iterations under the admixture model and the assumption of correlated allele frequencies among populations. For each K of 1 - 5, 10 runs were performed. Estimated log probabilities (Ln P(D)) were averaged across runs and compared to determine the posterior probability of each K. ΔK was calculated as described in Evanno et al. (2005). A visual output for the run of highest Ln P(D) was generated using the program DISTRUCT (Rosenberg 2004).
GENELAND 2.0.12 (Guillot et al. 2005a, 2005b) was used to perform a spatial genetic analysis by integrating geographic and genetic information. To determine the most probable K, five replicates with 1 × 10⁵ MCMC iterations were performed for each K of 1 - 5. The maximum rate of the Poisson process was fixed at 100, the maximum number of nuclei in the Poisson-Voronoi tessellation was fixed at 300, spatial uncertainty was set at 0 km, and the Dirichlet model for allele frequencies was selected for all analyses. 10 runs were performed at the inferred (modal) K and for each run, the posterior probability of membership for each pixel in the domain, posterior probability of population membership for each individual and modal population of each individual were determined using a burn-in of 5 × 10⁵ iterations. Pixel number was set at 300 along both the X and Y axes. Mean log posterior probability for each of the 10 runs was calculated and runs were checked against each other for consistency.
Genetic variation was partitioned among regions of restricted gene flow based on microsatellite-derived clustering results and FST values using analysis of molecular variance (AMOVA) in Arlequin 2.0. A Mantel regression of linearized FST values on ln-transformed geographic distances among populations (Rousset 1997) was performed using IBD 1.52 (Bohonak 2002).
RESULTS
Hardy-Weinberg equilibrium, linkage disequilibrium and microsatellite polymorphism
Microsatellite allele frequencies by population are presented in Table S2. Significant deviation from H-W equilibrium was found in ten of 240 possible tests (Bonferroni adjusted α = 0.00021; Table 1). These few deviations were due to heterozygosity deficiency. None of the pairs of loci exhibited significant LD in single pair-wise tests. Fisher’s global test for each pair of loci across all 20 populations revealed significant LD between loci C203 and D104. The 12 microsatellites had an average of 4 to 11 alleles per locus per population. Mean heterozygosity per locus ranged between 0.30 and 0.79. No significant difference in allele number or heterozygosity was detected among populations.
Table 1.
Sample size (N), number of alleles, and expected and observed heterozygosities (He and Ho) of 12 microsatellite loci in 20 Culex tarsalis populations from the western United States
| Popu- lation |
Location | N | CUTA101 | CUTC12 | CUTD206 | CUTC203 | CUTC201 | CUTD104 | ||||||||||||
|---|---|---|---|---|---|---|---|---|---|---|---|---|---|---|---|---|---|---|---|---|
| No. alleles |
He1 | Ho2 | No. alleles |
He | Ho | No. alleles |
He | Ho | No. alleles |
He | Ho | No. alleles |
He | Ho | No. alleles |
He | Ho | |||
| MT | Great Falls, MT | 30 | 11 | 0.840 | 0.733 | 9 | 0.783 | 0.533 | 5 | 0.220 | 0.200 | 9 | 0.892 | 0.833 | 7 | 0.660 | 0.600 | 8 | 0.797 | 0.733 |
| WA | Benton, WA | 27 | 10 | 0.762 | 0.741 | 8 | 0.820 | 0.593 | 4 | 0.249 | 0.154 | 10 | 0.859 | 0.704 | 6 | 0.561 | 0.444 | 10 | 0.813 | 0.778 |
| ID | Gem Co, ID | 28 | 13 | 0.836 | 0.786 | 8 | 0.761 | 0.643 | 2 | 0.198 | 0.179 | 11 | 0.897 | 0.786 | 6 | 0.538 | 0.393 | 8 | 0.802 | 0.750 |
| OR | Jackson Co, OR | 32 | 11 | 0.786 | 0.656 | 9 | 0.823 | 0.688 | 6 | 0.361 | 0.188 | 11 | 0.880 | 0.625 | 7 | 0.704 | 0.469 | 10 | 0.738 | 0.781 |
| NV_2 | Washoe, NV | 32 | 14 | 0.852 | 0.719 | 9 | 0.848 | 0.688 | 3 | 0.226 | 0.188 | 12 | 0.887 | 0.813 | 5 | 0.521 | 0.344 | 8 | 0.790 | 0.750 |
| CA_3 | Yuba, CA | 32 | 13 | 0.726 | 0.750 | 9 | 0.780 | 0.750 | 5 | 0.398 | 0.406 | 11 | 0.888 | 0.844 | 4 | 0.563 | 0.406 | 8 | 0.818 | 0.813 |
| NV_3 | Clark, NV | 32 | 15 | 0.840 | 0.844 | 8 | 0.826 | 0.719 | 2 | 0.232 | 0.161 | 13 | 0.890 | 0.844 | 8 | 0.724 | 0.594 | 8 | 0.730 | 0.781 |
| CA_1 | Los Angeles, CA | 28 | 11 | 0.812 | 0.821 | 7 | 0.794 | 0.857 | 6 | 0.534 | 0.321 | 9 | 0.885 | 0.893 | 3 | 0.362 | 0.321 | 9 | 0.777 | 0.750 |
| CA_2 | Riverside, CA | 32 | 15 | 0.916 | 0.750 | 7 | 0.742 | 0.656 | 3 | 0.626 | 0.688 | 11 | 0.854 | 0.750 | 4 | 0.522 | 0.375 | 8 | 0.830 | 0.750 |
| AZ_2 | Tuscon, AZ | 32 | 9 | 0.740 | 0.781 | 8 | 0.810 | 0.781 | 4 | 0.711 | 0.375 | 10 | 0.882 | 0.844 | 6 | 0.637 | 0.500 | 7 | 0.816 | 0.813 |
| AZ_3 | Yuma, AZ | 32 | 14 | 0.881 | 0.871 | 7 | 0.804 | 0.719 | 5 | 0.542 | 0.563 | 10 | 0.905 | 0.844 | 6 | 0.551 | 0.531 | 7 | 0.801 | 0.875 |
| WY | Laramie, WY | 31 | 10 | 0.878 | 0.903 | 8 | 0.726 | 0.774 | 4 | 0.212 | 0.194 | 9 | 0.845 | 0.677 | 7 | 0.696 | 0.613 | 10 | 0.835 | 0.871 |
| UT | Utah Co, UT | 27 | 12 | 0.874 | 0.778 | 8 | 0.819 | 0.778 | 3 | 0.269 | 0.222 | 12 | 0.905 | 0.889 | 5 | 0.499 | 0.444 | 8 | 0.812 | 0.741 |
| CO | Gunnison, CO | 32 | 11 | 0.876 | 0.656 | 8 | 0.768 | 0.656 | 5 | 0.338 | 0.188 | 10 | 0.820 | 0.719 | 6 | 0.527 | 0.469 | 8 | 0.754 | 0.774 |
| NM | Albuquerque, NM | 32 | 9 | 0.841 | 0.844 | 8 | 0.665 | 0.531 | 3 | 0.350 | 0.344 | 9 | 0.868 | 0.750 | 5 | 0.579 | 0.419 | 8 | 0.800 | 0.781 |
| TX | Lubbock, TX | 28 | 9 | 0.866 | 0.857 | 5 | 0.592 | 0.464 | 4 | 0.314 | 0.214 | 10 | 0.887 | 0.821 | 6 | 0.519 | 0.500 | 10 | 0.865 | 0.821 |
| ND | Grand Forks, ND | 31 | 9 | 0.852 | 0.677 | 9 | 0.735 | 0.742 | 4 | 0.265 | 0.258 | 10 | 0.872 | 0.742 | 6 | 0.707 | 0.548 | 9 | 0.837 | 0.839 |
| SD | Beadle, SD | 28 | 11 | 0.873 | 0.750 | 8 | 0.755 | 0.679 | 4 | 0.302 | 0.259 | 10 | 0.879 | 0.750 | 5 | 0.514 | 0.464 | 9 | 0.797 | 0.750 |
| MN | Hennepin, MN | 28 | 10 | 0.864 | 0.750 | 8 | 0.755 | 0.821 | 4 | 0.416 | 0.321 | 10 | 0.888 | 0.714 | 5 | 0.627 | 0.536 | 11 | 0.831 | 0.750 |
| NE | Adams, NE | 28 | 11 | 0.886 | 0.679 | 8 | 0.766 | 0.714 | 4 | 0.461 | 0.481 | 9 | 0.886 | 0.815 | 5 | 0.590 | 0.607 | 9 | 0.770 | 0.821 |
| CUTD213 | CUTB210 | CUTD120 | CUTC6 | CUTD113 | CUTD107 | Mean | |||||||||||||||
|---|---|---|---|---|---|---|---|---|---|---|---|---|---|---|---|---|---|---|---|---|---|
| Population | No. alleles | He | Ho | No. alleles | He | Ho | No. alleles | He | Ho | No. alleles | He | Ho | No. alleles | He | Ho | No. alleles | He | Ho | No. alleles | He | Ho |
| MT | 4 | 0.499 | 0.233 | 7 | 0.798 | 0.567 | 7 | 0.741 | 0.517 | 3 | 0.245 | 0.100 | 6 | 0.701 | 0.600 | 6 | 0.300 | 0.332 | 6.8 | 0.623 | 0.499 |
| WA | 5 | 0.424 | 0.269 | 5 | 0.769 | 0.556 | 8 | 0.749 | 0.385 | 3 | 0.326 | 0.259 | 6 | 0.596 | 0.630 | 6 | 0.333 | 0.391 | 6.8 | 0.605 | 0.492 |
| ID | 3 | 0.534 | 0.500 | 6 | 0.710 | 0.536 | 5 | 0.673 | 0.500 | 3 | 0.577 | 0.321 | 8 | 0.353 | 0.357 | 5 | 0.321 | 0.390 | 6.5 | 0.600 | 0.512 |
| OR | 3 | 0.508 | 0.250 | 6 | 0.747 | 0.594 | 5 | 0.740 | 0.406 | 5 | 0.511 | 0.516 | 7 | 0.597 | 0.625 | 6 | 0.344 | 0.533 | 7.2 | 0.645 | 0.528 |
| NV_2 | 4 | 0.571 | 0.375 | 6 | 0.786 | 0.344 | 8 | 0.785 | 0.813 | 3 | 0.205 | 0.125 | 5 | 0.535 | 0.500 | 2 | 0.281 | 0.272 | 6.6 | 0.607 | 0.494 |
| CA_3 | 4 | 0.544 | 0.531 | 8 | 0.720 | 0.625 | 6 | 0.662 | 0.594 | 6 | 0.481 | 0.500 | 5 | 0.660 | 0.844 | 6 | 0.500 | 0.547 | 7.1 | 0.645 | 0.634 |
| NV_3 | 6 | 0.500 | 0.438 | 6 | 0.751 | 0.594 | 4 | 0.668 | 0.250 | 6 | 0.486 | 0.406 | 6 | 0.575 | 0.625 | 5 | 0.563 | 0.485 | 7.3 | 0.649 | 0.562 |
| CA_1 | 2 | 0.508 | 0.607 | 6 | 0.736 | 0.464 | 6 | 0.799 | 0.692 | 4 | 0.438 | 0.107 | 5 | 0.607 | 0.571 | 5 | 0.393 | 0.378 | 6.1 | 0.637 | 0.565 |
| CA_2 | 6 | 0.621 | 0.625 | 7 | 0.708 | 0.313 | 5 | 0.502 | 0.406 | 2 | 0.062 | 0.031 | 6 | 0.629 | 0.656 | 4 | 0.375 | 0.369 | 6.5 | 0.616 | 0.531 |
| AZ_2 | 5 | 0.588 | 0.594 | 4 | 0.613 | 0.438 | 5 | 0.658 | 0.625 | 4 | 0.379 | 0.406 | 6 | 0.546 | 0.469 | 6 | 0.438 | 0.492 | 6.2 | 0.651 | 0.593 |
| AZ_3 | 6 | 0.665 | 0.625 | 5 | 0.629 | 0.563 | 5 | 0.579 | 0.563 | 5 | 0.328 | 0.344 | 4 | 0.530 | 0.625 | 6 | 0.313 | 0.455 | 6.7 | 0.627 | 0.631 |
| WY | 5 | 0.238 | 0.258 | 10 | 0.736 | 0.710 | 7 | 0.715 | 0.613 | 7 | 0.350 | 0.258 | 5 | 0.696 | 0.677 | 6 | 0.323 | 0.322 | 7.3 | 0.604 | 0.572 |
| UT | 4 | 0.534 | 0.259 | 5 | 0.756 | 0.704 | 8 | 0.755 | 0.370 | 3 | 0.266 | 0.259 | 5 | 0.542 | 0.481 | 5 | 0.259 | 0.242 | 6.5 | 0.607 | 0.514 |
| CO | 2 | 0.523 | 0.355 | 5 | 0.689 | 0.581 | 6 | 0.673 | 0.355 | 4 | 0.342 | 0.194 | 6 | 0.569 | 0.500 | 1 | -- | 0.000 | 6.0 | 0.625 | 0.454 |
| NM | 5 | 0.392 | 0.290 | 8 | 0.727 | 0.387 | 6 | 0.675 | 0.710 | 3 | 0.179 | 0.094 | 5 | 0.576 | 0.406 | 4 | 0.219 | 0.233 | 6.1 | 0.572 | 0.482 |
| TX | 6 | 0.454 | 0.393 | 8 | 0.773 | 0.679 | 9 | 0.761 | 0.643 | 4 | 0.203 | 0.143 | 7 | 0.658 | 0.714 | 7 | 0.429 | 0.406 | 7.1 | 0.610 | 0.555 |
| ND | 3 | 0.154 | 0.065 | 8 | 0.720 | 0.613 | 7 | 0.674 | 0.613 | 5 | 0.319 | 0.290 | 6 | 0.641 | 0.677 | 4 | 0.226 | 0.240 | 6.7 | 0.584 | 0.525 |
| SD | 5 | 0.171 | 0.179 | 6 | 0.779 | 0.857 | 9 | 0.744 | 0.536 | 6 | 0.475 | 0.071 | 8 | 0.622 | 0.630 | 7 | 0.630 | 0.505 | 7.3 | 0.628 | 0.536 |
| MN | 6 | 0.324 | 0.214 | 7 | 0.795 | 0.786 | 7 | 0.746 | 0.593 | 3 | 0.491 | 0.250 | 5 | 0.586 | 0.607 | 5 | 0.357 | 0.378 | 6.8 | 0.640 | 0.560 |
| NE | 6 | 0.448 | 0.407 | 8 | 0.772 | 0.571 | 6 | 0.723 | 0.556 | 3 | 0.138 | 0.107 | 7 | 0.691 | 0.679 | 8 | 0.429 | 0.382 | 7.0 | 0.630 | 0.568 |
Observed heterozygosity
Expected heterozygosity
Note: Ho values shown in bold represent statistically significant deviations from HWE (P < 0.05; Bonferroni-corrected α).
Phylogenetic analyses
Population pair-wise FSTs based on microsatellite allele frequencies were used to generate a UPGMA population phylogeny (Figure 2). Based on an FST cut-off of 0.05, considered to represent moderate genetic isolation (Wright 1978), three population clusters are present (Figure 2). These include 1) southern Arizona and one population in southern California (Sonoran cluster), 2) populations in the Southwest and West coast (Pacific cluster), and 3) populations in the Midwest and Texas (Midwest cluster).
Figure 2.
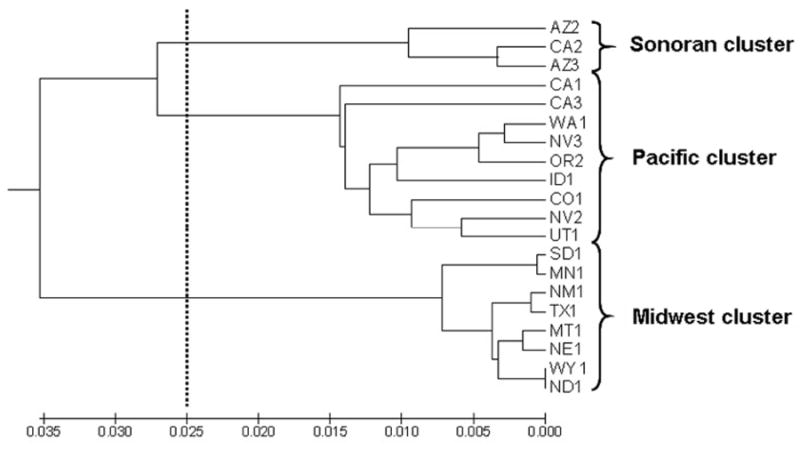
UPGMA tree inferred from multi-locus microsatellite-derived pairwise FSTs. Dashed line indicates FST cutoff of 0.05. Brackets indicate possible genetic clustering of three groups based on cutoff.
Population genetic structure
A K of 3 clusters resulted in a posterior probability of 1.00 in the microsatellite-based multi-locus clustering program STRUCTURE. Posterior probabilities for K = 1, 2, 4 and 5 were nearly zero. ΔK, shown to be a more accurate representative of the true K (Evanno et al. 2005), was also highest for 3 clusters at a value of 400, followed by a ΔK of 256 for 2 clusters. At K = 3, population clustering mirrored that of the FST-based UPGMA tree except for the assignment of population CA_1 to the Sonoran cluster as opposed to the Pacific cluster (Figures 2 and 3A) due to the hybrid nature of this population. Average probabilities of assignment to each cluster were calculated in the run of highest Ln P(D) (Table 2). Admixture was present in all populations, particularly in those comprising the Pacific cluster (Figure 3A).
Figure 3.
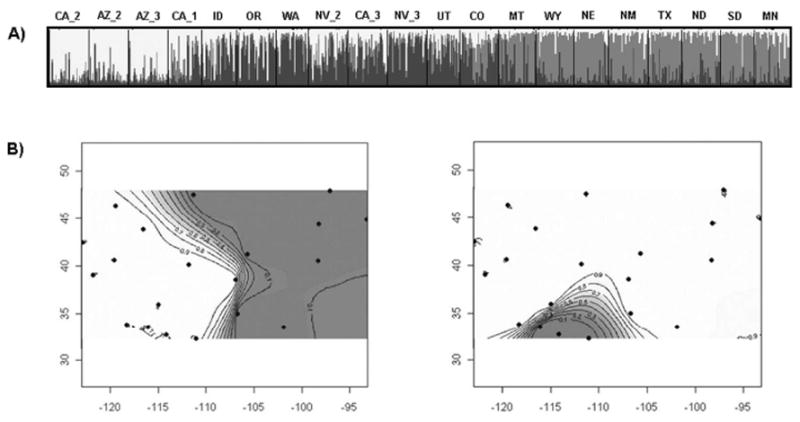
Bayesian population structure analyses indicating the presence of three population clusters. A) Plot from highest log likelihood STRUCTURE run at K = 3. Individuals are grouped by collection site. Each individual is represented by a vertical bar displaying membership coefficients to each of three clusters, depicted as white, gray and black. Cluster numbers correspond closely to those resolved in phylogenetic analysis (Figure 3). B) and C) Maps of posterior probabilities per pixel at K = 2 clusters in GENELAND. B) Modal clustering pattern resolved in 8 of 10 runs. Mean log likelihood = -19487. C) Clustering pattern resolved in 2 of 10 runs. Mean log likelihood = -19803.
Table 2.
Population membership of each population in clusters assigned by STRUCTURE (K = 3)
| Population | Proportion of membership in each cluster | ||||||
|---|---|---|---|---|---|---|---|
| 1 | 2 | 3 | |||||
| Mean | s.e. | Mean | s.e. | Mean | s.e. | ||
| CA_2 | 0.80 | 0.03 | 0.10 | 0.02 | 0.10 | 0.02 | |
| AZ_2 | 0.78 | 0.03 | 0.15 | 0.03 | 0.08 | 0.02 | |
| AZ_3 | 0.75 | 0.04 | 0.14 | 0.03 | 0.11 | 0.02 | |
| CA_1 | 0.50 | 0.05 | 0.27 | 0.04 | 0.23 | 0.03 | |
| Sonoran cluster | 0.71 | 0.02 | 0.16 | 0.02 | 0.12 | 0.01 | |
| ID | 0.18 | 0.04 | 0.46 | 0.05 | 0.35 | 0.05 | |
| OR | 0.27 | 0.05 | 0.63 | 0.05 | 0.10 | 0.02 | |
| WA | 0.13 | 0.02 | 0.68 | 0.05 | 0.19 | 0.04 | |
| NV_2 | 0.31 | 0.04 | 0.52 | 0.04 | 0.16 | 0.03 | |
| CA_3 | 0.19 | 0.02 | 0.49 | 0.04 | 0.32 | 0.04 | |
| NV_3 | 0.11 | 0.03 | 0.73 | 0.04 | 0.16 | 0.03 | |
| UT | 0.22 | 0.03 | 0.52 | 0.05 | 0.26 | 0.03 | |
| CO | 0.19 | 0.02 | 0.47 | 0.05 | 0.34 | 0.04 | |
| Pacific cluster | 0.26 | 0.01 | 0.56 | 0.02 | 0.18 | 0.01 | |
| MT | 0.08 | 0.01 | 0.28 | 0.05 | 0.63 | 0.06 | |
| WY | 0.10 | 0.02 | 0.17 | 0.03 | 0.73 | 0.04 | |
| NE | 0.09 | 0.01 | 0.15 | 0.03 | 0.76 | 0.04 | |
| NM | 0.12 | 0.02 | 0.13 | 0.03 | 0.75 | 0.03 | |
| TX | 0.10 | 0.02 | 0.20 | 0.03 | 0.70 | 0.04 | |
| ND | 0.11 | 0.02 | 0.19 | 0.03 | 0.70 | 0.04 | |
| SD | 0.10 | 0.02 | 0.12 | 0.02 | 0.78 | 0.03 | |
| MN | 0.16 | 0.03 | 0.16 | 0.03 | 0.68 | 0.04 | |
| Midwest cluster | 0.11 | 0.01 | 0.18 | 0.01 | 0.72 | 0.01 | |
All five GENELAND runs at K = 1 – 5 gave a K of two clusters. Of the 10 runs performed at the modal K of 2, eight runs partitioned populations identically along an east-west gradient shown in Figure 3B (mean log likelihood = -19487). This clustering pattern was identical to the partitioning of the Midwest cluster seen in UPGMA and Structure analyses. Two runs separated three populations in The Sonoran cluster from the remaining populations (Figure 3C; mean log likelihood = -19803). Population CA_1 was assigned to the Pacific cluster as suggested by phylogenetic analysis, as opposed to The Sonoran cluster as indicated in STRUCTURE, again highlighting the hybrid nature of this population. Five runs were also performed at K = 3. In every case, these runs resolved the two modal clusters generated at K = 2 (Figure 3B) along with a third ghost cluster. A summary of cluster delineations along with topographic features is given in Figure 1.
Analysis of molecular variance (AMOVA) was conducted by partitioning variation within and among clusters. 5-6% of the variation in allele frequencies was associated with differences among the three regions delineated by the phylogenetic tree and Structure analysis (P < 0.0001) while 93% of observed variation in microsatellites was attributed to within-population differences. The east-west division and southern California/Arizona cluster resolved using GENELAND at K = 2 (Figure 3B and C) each contributed to ~ 4% of overall variation (P < 0.0001).
Gene flow among populations
A Mantel regression of linearized microsatellite FSTs on the natural logarithm of pair-wise distances among sites (Figure S1) revealed significant isolation by distance (slope = 0.063; Mantel p < 0.001) with an R2 value of 0.21.
Mean pair-wise FSTs for microsatellite allele frequencies ranged from 0.000 to 0.125. Markov chain pair-wise exact tests (Goudet et al. 1996) revealed significant differences among several populations within and among clusters (Table 3). Populations within the Sonoran and Pacific clusters exhibited low but significant FST values while pair-wise FSTs within the Midwest cluster did not generally achieve significance. Overall, patterns were generally consistent with population structure estimates based on clustering analyses.
Table 3.
Microsatellite-derived pairwise genetic differentiation (FST) among 20 Culex tarsalis populations
| Great Falls |
Benton | Gem Co |
Jackson Co | Washoe | Yuba | Clark | Los Angeles |
Riverside | Tuscon | Yuma | Laramie | Utah Co |
Gunnison | Albuquerque | Lubbock | Grand Forks |
Beadle | Hennepin | ||
|---|---|---|---|---|---|---|---|---|---|---|---|---|---|---|---|---|---|---|---|---|
| MT | WA | ID | OR | NV_2 | CA_3 | NV_3 | CA_1 | CA_2 | AZ_2 | AZ_3 | WY | UT | CO | NM | TX | ND | SD | MN | ||
|
|
||||||||||||||||||||
| Great Falls | MT | -- | ||||||||||||||||||
| Benton | WA | 0.056 | -- | |||||||||||||||||
| Gem Co | ID | 0.052 | 0.021 | -- | ||||||||||||||||
| Jackson Co | OR | 0.059 | 0.011 | 0.016 | -- | |||||||||||||||
| Washoe | NV_2 | 0.032 | 0.024 | 0.026 | 0.026 | -- | ||||||||||||||
| Yuba | CA_3 | 0.045 | 0.034 | 0.026 | 0.017 | 0.017 | -- | |||||||||||||
| Clark | NV_3 | 0.058 | 0.006 | 0.025 | 0.007 | 0.028 | 0.033 | -- | ||||||||||||
| Los Angeles | CA_1 | 0.044 | 0.031 | 0.024 | 0.024 | 0.026 | 0.029 | 0.039 | -- | |||||||||||
| Riverside | CA_2 | 0.087 | 0.077 | 0.075 | 0.072 | 0.056 | 0.071 | 0.085 | 0.051 | -- | ||||||||||
| Tuscon | AZ_2 | 0.088 | 0.059 | 0.040 | 0.036 | 0.054 | 0.050 | 0.057 | 0.031 | 0.023 | -- | |||||||||
| Yuma | AZ_3 | 0.058 | 0.061 | 0.041 | 0.047 | 0.029 | 0.040 | 0.061 | 0.025 | 0.007 | 0.015 | -- | ||||||||
| Laramie | WY | 0.006 | 0.083 | 0.077 | 0.077 | 0.050 | 0.047 | 0.080 | 0.060 | 0.115 | 0.116 | 0.078 | -- | |||||||
| Utah Co | UT | 0.033 | 0.008 | 0.024 | 0.027 | 0.012 | 0.038 | 0.013 | 0.029 | 0.067 | 0.054 | 0.046 | 0.070 | -- | ||||||
| Gunnison | CO | 0.022 | 0.029 | 0.019 | 0.038 | 0.023 | 0.030 | 0.032 | 0.028 | 0.073 | 0.059 | 0.047 | 0.047 | 0.014 | -- | |||||
| Albuquerque | NM | 0.007 | 0.086 | 0.078 | 0.082 | 0.048 | 0.054 | 0.087 | 0.061 | 0.100 | 0.109 | 0.068 | 0.007 | 0.063 | 0.039 | -- | ||||
| Lubbock | TX | 0.006 | 0.075 | 0.068 | 0.067 | 0.038 | 0.042 | 0.072 | 0.051 | 0.099 | 0.099 | 0.065 | 0.009 | 0.053 | 0.036 | 0.002 | -- | |||
| Grand Forks | ND | 0.012 | 0.093 | 0.085 | 0.082 | 0.058 | 0.051 | 0.088 | 0.062 | 0.125 | 0.120 | 0.084 | -0.007 | 0.076 | 0.051 | 0.006 | 0.011 | -- | ||
| Beadle | SD | 0.020 | 0.097 | 0.077 | 0.084 | 0.057 | 0.053 | 0.089 | 0.050 | 0.119 | 0.109 | 0.076 | 0.004 | 0.076 | 0.054 | 0.015 | 0.014 | 0.012 | -- | |
| Hennepin | MN | 0.021 | 0.087 | 0.063 | 0.072 | 0.048 | 0.040 | 0.080 | 0.043 | 0.104 | 0.092 | 0.064 | 0.007 | 0.067 | 0.046 | 0.023 | 0.021 | 0.011 | 0.001 | -- |
| Adams | NE | 0.003 | 0.078 | 0.085 | 0.082 | 0.049 | 0.051 | 0.083 | 0.053 | 0.103 | 0.108 | 0.074 | 0.002 | 0.058 | 0.047 | 0.006 | 0.007 | 0.006 | 0.009 | 0.015 |
Note: FST values shown in bold indicate significance (P < 0.05; Bonferroni-corrected α) based on pair-wise exact tests of genetic differentiation.
Patterns in WNV invasion and C. tarsalis genetic structure
West Nile Virus invaded the United States in four phases, the latter three of which correspond roughly to genetic barriers in C. tarsalis (Figure 4). In the first phase, from 1999-2001, WNV moved across the eastern US to the Mississippi River, outside of C. tarsalis’ habitat range (Darsie & Ward 1981). In 2002, WNV reached the eastern edge of C. tarsalis’ distribution. By the end of the same year, the virus had invaded the Plains region, fully encompassing the Midwest cluster. In 2003, during the third phase of invasion, WNV traveled southwest to occupy the Sonoran cluster and also began to move across the Rockies into parts of the Pacific cluster. By 2004, the virus had dispersed north through California and across the west to span the rest of the Pacific cluster.
Figure 4.
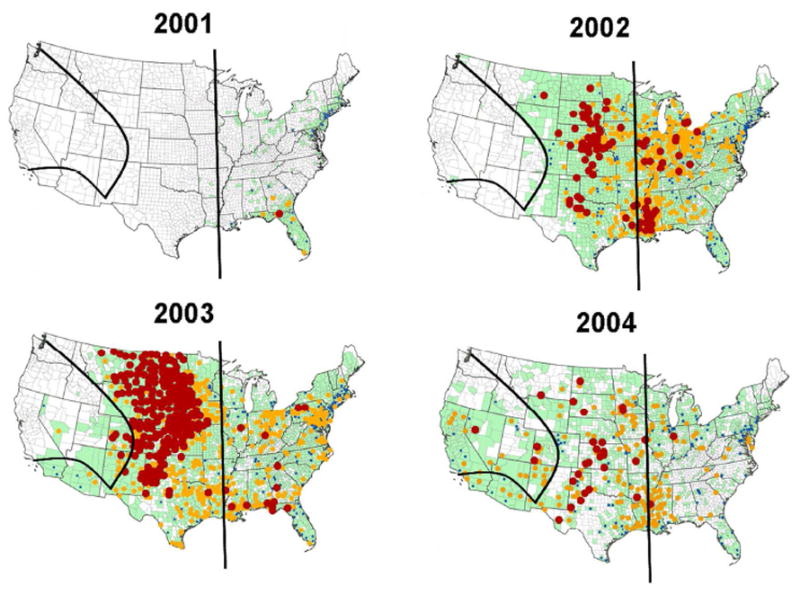
Distribution of WNV incidence in humans and reports of any WNV activity (green) by county and year. Maps courtesy of the CDC. Dots represent human incidence rates per million (blue: 0.01-9.99; yellow: 10-99.99; red: ≥100). Green indicates any WNV activity (human, mosquito, or bird). The black vertical line roughly represents the eastern boundary of Cx. tarsalis. The two curved black lines represent observed barriers to gene flow among the three clusters of Cx. tarsalis populations.
DISCUSSION
Microsatellite-based estimates of genetic distance indicate that gene flow among geographically disparate populations of C. tarsalis is high in some regions and restricted in others, producing three genetically distinct clusters of populations (Figure 1). These results corroborate findings from a smaller study in 2005 (Venkatesan et al. 2007a), which also indicated that a range expansion may have homogenized populations hundreds of thousands of years ago. The limited number of populations and loci in the 2005 study along with the potentially confounding effects of range expansion led us the conjecture that a more detailed survey would reveal greater population structure in C. tarsalis. However, the results of our current study, which includes more populations and markers, have bolstered our initial findings and suggest that few barriers to gene flow exist across the range of C. tarsalis in the United States. While homogenization events can lead to an underestimate of population structure, the observed pattern of strong genetic barriers in some regions and panmixia in others likely reflects current levels of gene flow rather than a historical artifact as previously hypothesized.
Based on FST and multi-locus clustering analyses, three clusters of populations are present: the Sonoran cluster near the Mexican border, the Pacific cluster spanning coastal, montane and intermontane regions in the West and the Midwest cluster (Figure 1). These three clusters reinforced findings from the 2005 study. Population CA_2, which had previously clustered separately from all other populations including a neighboring population (CA_1) in southern California, continued to remain distinct, grouping with southern Arizona populations to form the Sonoran cluster. Similarly, the barrier between Colorado (Pacific cluster) and New Mexico and Nebraska (Midwest cluster) re-emerged as a rough north-south division bisecting the West and Midwest. This division was also supported by a recent Colorado study where microsatellites revealed strong genetic differentiation between western (Pacific cluster) and eastern (Midwest cluster) C. tarsalis populations but not among eastern populations (Barker et al. 2009).
The barrier between the Sonoran and Pacific clusters may be mediated by two geographical features, the Mogollon Rim of the Colorado Plateau in the east and the transition between the Mojave and Sonoran deserts to the west. The Sonoran cluster is approximately 1600 meters lower in elevation (Figure 1) and 19° C warmer than the Mogollon Rim (University of Arizona 2002) to the northeast. The climate in the Sonoran desert is also much wetter than the Mojave Desert to the northwest, experiencing biannual rains and over twice the precipitation than the southern edge of the Pacific clusters (University of Arizona 2002), potentially reducing temporal overlap among populations. Between the Pacific and Midwest clusters lies the Rocky Mountain Range. Moving eastward toward the High Plains, elevation decreases by over 3000 meters (Figure 1) while annual precipitation declines several fold. These differences in elevation, temperature and precipitation, features known to affect dispersal and population dynamics in C. tarsalis (Reisen & Lothrop 1995, Reisen et al. 1992, Reisen & Reeves 1990), may play a role in isolating populations among clusters.
Strikingly, populations within the Pacific and Midwest clusters, each spanning large distances (>1000 km) and containing dramatic geographic features including mountain ranges and deserts, showed very little genetic structure. Pacific cluster populations, ranging from Washington to Nevada and from California to Colorado, exhibited FSTs in the range of 0.006 to 0.039. Populations in the Midwest cluster, ranging from North Dakota to Texas and Montana to Minnesota exhibited even less genetic differentiation (FST range -0.007 to 0.027), of which only two pair-wise comparisons achieved statistical significance (Table 3). These FST values are indicative of panmixia or near panmixia (Wright 1951) across large geographic areas in the West and Great Plains despite potential barriers to gene flow such as the Cascade and Sierra Nevada mountains and Great Basin desert. Why such features may be responsible for generating the barriers to gene flow between clusters described above but not within them is unclear, suggesting that the forces driving genetic isolation in C. tarsalis are not yet fully understood.
While populations generally showed high probability of membership in their clusters, several populations located near cluster boundaries, such as ID, CO, and CA_1 exhibited considerable admixture (Figure 3A; Table 2). These populations share membership in both their assigned cluster and the neighboring cluster. The presence of admixed border populations suggests that genetic differentiation of C. tarsalis occurs along a gradient, with transition zones between the Pacific and Midwest clusters occurring along an east-west axis and between the Sonoran and Pacific clusters along a smaller north-south plane, perhaps corresponding to the geographic and/or climatic clines described above. Further investigation is required to quantify the true extent and scope of genetic exchange among clusters and to determine why admixture at the borders has not homogenized populations across clusters.
Our findings of extensive gene flow within clusters and zones of admixture between clusters are consistent with the ecology and dispersal behavior of C. tarsalis. C. tarsalis tends to breed and hunt along riparian and agricultural corridors, traveling most when host-seeking (Milby et al. 1983; Reisen & Reeves 1990). Females have been shown to disperse randomly to hunt and locate oviposition sites rather than following known flight paths (Reisen & Lothrop 1995), a behavior that may be reproductively beneficial since C. tarsalis prefers to feed on wide-ranging passeriform birds and oviposit in newly created or perturbed substrates (Reisen & Lothrop 1995; Beehler & Mulla 1993). Moreover, mark-release-recapture studies have shown that inseminated females can travel several kilometers per night and that dispersal continues on consecutive nights (Reisen & Reeves 1990).
Given C. tarsalis’ propensity to move and our evidence of high gene flow across large geographic areas, we speculate that this mosquito may be involved in the dispersal of WNV in the western United States. While the prevailing theory suggests that random short-range movement of resident birds has precipitated the invasion of WNV across the United States, the possibility of mosquito dispersal has not been ruled out (Rappole et al. 2006, Reisen et al. 2004). Resident bird movements are relatively small, totaling less than 15 km per individual and contributing to the westward movement of WNV at an approximate rate of 70 km/month during the first two years of its North American invasion (Rappole & Hubalek 2003). Given that its flight range can be as large as 4 km/day (Reisen & Reeves 1990), it is feasible that C. tarsalis may serve as an introductory host of WNV while engaging in hunting and breeding-related movement, especially since infected mosquitoes can remain infective for life. In many Great Plains states such as Colorado, C. tarsalis breeds in agricultural habitats outside of the city and but can travel miles into urban or suburban developments to hunt (Winters et al. 2008a). Coupled with the fact that females tend to host-seek in new areas as described above, these observations support a potential role in the transport of virus.
The genetic structure observed in C. tarsalis appears to be more consistent with the movement of WNV than that predicted by resident bird movement. Once WNV reached the eastern limits of C. tarsalis’ range in 2001, it rapidly spread across the functionally panmictic Midwest cluster (Figure 4). Within one year, WNV had reached the border of the Pacific cluster, from Montana and parts of Washington to eastern New Mexico (Figure 4). In contrast, a model of the spread of WNV in the United States based on resident bird movement predicts a gradual, step-wise westward invasion between 1999 and 2003 (Rappole et al. 2006), without the observed rapid jump across the Great Plains and Midwest within one year. Additionally, the bird movement model predicts a WNV invasion of the Southwest beginning in 2001, reaching California in 2002 and spreading through much of the state by 2003 (Rappole et al. 2006). However, WNV was not detected in Nevada or the southern tip of California (Sonoran cluster) until 2003, despite already having reached neighboring sites in southern Arizona (Midwest cluster) during the previous year, and did not spread north through California (Pacific cluster) until 2004. These discrepancies between the observed dynamics of WNV movement in the western United States and that expected by resident bird dispersal may be attributable to patterns of gene flow and genetic barriers in C. tarsalis.
Aside from flight, anthropogenic and weather-induced movement has also been suggested as a more rapid mechanism of dispersal of infected mosquitoes. Reisen et al. (2004) identified a WNV-infected female C. tarsalis mosquito before sentinel birds or other surveillance tools picked up the invasion of southern California by the virus in 2003. Mosquito movement via commerce along highways was considered but rejected as a remote possibility in this case since mosquitoes traveling from epidemic centers in Colorado and Nebraska would likely first be transported to the Central Valley instead of southern California. Instead, the authors hypothesized that airflow generated by climate patterns in the summer of 2003 introduced infected C. tarsalis from Colorado to southern Arizona and southern California. It is possible that weather events such as wind, as opposed to actual mosquito flight, may be responsible for admixture and occasional gene flow among clusters. Regardless, movement of C. tarsalis by various means probably contributes to high gene flow in much of the western United States and, in some cases, may also contribute significantly to the spread of WNV.
In addition to C. tarsalis, other vectors including C. pipiens and C. quinquefasciatus may participate in arboviral movement through parts of North America. C. quinquefasciatus is a major vector of WNV along with C. tarsalis in the western United States, particularly in residential areas. Studies in California have shown that C. quinquefasciatus is known to move several kilometers and to travel between riparian and urban habitats, at times moving even further than C. tarsalis (Reisen et al. 1992). Population genetic studies, while largely focusing on the north-south distribution of C. pipiens, C. quinquefasciatus and hybrid zones, provide limited evidence that populations are structured along a longitudinal gradient as well. In the eastern US, FST was found to increase by 0.035 with every 100 km of longitude (Edillo et al. 2007). A detailed east-west characterization of gene flow in C. quinquefasciatus in the western US would help to elucidate the relationship between mosquito dispersal and the spread of WNV.
The genetic characterization presented here along with information from ecological, behavioral and epidemiological studies indicates that movement of C. tarsalis, along with other factors, could play a role in the invasion of the western United States by WNV. While the effect of mosquito movement on the spread and dynamics of WNV cannot be easily tested in the field, our study suggests that the inclusion of mosquito movement, particularly of Culex vectors, may be useful in future studies modeling arboviral invasion.
Supplementary Material
Acknowledgments
Dozens of Mosquito Control Districts across the country enthusiastically provided us with specimens, without whom this research would not have been possible. Lynne Gardner-Santana provided helpful advice and suggestions for spatial genetic analysis. Tim Shields kindly generated maps to indicate collection sites and topography. This work was funded by NIH/NIEHS Training Grant T32ES07141 to MV and NIH/NIAID grant R01AI067371 to JLR.
References
- Barker CM, Bolling BG, Black WC, IV, Moore CG, Eisen L. Mosquitoes and West Nile virus along a river corridor from prairie to montane habitats in eastern Colorado. Journal of Vector Ecology. 2009;34:276–293. doi: 10.1111/j.1948-7134.2009.00036.x. [DOI] [PubMed] [Google Scholar]
- Beehler JW, Mulla S. The effect of organic enrichment and flooding duration on the oviposition behavior of Culex mosquitoes. Proceedings of the California Mosquito Vector Control Association. 1993;61:121–124. [Google Scholar]
- Black WC, IV, DuTeau NM. RAPD-PCR and SSCP analysis for insect population genetic studies. In: Crampton JM, Beard CB, Louis C, editors. The molecular biology of insect disease vectors. Cambridge University Press; Cambridge: 1997. pp. 361–373. [Google Scholar]
- Bohonak AJ. IBD (Isolation By Distance): A program for analyses of isolation by distance. Journal of Heredity. 2002;93:153–154. doi: 10.1093/jhered/93.2.153. [DOI] [PubMed] [Google Scholar]
- Bolling BG, Barker CM, Moore CG, Pape WJ, Eisen L. Seasonal patterns for entomological measures of risk for exposure to Culex vectors and West Nile virus in relation to human disease cases in northeastern Colorado. Journal of Medical Entomology. 2009;46:1519–1531. doi: 10.1603/033.046.0641. [DOI] [PMC free article] [PubMed] [Google Scholar]
- Boutin-Ganache I, Raposo M, Raymond M, Deschepper CF. M13-tailed primers improve the readability and usability of microsatellite analyses performed with two different allele-sizing methods. Biotechniques. 2001;31:25–28. [PubMed] [Google Scholar]
- CDC (Centers for Disease Control and Prevention), Department of Health and Human Services. [July 12, 2009];Final 2002 West Nile Virus Activity in the United States. 2002 http://www.cdc.gov/ncidod/dvbid/westnile/Mapsactivity/surv&control02Maps.htm.
- CDC (Centers for Disease Control and Prevention), Department of Health and Human Services. MMWR Morbidity and Mortality Weekly Report. Vol. 48. 1999. Update: West Nile-like viral encephalitis–New York, 1999; pp. 890–892. [PubMed] [Google Scholar]
- Darsie RF, Ward RA. Identification and geographical distribution of the mosquitoes of North America, north of Mexico. Mosquito Systematics Supplement. 1981;1:1–313. [Google Scholar]
- DiMenna MA, Bueno R, Jr, Parmenter RA, et al. Emergence of West Nile virus in mosquito (Diptera: Culicidae) communities of the New Mexico Rio Grande Valley. Journal of Medical Entomology. 2006;43:594–599. doi: 10.1603/0022-2585(2006)43[594:eownvi]2.0.co;2. [DOI] [PMC free article] [PubMed] [Google Scholar]
- Edillo F, Kiszewski A, Manjourides J, et al. Effects of latitude and longitude on the population structure of Culex pipiens, s.l., vectors of West Nile virus in North America. American Journal of Tropical Medicine and Hygiene. 2007;81:842–848. doi: 10.4269/ajtmh.2009.08-0605. [DOI] [PMC free article] [PubMed] [Google Scholar]
- Evanno G, Regnaut S, Goudet J. Detecting the number of clusters of individuals using the software STRUCTURE: a simulation study. Molecular Ecology. 2005;14:2611–2620. doi: 10.1111/j.1365-294X.2005.02553.x. [DOI] [PubMed] [Google Scholar]
- Excoffier L, Laval G, Schneider S. Arlequin ver. 3.0: An integrated software package for population genetics data analysis. Evolutionary Bioinformatics Online. 2005;1:47–50. [PMC free article] [PubMed] [Google Scholar]
- Goudet J, Raymond M, de Meeüs T, Rousset F. Testing differentiation in diploid populations. Genetics. 1996;144:1933–1940. doi: 10.1093/genetics/144.4.1933. [DOI] [PMC free article] [PubMed] [Google Scholar]
- Guillot G, Estoup A, Mortier F, Cosson JF. A spatial statistical model for landscape genetics. Genetics. 2005a;170:1261–1280. doi: 10.1534/genetics.104.033803. [DOI] [PMC free article] [PubMed] [Google Scholar]
- Guillot G, Mortier F, Estoup A. Geneland: a computer package for landscape genetics. Molecular Ecology Notes. 2005b;5:712–715. [Google Scholar]
- Hayes EB, Komar N, Nasci RS, et al. Epidemiology and transmission dynamics of West Nile virus disease. Emerging Infectious Diseases. 2005;11:1167–1173. doi: 10.3201/eid1108.050289a. [DOI] [PMC free article] [PubMed] [Google Scholar]
- Hubálek Z, Halouzka J. West Nile fever--a reemerging mosquito-borne viral disease in Europe. Emerging Infectious Diseases. 1999;5:643–650. doi: 10.3201/eid0505.990505. [DOI] [PMC free article] [PubMed] [Google Scholar]
- Kilpatrick AM, Kramer LD, Jones MJ, Marra PP, Daszak P. West Nile virus epidemics in North America are driven by shifts in mosquito feeding behavior. PLoS Biology. 2006;4:0606–0610. doi: 10.1371/journal.pbio.0040082. [DOI] [PMC free article] [PubMed] [Google Scholar]
- Lindsey NP, Kuhn S, Campbell GL, Hayes EB. West Nile virus neuroinvasive disease incidence in the United States, 2002-2006. Vector Borne and Zoonotic Diseases. 2008;8:35–39. doi: 10.1089/vbz.2007.0137. [DOI] [PubMed] [Google Scholar]
- Pitzer JB, Byford RL, Vuong HB, Steiner RL, Creamer RJ, Caccamise DF. Potential vectors of West Nile virus in a semiarid environment: Doña Ana County, New Mexico. Journal of Medical Entomology. 2009;46:1474–1482. doi: 10.1603/033.046.0634. [DOI] [PubMed] [Google Scholar]
- Pritchard JK, Stephens M, Donnelly P. Inference of population structure using multilocus genotype data. Genetics. 2000;155:945–959. doi: 10.1093/genetics/155.2.945. [DOI] [PMC free article] [PubMed] [Google Scholar]
- Rappole JH, Compton BW, Leimgruber P, Robertson J, King DI, Renner SC. Modeling movement of West Nile virus in the Western hemisphere. Vector Borne and Zoonotic Diseases. 2006;6:128–139. doi: 10.1089/vbz.2006.6.128. [DOI] [PubMed] [Google Scholar]
- Rappole JH, Hubálek Z. Migratory birds and West Nile virus. Journal of Applied Microbiology. 2003;94(Supplement):47S–58S. doi: 10.1046/j.1365-2672.94.s1.6.x. [DOI] [PubMed] [Google Scholar]
- Rappole JH, Derrickson SR, Hubálek Z. Migratory birds and spread of West Nile virus in the Western Hemisphere. Emerging Infectious Diseases. 2000;6:319–328. doi: 10.3201/eid0604.000401. [DOI] [PMC free article] [PubMed] [Google Scholar]
- Raymond M, Rousset F. GenePop, version 1.2. A population genetics software for exact tests and ecumenicism. Journal of Heredity. 1995;26:248–249. [Google Scholar]
- Rasgon JL, Venkatesan M, Westbrook CJ, Hauer CM. Polymorphic microsatellite loci from the West Nile virus vector Culex tarsalis. Molecular Ecology Notes. 2006;6:680–682. [Google Scholar]
- Reisen WK, Lothrop H, Chiles R, et al. West Nile virus in California. Emerging Infectious Diseases. 2004;10:1369–1378. doi: 10.3201/eid1008.040077. [DOI] [PMC free article] [PubMed] [Google Scholar]
- Reisen WK, Lothrop H. Population ecology and dispersal of Culex tarsalis (Diptera: Culicidae) in the Coachella Valley of California. Journal of Medical Entomology. 1995;32:490–502. doi: 10.1093/jmedent/32.4.490. [DOI] [PubMed] [Google Scholar]
- Reisen WK, Milby MM, Meyer RP. Population dynamics of adult Culex mosquitoes (Diptera: Culicidae) along the Kern River, Kem County, California, in 1990. Journal of Medical Entomology. 1992;29:531–543. doi: 10.1093/jmedent/29.3.531. [DOI] [PubMed] [Google Scholar]
- Reisen WK, Reeves WC. Bionomics and ecology of Culex tarsalis and other potential mosquito vector species. In: Reeves WC, editor. Epidemiology and control of mosquito-borne arboviruses in California, 1943-1987. California mosquito and vector control association; Sacramento: 1990. pp. 254–329. [Google Scholar]
- Rosenberg NA. DISTRUCT: a program for the graphical display of population structure. Molecular Ecology Notes. 2004;4:137–138. [Google Scholar]
- Rousset F. Genetic differentiation and estimation of gene flow from F-statistics under isolation by distance. Genetics. 1997;145:1219–1228. doi: 10.1093/genetics/145.4.1219. [DOI] [PMC free article] [PubMed] [Google Scholar]
- Turell MJ, Dohm DJ, Sardelis MR, et al. An update on the potential of north American mosquitoes (Diptera: Culicidae) to transmit West Nile virus. Journal of Medical Entomology. 2005;42:57–62. doi: 10.1093/jmedent/42.1.57. [DOI] [PubMed] [Google Scholar]
- University of Arizona. Deserts of the World: The Sonoran Desert. [September 3, 2008];2002 http://alic.arid.arizona.edu/sonoran/index.html.
- Venkatesan M, Westbrook CJ, Hauer MC, Rasgon JL. Evidence for a population expansion in the West Nile Virus vector Culex tarsalis. Molecular Biology and Evolution. 2007a;24:1208–1218. doi: 10.1093/molbev/msm040. [DOI] [PMC free article] [PubMed] [Google Scholar]
- Venkatesan M, Hauer MC, Rasgon JL. Using fluorescently labeled M13-tailed primers to isolate 45 novel microsatellite loci from the arboviral vector Culex tarsalis. Medical and Veterinary Entomology. 2007b;21:204–208. doi: 10.1111/j.1365-2915.2007.00677.x. [DOI] [PMC free article] [PubMed] [Google Scholar]
- Weir B, Cockerham C. Estimating F-statistics for the analysis of population structure. Evolution. 1984;38:1358–1370. doi: 10.1111/j.1558-5646.1984.tb05657.x. [DOI] [PubMed] [Google Scholar]
- Wimberly MC, Hildreth MB, Boyte SP, Lindquist E, Kightlinger L. Ecological niche of the 2003 West Nile virus epidemic in the northern Great Plains of the United States. PLoS ONE. 2008;3:e3744. doi: 10.1371/journal.pone.0003744. [DOI] [PMC free article] [PubMed] [Google Scholar]
- Winters AM, Eisen RJ, Lozano-Fuentes S, Moore CG, Pape WJ, Eisen L. Predictive spatial models for risk of West Nile virus exposure in eastern and western Colorado. American Journal of Tropical Medicine and Hygiene. 2008a;79:581–90. [PMC free article] [PubMed] [Google Scholar]
- Winters AM, Bolling BG, Beaty BJ, et al. Combining mosquito vector and human disease data for improved assessment of spatial West Nile virus disease risk. American Journal of Tropical Medicine and Hygiene. 2008b;78:654–65. [PubMed] [Google Scholar]
- Wright S. The genetical structure of populations. Annals of Eugenics. 1951;15:323–354. doi: 10.1111/j.1469-1809.1949.tb02451.x. [DOI] [PubMed] [Google Scholar]
Associated Data
This section collects any data citations, data availability statements, or supplementary materials included in this article.