

Abstract
S-Nitrosylation is a reversible PTM for regulating protein function. Thioredoxin-1 (Trx1) catalyzes either transnitrosylation or denitrosylation of specific proteins, depending on the redox status of the cysteines within its conserved oxidoreductase CXXC motif. With a disulfide bond formed between the two catalytic cysteines, Trx1 is not only inactive as a denitrosylase, but it may also be nitrosylated at Cys73 and serve as a transnitrosylating agent. Identification of Trx1-mediated transnitrosylation or denitrosylation targets will contribute to a better understanding of Trx1’s function. Previous experimental approaches based on the attenuation of CXXC oxidoreductase activity cannot readily distinguish Trx1 transnitrosylation targets from denitrosylation targets. In this study, we used the ICAT method in conjunction with the biotin switch technique to differentiate Trx1 transnitrosylation targets from denitrosylation target proteins from neuroblastoma cells. We demonstrate that the ICAT approach is effective for quantitative identification of putative Trx1 transnitrosylation and denitrosylation target peptides. From these analyses, we confirmed reports that peroxiredoxin 1 is a Trx1 transnitrosylation, but not a denitrosylation target, and we found several other proteins, including cyclophilin A to be modulated in this manner. Unexpectedly, we found that many nitrosylation sites are reversibly regulated by Trx1, suggesting a more prominent role for Trx1 in regulating S-nitrosylation.
Keywords: thioredoxin, transnitrosylation, denitrosylation, SH-SY5Y, ICAT
1. Introduction
Endogenous nitric oxide (NO) is primarily derived from the catabolism of l-arginine by nitric oxide synthases. This simple gaseous molecule was first identified as the primary mediator of vasodilation in arterial smooth muscle [1], but it is now understood to influence a plethora of biochemical pathways and disease states and is today one of the most actively researched molecules (for reviews see Refs. [2] and [3]). In addition to modulating cyclic guanosine monophosphate levels and downstream signaling events, NO regulation is often enacted through covalent attachment to the cysteine sulfhydryl group of proteins, a process known as S-nitrosylation or nitrosation. This post-translation modification (PTM) has been found to be important for determining protein structure and function [4] and [5]. Not all cysteines in a protein become nitrosylated, only those that reside in a 3D structural environment amenable for binding with specific NO donors and/or creating an acidic pKa appear susceptible to nitrosylation [6] and [7]. The fact that protein nitrosylation is reversible, further solidifies its significance as a regulatory mechanism for fine tuning protein activities within associated biochemical pathways, and implies that certain proteins may act as specific denitrosylases (able to remove NO from a S-nitrosylated protein), or transnitrosylases (able to donate NO to an acceptor protein). Therefore, there is great interest in how transnitrosylation and denitrosylation are regulated in biological systems, including the identification of protein nitrosylation sites and the quantification of the dynamic status of protein nitrosylation.
Thioredoxin 1 is an oxidoreductase found in both prokaryotes and eukaryotes; together with thioredoxin reductase (TrxR) and the reduced form of nicotinamide adenine dinucleotide phosphate (NADPH), they constitute the thioredoxin reductive system which is essential for maintaining cellular redox balance (for reviews see Refs. [8] and [9]). Human Trx1 contains two cysteines, Cys32 and Cys35 in its evolutionarily conserved -Trp-Cys-Gly-Pro-Cys-Lys catalytic center. In their reduced thiol form (rTrx1), Cys32 and Cys35 can catalytically reduce specific protein disulfide bonds and other oxidative cysteine modifications, and can serve as a denitrosylase towards specific S-nitrosylated proteins (SNO-proteins) and other S-nitrosylated species [9], [10], [11] and [12], resulting in the formation of a disulfide bond between Cys32 and Cys35 [10] and [13]. Oxidized Trx1 (oTrx1) is subsequently restored to its active thiol form by the NADPH-dependent flavoprotein TrxR which resolves the Cys32-Cys35 disulfide bond. Human Trx1 contains the additional conserved Cys62, Cys69 and Cys73 that undergo a variety of PTMs, including S-nitrosylation [14], [15], [16], [17] and [18]. It is now known that nitrosylated Trx1 (SNO-Trx1) can derive from oTrx1 and act as a transnitrosylating agent [19] and [20]. We recently uncovered a redox-dependent mechanism that toggles the different functions of Trx1. When Cys32 and Cys35 are reduced to thiols, Trx1 can act as a denitrosylase or as a reductase (Fig. 1) [20]. However, Trx1 can only become nitrosylated on Cys73 when Cys32 and Cys35 are oxidized, SNO-Trx1 can then act as a transnitrosylating agent (Fig. 1) [20].
Fig. 1. Schematic of Trx1 regulation of protein nitrosylation.
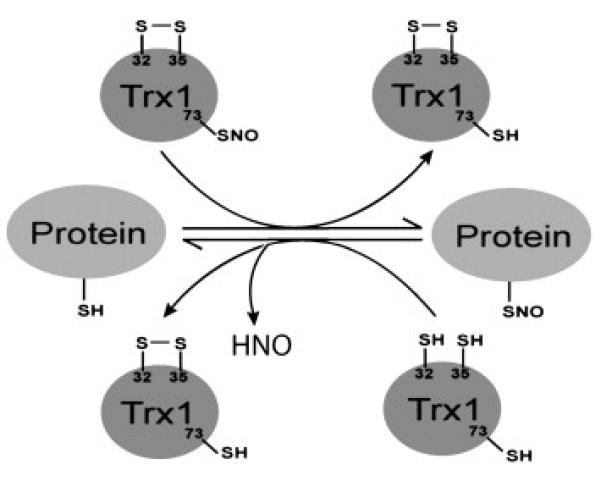
Trx1 Cys32 and Cys35 can denitrosylate specific SNO-proteins [10], [11] and [12], resulting in the formation of a disulfide bond between Cys32 and Cys35 [10] and [13]. SNO-Trx1 can be produced in cells after the formation of a Cys32 and Cys35 disulfide bond and act as a transnitrosylase for specific targets [19] and [20]. It should be noted that SNO-Trx1 transnitrosylation targets and rTrx1 denitrosylation targets may not overlap. Adapted from [20].
To identify possible Trx1 transnitrosylation targets, we previously used a Trx1 dominant negative and denitrosylase-inactive mutant, in which Cys32 and Cys35 were mutated to Ser (Trx1C32S/C35S) [21]. Overexpression of this mutant in HeLa cells resulted in an observable increase in protein nitrosylation, and after substitution of S-nitrosylation by N-(6-(Biotinamido)hexyl)-3′-(2′-pyridyldithio)-propionamide (biotin-HPDP), using the well established biotin switch technique (BST), we were able to identify 36 S-nitrosylated cysteine (SNO-Cys) sites by MS/MS pertaining to 28 target proteins [20]. Benhar et al. used an analogous approach, in which oTrx1 was produced by incubating cells with TrxR inhibitors, for the identification of Trx1 denitrosylation targets [22]. A potential drawback of these approaches includes the inability to distinguish genuine Trx1 transnitrosylation targets from denitrosylation targets, since both oTrx1 and Trx1C32S/C35S are not only inactive as a denitrosylase, but also are capable of being converted into a transnitrosylating agent. Therefore, the increase in SNO-proteins in these cells may be due to either increased Trx1-mediated transnitrosylation, decreased denitrosylation or both. In addition, conventional BST methods are unable to accurately quantify the extent of S-nitrosylation changes at a particular SNO-Cys site; such information is crucial for distinguishing specific Trx1 catalytic targets from non-specific ones. To overcome these technical problems, we evaluated isotope-coded affinity tag (ICAT) reagents as possible advantageous substitutes for biotin-HPDP in BST [23] to distinguish Trx1 transnitrosylation from denitrosylation target sites in proteins derived from SH-SY5Y cells. Dynamic regulation of protein nitrosylation has been shown in SH-SY5Y and other neuronal cells. For example, increased denitrosylation of anti-apoptotic Bcl-2 was previously reported in this neuroblastoma cell line upon kainic acid treatment—a model for studying epileptic seizure [24]. In this study, we demonstrate the comparable specificity of biotin-HPDP and ICAT reagents to label SNO-Cys sites, and the advantage of ICAT to accurately quantify the extent of S-nitrosylation within specific peptides. We found 76 putative SNO-Cys sites targeted by SNO-Trx1 transnitrosylase in 61 proteins, and 50 putative SNO-Cys sites targeted by rTrx1 denitrosylase in 45 proteins in vitro. Importantly, the thiol-specific and quantitative capability of ICAT enabled us to discover 8 peptides that are solely regulated by SNO-Trx1 transnitrosylation but not rTrx1 denitrosylation, and 43 peptides whose SNO-Cys residues can be regulated reversibly by Trx1-mediated trans- or denitrosylation.
2. Material and methods
2.1. Reagents and preparation of SNO-Trx1
Recombinant human Trx1 and chemical reagents were purchased from Sigma (St. Louis, MO, USA) unless otherwise indicated. Acetonitrile (ACN) and HPLC-grade water were obtained from J.T. Baker (Phillipsburg, NJ, USA). Formic acid was purchased from EMD Chemicals (Merck KGaA, Darmstadt, Germany). Following our previously established method to generate transnitrosylase-active SNO-Trx1 [25], recombinant human Trx1 (100 μg) was mixed with a 25-fold molar excess of S-nitrosoglutathione (GSNO) in 50 μl nitrosylation buffer (NB, 50 mM Tris, pH 7.5, 1 mM EDTA and 0.1 mM neocuproine) at 37 °C for 30 min in the dark. Resulting SNO-Trx1 was precipitated with cold acetone at − 20 °C for 1 h, washed four times with cold acetone at − 20 °C, and dissolved in 30 μl NB.
2.2. Cell lysate preparation
SH-SY5Y cells (ATCC; CRL-2266) were grown at 37 °C in DMEM/F12 media containing 10% FBS in a 5% CO2 atmosphere. The cells were harvested via centrifugation at 500 g for 5 min and washed with PBS. Cells were lysed in a lysis buffer (LB, 50 mM Tris, pH 7.5, 150 mM NaCl, 1% Triton X-100, 1 mM EDTA and 0.1 mM neocuproine) supplemented with a protease inhibitor cocktail (Sigma). After the removal of cell debris from the lysate, the resulting protein concentrations were measured using the bicinchoninic acid (BCA) method (Pierce, Rockford, IL, USA) and adjusted to 1 μg/μl with LB.
2.3. Transnitrosylation of SH-SY5Y proteins and BST
Freshly made SNO-Trx1 (100 μg) was used to transnitrosylate 1 mg SH-SY5Y protein extract in LB at 37 °C for 30 min in the dark. Similarly, GSNO nitrosylation was performed as a positive control, using an equimolar amount to that of SNO-Trx1 (~ 3 μg GSNO), and native Trx1 or buffer alone nitrosylation reactions were performed as negative controls. Following transnitrosylation treatment, proteins were precipitated with cold acetone, washed 3 times in cold acetone and processed by BST [26] as follows. Proteins (1 mg) were denatured in 1 ml LB buffer with 2.5% SDS (Bio-Rad), and free thiols were alkylated using 20 mM methyl methanethiosulfonate (MMTS) (Pierce) with frequent vortexing at 50 °C for 30 min. Excess MMTS was removed by cold acetone precipitation of the proteins. Protein pellets were reconstituted in HEN buffer (25 mM HEPES, pH 7.7, 1 mM EDTA and 0.1 mM neocuproine) containing 1% (w/v) SDS and adjusted to 1 μg/μl protein. Protein (600 μg) was labeled with 0.2 mM biotin-HPDP (Pierce, Rockford, IL, USA), or with 480 μg of either ICAT heavy (ICAT-H) or light (ICAT-L) reagent (AB SCIEX, Foster City, CA, USA), with or without 10 mM ascorbate, as indicated in the figures. The reaction mixture was incubated in the dark for 1 h at RT. Excess reagents were removed by precipitation and washing 3 times with cold acetone. The protein pellets were solubilized in non-reducing SDS-PAGE loading buffer (100 mM Tris, pH 6.8, 2% SDS, 15% glycerol, 0.01% bromophenol blue) for Western blotting or in 8 M urea and 1% Triton X-100 for trypsin digestion and avidin enrichment of biotinylated peptides as described below. For Western blotting, 15 μg of protein from each sample was separated using a non-reducing SDS-PAGE gel (in order to prevent the reduction and removal of biotin-HPDP by DTT) and transferred onto a nitrocellulose membrane. The biotinylated protein was probed with an anti-biotin antibody (1:3,000) (Vector Laboratories, Burlingame, CA, USA) and visualized with enhanced chemiluminescent substrate (PerkinElmer, Waltham, MA, USA).
For comparison of biotin-HPDP and ICAT approaches for the detection of SNO-peptides, SNO-Trx1 nitrosylated proteins were labeled with either biotin-HPDP or ICAT-H. Biotin-HPDP or ICAT-H labeled proteins (600 μg) were first solubilized in 60 μl 8 M urea and 1% Triton X-100, diluted 10-fold in 50 mM NH4HCO3 (pH 8.3), and then digested with trypsin (1:30 (w/w) enzyme:protein ratio) in NH4HCO3 at 37 °C overnight. Biotinylated peptides were enriched by an avidin column provided in the ICAT kit. After washing the cartridge to remove unmodified peptides with 2 ml of PBS (pH 7.2) and 1 ml of a solution containing 50 mM NH4HCO3 and 20% methanol (pH 8.3), the biotin-HPDP labeled peptides were eluted with 30% ACN and 0.4% trifluoroacetic acid (TFA), dried in a speed vac and resuspended in 2% ACN and 0.1% TFA to be analyzed by LC/MS/MS. ICAT-labeled peptides were eluted in an identical fashion and processed as described below.
2.4. Quantitative ICAT-H and -L labeling experiments
SNO-proteins were labeled with either light or heavy ICAT reagent following BST as described above, and three distinct ICAT quantitative experiments were performed. For the evaluation of the accuracy and precision of ICAT quantitative analysis of SNO-peptides, 300 μg of GSNO nitrosylated proteins was labeled with 240 μg of either ICAT-H or ICAT-L following MMTS block. For ICAT-based quantification of SNO-Trx1 transnitrosylated peptides, 300 μg SNO-Trx1 treated proteins was labeled with 240 μg ICAT-H, while buffer treated control proteins were labeled with 240 μg ICAT-L. For the identification of rTrx1 denitrosylation targets that were initially nitrosylated by SNO-Trx1, 300 μg SNO-Trx1 treated proteins was first incubated with 5 μM rTrx1, 100 nM TrxR and 200 μM NADPH in a total volume of 0.5 ml LB [22] at 37 °C for 30 min, and labeled with 240 μg ICAT-L during BST; an equal amount of SNO-Trx1 treated protein was labeled with 240 μg ICAT-H for comparison. Excess ICAT reagents were removed by ice-cold acetone precipitation and the protein pellets redissolved in 8 M urea and 1% Triton X-100. For each pair-wise comparison, the corresponding ICAT-H and ICAT-L labeled proteins were mixed at a 1:1 mass ratio, diluted 10-fold with 50 mM NH4HCO3 and subjected to tryptic digestions at a 30:1 protein/trypsin ratio. ICAT-labeled peptides were enriched by biotin affinity chromatography using an avidin column provided in the cleavable ICAT kit according to the manufacturer’s protocol. The ICAT-labeled peptides were eluted with 30% ACN and 0.4% TFA, dried in a speed vac. Removal of biotin moieties from the ICAT-conjugated peptides was carried out with TFA cleavage at 37 °C for 2 h. After cleavage, the eluted peptides were completely dried and desalted by C18 spin columns (Pierce, USA) and reconstituted in 5 μl of 5% ACN and 0.1% FA for LC/MS/MS analysis.
2.5. Affinity capture and detection of SNO-proteins
To enrich biotinylated proteins for Western blot analysis, proteins processed by BST were acetone precipitated and the pellets redissolved in RB. Protein concentrations were determined by the BCA method. The biotinylated proteins (400 μg) in 200 μl of RB were diluted with 200 μl of PBS and subsequently mixed with 20 μl of streptavidin-agarose beads (Pierce, Rockford, IL, USA). The mixture was incubated for 1 h at RT with agitation. After incubation, the beads were washed five times with 1 ml of PBS and incubated with 60 μl 2× SDS-PAGE loading buffer for 30 min at 37 °C with gentle agitation, followed by heating at 100 °C for 5 min. For Western blot detection of SNO-proteins, affinity-enriched biotinylated proteins were separated on 12.5% SDS-PAGE gels, and transferred onto nitrocellulose membrane. Membranes were blocked with 5% milk, then probed with either anti-Prx1 (ab15571, Abcam, Cambridge, MA, USA, 1:5,000), GAPDH (10R-G109a, Fitzgerald Industries International, Acton, MA, USA, 1:5,000), α-tubulin (ab15246, Abcam, Cambridge, MA, USA, 1:5,000), cyclophylin A (ab41684, Abcam, Cambridge, MA, USA, 1:5,000) or α-enolase (ENO1, ab85086, Abcam, Cambridge, MA, USA, 1:1,000) antibodies, and visualized by chemiluminescence.
2.6. Analysis of SNO-peptides by LC/MS/MS and bioinformatics analysis
For identification of SNO-peptides and locating their SNO-Cys residues, biotin-HPDP or ICAT-labeled peptides were enriched with an avidin cartridge as described above. For LC/MS/MS analysis, the biotinylated peptides were first separated by a Dionex UltiMate® 3000 reversed phase liquid chromatography system, using a PepMap 100C18 column (75 μM × 150 mm, 3 μM, 100 Å, Dionex, Sunnyvale, CA, USA). The LC-resolved peptides were analyzed using a Waters API-US QTOF MS system with a nano-ESI source (New Objectives, Boston, USA). MS spectra (m/z 400-1900) were acquired in the positive ion mode. Argon was used as the collision gas. The collision energy was set from 16 to 60 V, depending on the precursor ion charge state and mass. MS/MS spectra were acquired in the Data-Dependent Analysis mode, in which the three most abundant precursors with two to five charges from each MS survey scan were selected for fragmentation. Peak lists were generated by ProteinLynx (v2.1) into PKL files. Database searches were performed with Mascot (v2.2) against the human Swissprot protein database (containing 20,258 entries (for forward and reverse) 08/10/2010) using the following search parameters: trypsin was selected with 1 missed cleavage, mass tolerance of 200 ppm for MS and 0.6 Da for MS/MS, either biotin-HPDP, ICAT-C (ICAT-L) or ICAT-C:13C(9) (ICAT-H) - modified cysteines and methionine oxidation were set as variable modifications. For MS/MS identification of the peptides’ nitrosylation site, we set a Mascot score threshold of at least 29, which corresponded to a confidence interval of 95% or better; the matched spectra were also manually validated for the precise location of the PTMs. The frequency of false discovery rate (FDR) in LC/MS/MS analysis was evaluated with a target-decoy database search strategy [27], with all FDR values from the different experiments calculated to be ≤ 0.5%. SNO-peptides belonging to protein isoforms that are indistinguishable from the MS/MS spectra are listed in the supplemental tables (Tables S3 and S4) by their protein accession numbers. Protein isoforms with the most descriptive names, and that have been well characterized biochemically, are presented in Table 1 and Table 2 for discussion clarity.
Table 1. Peptides whose nitrosylation status is reversibly regulated by Trx1.
| Protein name | Swiss-Prot Identifier |
aPeptide | bN → C | SNO site |
cTrans- ratio |
dDe- ratio |
eReference |
|---|---|---|---|---|---|---|---|
| 40S ribosomal protein S4, X isoform |
RS4X | K.FDTGNLCMVTGGANLGR.I | 175–191 | 181 | 1.48 | 0.48 | |
| 40S ribosomal protein SA | RSSA | R.ADHQPLTEASYVNLPTIALCNTDSP LR.Y |
129–155 | 148 | 1.95 | 0.63 | |
| 40S ribosomal protein SA | RSSA | R.YVDIAIPCNNK.G | 156–166 | 163 | 1.85 | 0.65 | |
| 60S acidic ribosomal protein P1 | RLA1 | K.ALANVNIGSLICNVGAGGPAPAAG AAPAGGPAPSTAAAPAEEK.K |
50–92 | 61 | 2.36 | 0.49 | |
| ATP-dependent RNA helicase A | DHX9 | K.SSVNCPFSSQDMK.Y | 1025– 1037 |
1029 | 2.9 | 0.18 | |
| Cofilin-1* | COF1 | K.AVLFCLSEDKK.N | 35–45 | 39 | 3.04 | 0.59 | [22] |
| Cytoplasmic dynein 1 heavy chain 1 |
DYHC1 | K.TSAPITCELLNK.Q | 1993– 2004 |
1999 | 1.83 | 0.24 | |
| Dihydropyrimidinase-related protein 2 |
DPYL2 | R.GLYDGPVCEVSVTPK.T | 497–511 | 504 | 2.14 | 0.34 | |
| Dopamine beta-hydroxylase | DOPO | K.VISTLEEPTPQCPTSQGR.S | 585–602 | 596 | 2.58 | 0.68 | |
| Elongation factor 1-alpha 1* | EF1A1 | K.SGDAAIVDMVPGKPMCVESFSDY PPLGR.F* |
396–423 | 411 | 2.07 | 0.51 | [20], [36], [42], [43], [44] |
| Elongation factor 2* | EF2 | R.ETVSEESNVLCLSK.S* | 581–594 | 591 | 3.63 | 0.5 | [20], [42], [43], [45] |
| Eukaryotic translation initiation factor 5A-1 |
IF5A1 | K.KYEDICPSTHNMDVPNIK.R | 68–85 | 73 | 2.35 | 0.5 | |
| Far upstream element-binding protein 1 |
FUBP1 | R.SCMLTGTPESVQSAK.R | 147–161 | 148 | 2.89 | 0.59 | |
| Fascin | FSCN1 | R.LSCFAQTVSPAEK.W | 119–131 | 121 | 2.48 | 0.65 | |
| Filamin-A | FLNA | K.IVGPSGAAVPCK.V | 1008– 1019 |
1018 | 3.51 | 0.43 | |
| Galectin-1 | LEG1 | K.DSNNLCLHFNPR.F | 38–49 | 43 | 2.29 | 0.55 | |
| Glyceraldehyde-3-phosphate dehydrogenase* |
G3P | R.VPTANVSVVDLTCR.L* | 235–248 | 247 | 2.33 | 0.25 | [20], [31], [36], [42], [44], [45], [46], [47], [48], [49], [50], [51], [52] |
| Guanine nucleotide-binding protein G(I)/G(S)/G(T) subunit beta-1 |
GBB1 | R.LFVSGACDASAK.L | 198–209 | 204 | 1.3 | 0.23 | |
| Heterogeneous nuclear ribonucleoprotein H |
HNRH1 | R.DLNYCFSGMSDHR.Y | 263–275 | 267 | 1.76 | 0.22 | |
| Heterogeneous nuclear ribonucleoprotein H |
HNRH1 | R.YGDGGSTFQSTTGHCVHMR.G | 276–294 | 290 | 2.42 | 0.51 | |
| Heterogeneous nuclear ribonucleoprotein K |
HNRPK | K.GSDFDCELR.L | 140–148 | 145 | 2.97 | 0.54 | |
| Heterogeneous nuclear ribonucleoprotein L |
HNRPL | R.VFNVFCLYGNVEK.V | 399–411 | 404 | 2.17 | 0.33 | |
| Heterogeneous nuclear ribonucleoproteins A2/B1 |
ROA2 | K.LTDCVVMR.D | 47–54 | 50 | 4.57 | 0.48 | |
| High mobility group protein B1 | HMGB1 | K.MSSYAFFVQTCR.E | 13–24 | 23 | 3.08 | 0.33 | |
| High mobility group protein B1 | HMGB1 | K.RPPSAFFLFCSEYRPK.I | 97–112 | 106 | 2.43 | 0.39 | |
| L-lactate dehydrogenase A chain* | LDHA | R.VIGSGCNLDSAR.F* | 158–169 | 163 | 2.45 | 0.66 | [20] |
| Malate dehydrogenase, cytoplasmic |
MDHC | K.VIVVGNPANTNCLTASK.S | 126–142 | 137 | 3.04 | 0.43 | |
| Myosin light chain 6B | MYL6B | K.ILYSQCGDVMR.A | 84–94 | 89 | 2.11 | 0.2 | |
| Nucleoside diphosphate kinase B | NDKB | R.GDFCIQVGR.N | 106–114 | 109 | 3.09 | 0.61 | |
| Phosphoglycerate kinase 1* | PGK1 | K.ACANPAAGSVILLENLR.F* | 107–123 | 108 | 3.08 | 0.38 | [20] |
| Poly(rC)-binding protein 1* | PCBP1 | R.INISEGNCPER.I* | 47–57 | 54 | 3.61 | 0.58 | [20], [31], [36], [44] |
| Prostaglandin E synthase 4 | TEBP | K.LTFSCLGGSDNFK.H | 36–48 | 40 | 2.69 | 0.76 | |
| Pyruvate kinase isozymes M1/M3* |
KPYM | R.NTGIICTIGPASR.S* | 44–56 | 49 | 2.54 | 0.77 | [20], [31] |
| Serine/arginine-rich splicing factor 1 |
SRSF1 | R.EAGDVCYADVYR.D | 143–154 | 148 | 2.24 | 0.74 | |
| Small glutamine-rich tetratricopeptide repeat-containing protein alpha |
SGTA | K.AIELNPANAVYFCNR.A | 117–131 | 129 | 1.37 | 0.65 | |
| T-complex protein 1 subunit gamma |
TCPG | R.TLIQNCGASTIR.L | 450–461 | 455 | 1.77 | 0.75 | |
| Triosephosphate isomerase | TPIS | R.IIYGGSVTGATCK.E | 207–219 | 218 | 2.26 | 0.48 | |
| Tubulin alpha-1A chain* | TBA1A | R.TIQFVDWCPTGFK.V | 340–352 | 347 | 2.28 | 0.77 | [20], [31], [36], [42], [45], [46], [53] |
| Tubulin alpha-1B chain* | TBA1B | R.SIQFVDWCPTGFK.V* | 340–352 | 347 | 1.96 | 0.64 | [20], [31], [36], [42], [45], [46], [53] |
| Tubulin beta-2A chain* | TBB2A | K.LTTPTYGDLNHLVSATMSGVTTCL R.F |
217–241 | 239 | 2.24 | 0.53 | [20], [31], [45], [46], [53], [54] |
| Tubulin beta-2A chain* | TBB2A | R.EIVHIQAGQCGNQIGAK.F | 3–19 | 12 | 3.36 | 0.43 | [20], [31], [45], [46], [53], [54] |
| Ubiquitin carboxyl-terminal hydrolase isozyme L1 |
UCHL1 | K.NEAIQAAHDAVAQEGQCR.V | 136–153 | 152 | 2.29 | 0.56 | |
| Voltage-dependent anion- selective channel protein 1 |
VDAC1 | K.YQIDPDACFSAK.V | 225–236 | 232 | 3.1 | 0.51 |
Asterisks denote whether the protein or peptide or both were previously reported.
Peptide identified by MS/MS. SNO-Cys site is underlined.
Amino acid sequence number of the identified peptide in the N to C terminus direction.
ICAT ratio of SNO-Trx1 transnitrosylation (H/L), a ratio of > 1.22 is considered to be a SNO-Trx1 transnitrosylation target.
ICAT ratio of rTrx1 denitrosylation (L/H), a ratio of < 0.78 is considered to be an rTrx1 denitrosylation target.
Previous documentation of the protein/peptide as a Trx1 trans- or denitrosylation target.
Table 2. SNO-Trx1 transnitrosylation target peptides that cannot be reduced by rTrx1.
| Protein name | Swiss-Prot Identifier |
aPeptide | bN → C | SNO site |
cTrans- ratio |
dDe- ratio |
eReference |
|---|---|---|---|---|---|---|---|
| 60S ribosomal protein L12 | RL12 | R.CTGGEVGATSALAPK.I | 17–31 | 17 | 1.88 | 0.8 | |
| 60S ribosomal protein L12 | RL12 | K.EILGTAQSVGCNVDGR.H | 131–146 | 141 | 1.97 | 1.02 | |
| 60S acidic ribosomal protein P0- like |
RLA0L | R.AGAIAPCEVTVPAQNTGLGPEK.T | 113–134 | 119 | 3.09 | 0.91 | |
| Alpha-enolase* | ENOA | K.VNQIGSVTESIQACK.L* | 344–358 | 357 | 2.09 | 0.94 | [20], [31], [42], [44] |
| Heat shock cognate 71 kDa protein |
HSP7C | K.GPAVGIDLGTTYSCVGVFQHGK.V | 4–25 | 17 | 2.33 | 0.78 | |
| Peptidyl-prolyl cis-trans isomerase A* |
PPIA | K.KITIADCGQLE.-* | 155–165 | 161 | 2.04 | 0.98 | [20], [22] |
| Peptidyl-prolyl cis-trans isomerase A* |
PPIA | R.IIPGFMCQGGDFTR.H* | 56–69 | 62 | 2.43 | 0.9 | [20], [22] |
| Peroxiredoxin-1* | PRDX1 | K.HGEVCPAGWKPGSDTIKPDVQK.S* | 169–190 | 173 | 2.99 | 1 | [20], [31], [36], [51] |
Asterisks denote whether the protein or peptide or both were previously reported.
Peptide identified by MS/MS. SNO-Cys site is underlined.
Amino acid sequence number of the identified peptide in the N to C terminus direction.
ICAT ratio of SNO-Trx1 transnitrosylation (H/L), a ratio of > 1.22 is considered to be a SNO-Trx1 transnitrosylation target.
ICAT ratio of rTrx1 denitrosylation (L/H), a ratio of < 0.78 is considered to be an rTrx1 denitrosylation target.
Previous documentation of the protein/peptide as a Trx1 trans- or denitrosylation target.
2.7. Quantitative analysis
Once an ICAT-L or ICAT-H labeled peptide was identified by Mascot search, the ion chromatograms for the corresponding ICAT pair m/z values with the same peptide charge states and retention times were extracted and integrated manually using MassLynx (Waters). Integrated peak areas were used to calculate the relative ratios between ICAT-H and ICAT-L labeled peptides. Only peptide ICAT pairs found in at least two out of three full reaction repeats are listed in Tables S3 and S4.
2.8. Data analysis
Quantitative data are expressed as mean ± standard error (SEM). Statistical analysis was performed using two-tailed unpaired Student’s t-test with Microsoft Excel. Differences were considered significant for P < 0.05. Venn diagram areas are proportionate to the number of peptides identified and were constructed in Microsoft Powerpoint. The box plot in Fig. 2D was constructed in Microsoft Excel using ICAT-H/ICAT-L ratios for 44 (22 pairs of ICAT-H and -L labeled) peptides identified in 3 repeat GSNO transnitrosylation experiments. ICAT ratios beyond two standard deviations from the sample mean obtained from the GSNO transnitrosylation experiment were considered significant changes in subsequent peptide nitrosylation state studies. The LC/MS/MS peak lists are included with the manuscript as a supplemental files, and the raw data associated with this manuscript may be downloaded from http://njms.umdnj.edu/proweb/research.cfm.
Fig. 2. Comparison of biotin-HPDP and ICAT labeling for detection of SNO-proteins and peptides.
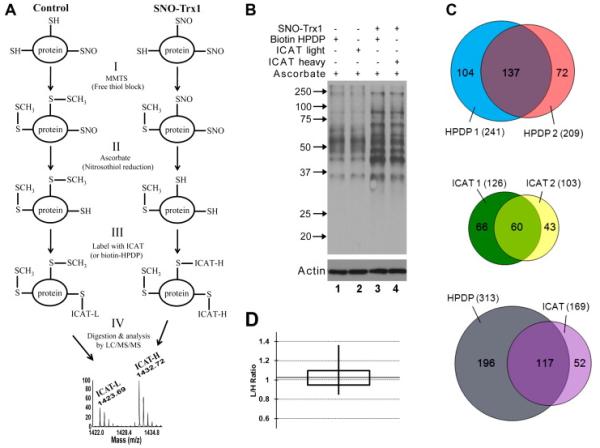
(A) Schematic of ICAT-based quantitative proteomics of SNO-Trx1 target proteins. Following incubation of cellular proteins without (control) or with SNO-Trx1, protein SNO-Cys sites are preserved by BST: (I) free thiols are alkylated with methylmethanethiosulfonate (MMTS). (II) Nitrosylated residues are reduced by ascorbate. (III) Nascent free thiols are labeled by a thiol reactive biotin-containing reagent. In this example, SNO-Trx1 treated sample is labeled with ICAT-H, while untreated sample is labeled with ICAT-L. (IV) Labeled samples are combined, proteolytically digested, and their SNO-Cys sites determined and quantified by LC/MS/MS analysis of ICAT-labeled peptides. (B) Comparison of biotin-HPDP and ICAT detection specificity. SH-SY5Y cell lysate was in vitro transnitrosylated by incubation with SNO-Trx1. Resultant SNO-proteins were modified by BST using biotin-HPDP or ICAT-L or -H reagent, resolved by non-reducing SDS-PAGE and detected by Western blotting with an anti-biotin antibody (top panel). Protein levels were normalized to actin (bottom panel). (C) Comparison of biotin-HPDP and ICAT-H for identification of SNO-Trx1 derivated SNO-peptide nitrosylation sites. Biotinylated proteins from B (SNO-Trx1 treated) were trypsin digested, enriched by avidin column, the ICAT-H biotin tether cleaved and eluted peptides detected by LC/MS/MS. Venn diagrams show the reproducibility of detecting biotin-HPDP labeled (top) or ICAT-H labeled (middle) peptides from 2 whole reaction repeats. Bottom: Venn diagram compares the commonality of total peptides detected from biotin-HPDP labeling experiments with ICAT-H labeling experiments. Total number of labeled peptides detected in each experiment is in parentheses and are listed in Table S1. 353 peptides were enriched after biotin-HPDP labeling, 40 peptides were unlabeled (11.3%), including 39 peptides without Cys. 243 peptides were enriched after ICAT labeling, 74 peptides were unlabeled (30.5%), including 64 peptides without Cys. (D) Evaluation of ICAT SNO-peptide quantification statistics. SH-SY5Y cell lysate was incubated with GSNO, then divided equally and labeled by BST using light or heavy ICAT reagent. After tryptic digest, ICAT samples were combined 1:1 and biotinylated peptides detected by LC/MS/MS. A box plot is shown of the ICAT light/heavy ratio of 22 ICAT-labeled peptide pairs averaged among the 3 whole reaction repeats (listed in Table S2 and reproducibility illustrated in Fig. S3). Solid horizontal line indicates the median, vertical lines the maximum and minimum, and the box represents the middle 50% of the data.
3. Results and discussion
3.1. ICAT is an effective biotin switch reagent for the detection of SNO-Cys
S-Nitrosylation is a dynamic modification and accurate quantification of its extent at a particular cysteine is therefore essential to understanding the influence of this PTM on protein function. However, the labile nature of NO modification has created a unique challenge for the identification of SNO-Cys sites by MS methods [25]. SNO-peptides are rarely observed in MALDI-TOF MS spectra, as NO usually dissociates during ionization. Under very gentle ESI conditions, SNO-peptides have been observed as a 29 Da mass increase (+ NO and −H) of the unmodified peptide ion for each SNO-Cys site [25] and [28]. Furthermore, the localization of SNO-Cys in peptides containing multiple cysteines is still problematic, given that S-NO bonds are usually more easily fragmented in MS/MS analysis than is the peptide backbone [29]. A BST method has been developed [26], in which SNO-Cys is converted into a more stable biotinylated form, and can be detected by both MS and MS/MS methods, either with MALDI or ESI [30] and [31]. The BST method involves three steps: free cysteine thiols are alkylated with MMTS, nitrosylated cysteines are reduced by ascorbate without also reducing disulfide bonds or other oxidative cysteine PTMs, and newly-exposed cysteine thiols are alkylated classically by biotin-HPDP (Fig. 2A). However, other alkylating reagents have been employed to good effect, such as ICAT [23] and [32]. ICAT includes an isotope-coded segment containing different C12 (light) or C13 (heavy) carbons, advantageously allowing the accurate MS quantification and comparison of SNO-peptides from two samples by their mass difference of 9 amu (Fig. 2A). Labeling with ICAT reagent provides a means to accurately quantify the extent of S-nitrosylation, but this is an unorthodox BST reagent and therefore its specificity must first be compared to that of a standard labeling reagent such as biotin-HPDP. We applied SNO-Trx1 to SH-SY5Y cell lysates then performed BST on nascent SNO-Cys sites, labeling with either biotin-HPDP or light or heavy ICAT reagent. Proteins were then resolved by SDS-PAGE and SNO-proteins detected by Western blot with an anti-biotin antibody. Ascorbate treatment can produce background artifacts [33], therefore we performed a number of controls in the absence and presence of ascorbate (Fig. S1A and B). Without ascorbate reduction and a transnitrosylating agent, SNO-Cys sites were not biotinylated and hence no labeled proteins were detected (Fig. S1A, lanes 1 and 2). Upon ascorbate reduction, but again without transnitrosylating agent, biotinylated bands were observed (Fig. 2, lanes 1 and 2; Fig. S1B, lanes 5 and 6), possibly indicating endogenous SNO-proteins within the extract. Incubation with SNO-Trx1 or GSNO in the absence of ascorbate reduction produced weak biotinylated bands (Fig. S1B, lanes 2 and 3), while a marked increase in biotinylation was observed after ascorbate reduction (Fig. 2B, lanes 3 and 4; Fig. S1B, lanes 7 and 8), indicating transnitrosylation of proteins by these exogenous NO donors. GSNO treatment gave a comparable increase in biotinylation to that of SNO-Trx1 (Fig. S1B, compare lanes 7 and 8), while treatment with unmodified Trx1 did not appear to affect biotinylation (Fig. S1B). Furthermore, the biotinylated band pattern for both biotin-HPDP and heavy ICAT-labeled proteins appeared similar and their extent comparable (Fig. 2B), albeit with marginally higher labeling with biotin-HPDP (Fig. S1C), suggesting ICAT and biotin-HPDP have similar selectivity towards ascorbate-reduced SNO-Cys.
To further assess the specificity of BST reagent labeling, SNO-Trx1 treated lysate was digested with trypsin, biotinylated peptides were enriched by avidin column capture, and after direct elution of biotin-HPDP labeled peptides or biotin cleavage of ICAT-conjugated peptides, former SNO-Cys sites were identified by LC/MS/MS (Table S1). Over 200 HPDP-labeled peptides were typically identified, with an average experimental reproducibility of ~ 60% (Fig. 2C, top Venn diagram). In comparison, less ICAT-labeled peptides were typically detected (~ 114), with an average experimental reproducibility of ~ 52% (Fig. 2C middle Venn diagram). However, the Trx1 peptide 73-CMPTFQFFK-81 was found to be ICAT-H labeled on Cys73, confirming previous reports (Fig. S2) [18], [19], [20] and [25]. Despite apparent reduced labeling sensitivity, > 69% of SNO-Cys sites labeled by ICAT were found by biotin-HPDP labeling (Fig. 2C, lower Venn diagram; Table S1), a better overlap than the reproducibility of repeat HPDP- or ICAT-labeled peptide detection. Thus, the two BST labeling reagents have comparable specificity for SNO-Trx1 target sites, and ICAT reagent would appear to be an acceptable substitute for biotin-HPDP. The reason for reduced SNO-Cys detection sensitivity may be due to the fact that ICAT reagents are larger and more hydrophobic than biotin-HPDP; therefore, they likely encounter more hindrance when accessing SNO-Cys sites distributed within protein 3D structures, given the fact that the protein disulfides are typically not reduced prior to ICAT or biotin-HPDP modification.
To determine the accuracy of ICAT quantification in our LC/MS/MS system, we applied the NO donor GSNO to SH-SY5Y lysates to produce SNO-proteins. Treated lysate was divided in half and labeled via BST with either light or heavy ICAT reagent. The two differentially labeled lysates were then recombined in a 1:1 ratio, trypsin digested and biotinylated peptides enriched by an avidin column. After elution from avidin, and TFA cleavage of biotin, ICAT-peptides were detected and quantified by LC/MS/MS. Since the levels of S-nitrosylation in each lysate half were the same, the expected ratio of light/heavy ICAT was one. Mascot-identified peptides (Table S2) had a median ICAT ratio of 1.02, a standard deviation of 0.11 and a middle 50% distribution of 0.95-1.09 (Fig. 2D), validating the quantitative accuracy of this analytical method for SNO-peptide quantification in our hands. The experimental reproducibility of the identified peptides is illustrated in Fig. S3. This analysis also established a statistical benchmark of < 0.78 or > 1.22 ICAT fold change to be statistically significant at 95% confidence interval for the determination of protein denitrosylation or transnitrosylation, respectively, as outlined below. However, it should be noted that subsequent ICAT analyses serve to indicate relative change, but should not be considered a measure of the absolute value in SNO-Cys site occupation status.
3.2. Discerning Trx1 transnitrosylation from denitrosylation targets by ICAT
A number of studies have identified Trx1 transnitrosylation [19] and [20] and denitrosylation targets [11], [12], [22], [34] and [35], but no one study has attempted to simultaneously identify and compare the targets of these opposed functions. This is an important exercise as recent evidence suggests that transnitrosylation target sites may well be different from denitrosylation sites: Stamler’s group demonstrated that Trx1 is unable to denitrosylate the key antioxidant enzyme peroxiredoxin 1 (Prx1) [22], whereas we find Prx1 to be transnitrosylated by SNO-Trx1 [20]. By extension, the degree of overlap between denitrosylation and transnitrosylation targets for Trx1 remains uncertain. To discern Trx1 transnitrosylation targets from denitrosylation targets, we first treated SH-SY5Y cell lysate with SNO-Trx1, and a portion of the transnitrosylated lysate was subsequently denitrosylated by incubation with the thioredoxin reductive system [22]. Previously, we discovered that both SNO-Trx1 and some of its nitrosylated targets can be denitrosylated by rTrx1, the active product of the thioredoxin reductive system [20]. Lysates then underwent BST processing, labeling transnitrosylated proteins with ICAT-H and buffer treated or denitrosylated proteins with ICAT-L. Proteins were resolved in reducing SDS-PAGE and Western blotted for biotinylated protein (Fig. 3). Consistent with Fig. 2A, incubation with SNO-Trx1 resulted in increased protein biotinylation over control treatment, hence S-nitrosylation; while SNO-Trx1 treatment followed by incubation with the Trx reductive system resulted in the reduction of some, but not all biotinylated protein bands (Fig. 3). This result strongly suggests that rTrx1 can denitrosylate some, but not all of SNO-Trx1 transnitrosylation targets.
Fig. 3. In vitro Trx1 transnitrosylation and denitrosylation.
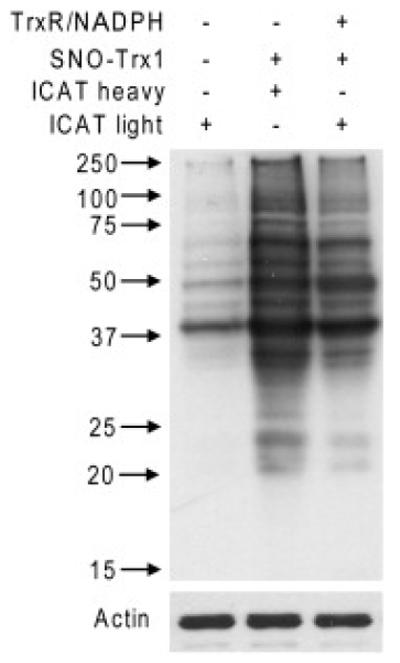
SH-SY5Y cell lysate was incubated with or without SNO-Trx1. Lysate treated with SNO-Trx1 was then incubated with or without the Trx reductive system. SNO-proteins in extract treated with SNO-Trx1 were labeled with ICAT-H, while untreated or those treated additionally with the thioredoxin reductive system were each labeled with ICAT-L. Proteins were then resolved by reducing SDS-PAGE and biotinylated proteins detected by Western blot with an anti-biotin antibody.
The two distinct sets of ICAT experiments described above were used to identify in vitro targets of SNO-Trx1 transnitrosylation and rTrx1 denitrosylation by LC/MS/MS analysis. Accordingly, when comparing buffer versus SNO-Trx1 treated proteins, a higher ICAT-H over ICAT-L labeled MS peaks measured the degree of SNO-Trx1 transnitrosylation of a specific cysteine in a peptide (see examples in Fig. 4A and B, transnitrosylation). MS/MS analysis of either ICAT-L or H-labeled peptide ion facilitated the mapping of the SNO-Cys (Fig. 4, Cys247 in GAPDH and Cys357 in ENOA). Cysteines most prone to SNO-Trx1 transnitrosylation were Cys60 of 40S ribosomal protein S11 (ICAT-H/L of 9.71) and Cys50 of heterogeneous nuclear ribonucleoprotein A2/B1 (H/L of 4.57) (Table S3). By comparison, for the rTrx1 denitrosylation reactions, a lower ICAT-L over ICAT-H labeled MS peak measured the degree of rTrx1 denitrosylation of a SNO-Cys site in a peptide (see an example in Fig. 4A, denitrosylation). MS/MS analysis of either ICAT-L or H-labeled peptide ion facilitated the mapping of the SNO-Cys sensitive to rTrx1 denitrosylation. An interesting example is shown in Fig. 4B, where Cys357 of α-enolase (ENOA_HUMAN) can be nitrosylated by SNO-Trx1, but not denitrosylated by rTrx1 (Fig. 4B, denitrosylation). Cysteines most prone to rTrx1 denitrosylation were Cys1029 of ATP-dependent RNA helicase A (ICAT L/H of 0.18) and Cys89 of myosin light chain 6B (ICAT L/H of 0.20) (Table S4). Overall, 76 putative SNO-Trx1 transnitrosylation sites (ICAT-H/L > 1.22) were identified reproducibly in at least two experimental repeats (Table S3), and 50 putative rTrx1 denitrosylation SNO-Cys (ICAT L/H < 0.78) were reproducibly identified (Table S4). To our surprise, over half the SNO-peptides detected (containing 43 SNO-Cys sites) are reversibly regulated by Trx1-mediated trans- and denitrosylation (Table 1), indicating that Trx1 is an important regulator of nitrosylation status of more proteins than was previously thought. Many of these proteins were previously reported to be either transnitrosylated or denitrosylated by Trx1 (and related oxidoreductases) in vivo (Table 1), supporting the effectiveness of the current in vitro approach. Our observation suggests that this 12 kDa protein may be sufficiently flexible in order for both its Cys32/Cys35- and SNO-Cys73-containing domains to access target SNO-Cys/Cys-SH, and function as either a de- or transnitrosylase.
Fig. 4. Identification and quantification of Trx1 target SNO-peptides.

Example MS and MS/MS spectra of (A) GAPDH 235-VPTANVSVVDLTC*R-248 (M2+ 855.45, C : ICAT-label site identified in the upper panel MS/MS spectrum ) and (B) ΕΝΟΑ 344-VNQIGSVTESIQAC*K-358 (M2+ 907.01, sequence identified in the upper panel MS/MS spectrum). Cys247 of GAPDH was transnitrosylated by SNO-Trx1 and denitrosylated by rTrx1/TrxR (A, compare ICAT-H and -L peaks in the lower panel MS spectra), while Cys357 of α-enolase was transnitrosylated by SNO-Trx1 but not denitrosylated by Trx1/TrxR (B, compare ICAT-H and -L peaks in the lower panel MS spectra).
The results from this study also highlight the advantage of quantitative approaches over qualitative methods, such as SNO-Site Identification (SNOSID [31]), which rely on identifying proteins with dramatically elevated S-nitrosylation. Exclusion of a SNO-peptide from downstream biological studies simply because it is found in the control, may miss important regulatory events whose function is manifested by quantitative changes in SNO-peptide level. Therefore, we believe that the ICAT method described here, and iTRAQ and SILAC methods used by others [22] and [36], as well as the MRM method [37], will provide crucial quantitative information, and possibly stoichiometry or site-occupancy information, essential to understanding the function of regulated nitrosylation in diverse biological systems.
Equally as important is our discovery of 8 Cys/SNO-Cys that are transnitrosylated by SNO-Trx1 but not denitrosylated by rTrx1 (Table 2). One example is Prx1, whose disulfide reduction by Trx1 is important for the maintenance of its peroxidase activity [38]. We have previously reported that Prx1 Cys173 can be transnitrosylated by SNO-Trx1 both in vitro and in vivo[20]. More recently, Benhar et al. reported that this protein cannot be denitrosylated by the Trx1 system [22]. We confirmed this characteristic of Prx1 in the ICAT proteomics study (Table 2 and Fig. 5), validating the effectiveness of this technique for quantifying changes of SNO-peptides. In addition to Prx1 and α-enolase (Fig. 4B), both PPIA, commonly known as cyclophilin A, and RL12 each have two SNO-Trx1 transnitrosylation sites that are not amenable to rTrx1 denitrosylation (Table 2). HSP7C and RLA0L each has one SNO-Cys that cannot be denitrosylated by rTrx1. Interestingly, both α-enolase and PPIA have previously been reported to be denitrosylated by rTrx1 and related systems [22], in cells incubated with TrxR inhibitors. This apparent conflict with our results suggests that these proteins may actually be misclassified SNO-Trx1 transnitrosylation targets. Alternatively, these SNO-proteins could be resistant to denitrosylation at the rTrx1 concentration used in this study, and might be denitrosylated at higher rTrx1 concentrations. ICAT and related quantitative proteomics methods will likely be useful for further clarification of these interesting possibilities in different experimental systems.
Fig. 5. Western blot analysis of protein S-nitrosylation status.

Biotinylated proteins were enriched by avidin affinity capture, resolved by SDS-PAGE and Western blotted for formerly nitrosylated α-tubulin, GAPDH, Prx1, cyclophilin A and α-enolase. Values are the mean ± S.E. for experiments performed in triplicate (*, p = 0.0005; **, p = 0.001; †, p = 0.0006; ‡, p = 0.0001; #, p = 0.0003; §, p = 0.002; ¶, p = 0.0006; Student’s t-test). Total proteins were analyzed in parallel to detect proteins in cell lysates regardless of their nitrosylation status.
3.3. Western blotting validation of select proteins
We further validated the changes in protein nitrosylation status due to SNO-Trx1 transnitrosylation or rTrx1 denitrosylation using Western blotting of avidin-enriched proteins following BST. Similar to ICAT quantification, Western blotting revealed that both α-tubulin and GAPDH are sensitive to both SNO-Trx1 transnitrosylation and rTrx1 denitrosylation; while Prx1, PPIA (cyclophilin A) and α-enolase (ENOA) are only SNO-Trx1 transnitrosylation targets, not rTrx1 denitrosylation targets (Fig. 5).
4. Conclusions
NO plays many roles in different cells, including the nervous system [39]. It can influence neuronal cell survival and proliferation and have lasting effects on synaptic plasticity and memory formation through regulation of a diverse array of proteins including transcription factors, such as the cAMP-response element-binding protein, c-Myc [40] and PTEN phosphatase [41]. In this study, we used an ICAT-based quantitative proteomics approach to identify neuroblastoma cell proteins that are either Trx1-mediated transnitrosylation or denitrosylation targets, and quantify the extent of nitrosylation changes within specific SNO-Cys-containing peptides. Our observations have provided clear evidence that Trx1 is a versatile regulator of the reversible nitrosylation status of many proteins, despite it using different transnitrosylation (SNO-Cys73 containing) and denitrosylation (Cys32 and Cys35-containing) domains to catalyze these reactions. More importantly, we produce strong evidence that not all SNO-Trx1 target cysteines can be denitrosylated by rTrx1. Use of the experimental approach described in this study in other cell and biological systems will likely provide a more comprehensive understanding of the precise role of Trx1 in regulating specific protein nitrosylation.
Supplementary Material
Acknowledgements
The authors are grateful for funding support from NIH grant NS046593 to H.L for the continued support of a NINDS NeuroProteomics Core Facility at UMDNJ-New Jersey Medical School.
References
- [1].Furchgott RF, Zawadzki JV. The obligatory role of endothelial cells in the relaxation of arterial smooth muscle by acetylcholine. Nature. 1980;288:373–376. doi: 10.1038/288373a0. [DOI] [PubMed] [Google Scholar]
- [2].Gao Y. The multiple actions of NO. Pflugers Arch. 2010;459:829–839. doi: 10.1007/s00424-009-0773-9. [DOI] [PubMed] [Google Scholar]
- [3].Foster MW, Hess DT, Stamler JS. Protein S-nitrosylation in health and disease: a current perspective. Trends Mol Med. 2009;15:391–404. doi: 10.1016/j.molmed.2009.06.007. [DOI] [PMC free article] [PubMed] [Google Scholar]
- [4].Derakhshan B, Hao G, Gross SS. Balancing reactivity against selectivity: the evolution of protein S-nitrosylation as an effector of cell signaling by nitric oxide. Cardiovasc Res. 2007;75:210–219. doi: 10.1016/j.cardiores.2007.04.023. [DOI] [PMC free article] [PubMed] [Google Scholar]
- [5].Lipton SA, Choi YB, Takahashi H, Zhang D, Li W, Godzik A, et al. Cysteine regulation of protein function—as exemplified by NMDA-receptor modulation. Trends Neurosci. 2002;25:474–480. doi: 10.1016/s0166-2236(02)02245-2. [DOI] [PubMed] [Google Scholar]
- [6].Chen YY, Huang YF, Khoo KH, Meng TC. Mass spectrometry-based analyses for identifying and characterizing S-nitrosylation of protein tyrosine phosphatases. Methods. 2007;42:243–249. doi: 10.1016/j.ymeth.2007.03.002. [DOI] [PubMed] [Google Scholar]
- [7].Weerapana E, Wang C, Simon GM, Richter F, Khare S, Dillon MB, et al. Quantitative reactivity profiling predicts functional cysteines in proteomes. Nature. 2010;468:790–795. doi: 10.1038/nature09472. [DOI] [PMC free article] [PubMed] [Google Scholar]
- [8].Holmgren A. Thioredoxin and glutaredoxin systems. J Biol Chem. 1989;264:13963–13966. [PubMed] [Google Scholar]
- [9].Wu C, Parrott AM, Fu C, Liu T, Marino SM, Gladyshev VN, et al. Thioredoxin 1-mediated post-translational modifications: reduction, transnitrosylation, denitrosylation and related proteomics methodologies. Antioxid Redox Signal. 2011 doi: 10.1089/ars.2010.3831. [DOI] [PMC free article] [PubMed] [Google Scholar]
- [10].Benhar M, Forrester MT, Stamler JS. Protein denitrosylation: enzymatic mechanisms and cellular functions. Nat Rev Mol Cell Biol. 2009;10:721–732. doi: 10.1038/nrm2764. [DOI] [PubMed] [Google Scholar]
- [11].Sengupta R, Ryter SW, Zuckerbraun BS, Tzeng E, Billiar TR, Stoyanovsky DA. Thioredoxin catalyzes the denitrosation of low-molecular mass and protein S-nitrosothiols. Biochemistry. 2007;46:8472–8483. doi: 10.1021/bi700449x. [DOI] [PubMed] [Google Scholar]
- [12].Benhar M, Forrester MT, Hess DT, Stamler JS. Regulated protein denitrosylation by cytosolic and mitochondrial thioredoxins. Science. 2008;320:1050–1054. doi: 10.1126/science.1158265. [DOI] [PMC free article] [PubMed] [Google Scholar]
- [13].Holmgren A. Thioredoxin. Annu Rev Biochem. 1985;54:237–271. doi: 10.1146/annurev.bi.54.070185.001321. [DOI] [PubMed] [Google Scholar]
- [14].Casagrande S, Bonetto V, Fratelli M, Gianazza E, Eberini I, Massignan T, et al. Glutathionylation of human thioredoxin: a possible crosstalk between the glutathione and thioredoxin systems. Proc Natl Acad Sci USA. 2002;99:9745–9749. doi: 10.1073/pnas.152168599. [DOI] [PMC free article] [PubMed] [Google Scholar]
- [15].Haendeler J, Hoffmann J, Tischler V, Berk BC, Zeiher AM, Dimmeler S. Redox regulatory and anti-apoptotic functions of thioredoxin depend on S-nitrosylation at cysteine 69. Nat Cell Biol. 2002;4:743–749. doi: 10.1038/ncb851. [DOI] [PubMed] [Google Scholar]
- [16].Mitchell DA, Morton SU, Fernhoff NB, Marletta MA. Thioredoxin is required for S-nitrosation of procaspase-3 and the inhibition of apoptosis in Jurkat cells. Proc Natl Acad Sci USA. 2007;104:11609–11614. doi: 10.1073/pnas.0704898104. [DOI] [PMC free article] [PubMed] [Google Scholar]
- [17].Weichsel A, Brailey JL, Montfort WR. Buried S-nitrosocysteine revealed in crystal structures of human thioredoxin. Biochemistry. 2007;46:1219–1227. doi: 10.1021/bi061878r. [DOI] [PubMed] [Google Scholar]
- [18].Hashemy SI, Holmgren A. Regulation of the catalytic activity and structure of human thioredoxin 1 via oxidation and S-nitrosylation of cysteine residues. J Biol Chem. 2008;283:21890–21898. doi: 10.1074/jbc.M801047200. [DOI] [PubMed] [Google Scholar]
- [19].Mitchell DA, Marletta MA. Thioredoxin catalyzes the S-nitrosation of the caspase-3 active site cysteine. Nat Chem Biol. 2005;1:154–158. doi: 10.1038/nchembio720. [DOI] [PubMed] [Google Scholar]
- [20].Wu C, Liu T, Chen W, Oka S, Fu C, Jain MR, et al. Redox regulatory mechanism of transnitrosylation by thioredoxin. Mol Cell Proteomics. 2010;9:2262–2275. doi: 10.1074/mcp.M110.000034. [DOI] [PMC free article] [PubMed] [Google Scholar]
- [21].Gallegos A, Gasdaska JR, Taylor CW, Paine-Murrieta GD, Goodman D, Gasdaska PY, et al. Transfection with human thioredoxin increases cell proliferation and a dominant-negative mutant thioredoxin reverses the transformed phenotype of human breast cancer cells. Cancer Res. 1996;56:5765–5770. [PubMed] [Google Scholar]
- [22].Benhar M, Thompson JW, Moseley MA, Stamler JS. Identification of s-nitrosylated targets of thioredoxin using a quantitative proteomic approach. Biochemistry. 2010;49:6963–6969. doi: 10.1021/bi100619k. [DOI] [PMC free article] [PubMed] [Google Scholar]
- [23].Zhang X, Huang B, Zhou X, Chen C. Quantitative proteomic analysis of S-nitrosated proteins in diabetic mouse liver with ICAT switch method. Protein Cell. 2010;1:675–687. doi: 10.1007/s13238-010-0087-x. [DOI] [PMC free article] [PubMed] [Google Scholar]
- [24].Zhang J, Yan H, Wu YP, Li C, Zhang GY. Activation of GluR6-containing kainate receptors induces ubiquitin-dependent Bcl-2 degradation via S-denitrosylation in the rat hippocampus after kainate treatment. J Biol Chem. 2010;286:7669–7680. doi: 10.1074/jbc.M110.156299. [DOI] [PMC free article] [PubMed] [Google Scholar]
- [25].Wang Y, Liu T, Wu C, Li H. A strategy for direct identification of protein S-nitrosylation sites by quadrupole time-of-flight mass spectrometry. J Am Soc Mass Spectrom. 2008;19:1353–1360. doi: 10.1016/j.jasms.2008.06.001. [DOI] [PMC free article] [PubMed] [Google Scholar]
- [26].Jaffrey SR, Snyder SH. The biotin switch method for the detection of S-nitrosylated proteins. Sci STKE. 2001:11. doi: 10.1126/stke.2001.86.pl1. [DOI] [PubMed] [Google Scholar]
- [27].Peng J, Elias JE, Thoreen CC, Licklider LJ, Gygi SP. Evaluation of multidimensional chromatography coupled with tandem mass spectrometry (LC/LC-MS/MS) for large-scale protein analysis: the yeast proteome. J Proteome Res. 2003;2:43–50. doi: 10.1021/pr025556v. [DOI] [PubMed] [Google Scholar]
- [28].Lee SJ, Lee JR, Kim YH, Park YS, Park SI, Park HS, et al. Investigation of tyrosine nitration and nitrosylation of angiotensin II and bovine serum albumin with electrospray ionization mass spectrometry. Rapid Commun Mass Spectrom. 2007;21:2797–2804. doi: 10.1002/rcm.3145. [DOI] [PubMed] [Google Scholar]
- [29].Knipp M, Braun O, Gehrig PM, Sack R, Vasak M. Zn(II)-free dimethylargininase-1 (DDAH-1) is inhibited upon specific Cys-S-nitrosylation. J Biol Chem. 2003;278:3410–3416. doi: 10.1074/jbc.M209088200. [DOI] [PubMed] [Google Scholar]
- [30].Mitchell DA, Erwin PA, Michel T, Marletta MA. S-Nitrosation and regulation of inducible nitric oxide synthase. Biochemistry. 2005;44:4636–4647. doi: 10.1021/bi0474463. [DOI] [PubMed] [Google Scholar]
- [31].Hao G, Derakhshan B, Shi L, Campagne F, Gross SS. SNOSID, a proteomic method for identification of cysteine S-nitrosylation sites in complex protein mixtures. Proc Natl Acad Sci USA. 2006;103:1012–1017. doi: 10.1073/pnas.0508412103. [DOI] [PMC free article] [PubMed] [Google Scholar]
- [32].Aracena-Parks P, Goonasekera SA, Gilman CP, Dirksen RT, Hidalgo C, Hamilton SL. Identification of cysteines involved in S-nitrosylation, S-glutathionylation, and oxidation to disulfides in ryanodine receptor type 1. J Biol Chem. 2006;281:40354–40368. doi: 10.1074/jbc.M600876200. [DOI] [PubMed] [Google Scholar]
- [33].Huang B, Chen C. An ascorbate-dependent artifact that interferes with the interpretation of the biotin switch assay. Free Radic Biol Med. 2006;41:562–567. doi: 10.1016/j.freeradbiomed.2006.03.006. [DOI] [PubMed] [Google Scholar]
- [34].Tello D, Tarin C, Ahicart P, Breton-Romero R, Lamas S, Martinez-Ruiz A. A “fluorescence switch” technique increases the sensitivity of proteomic detection and identification of S-nitrosylated proteins. Proteomics. 2009;9:5359–5370. doi: 10.1002/pmic.200900070. [DOI] [PubMed] [Google Scholar]
- [35].Stoyanovsky DA, Tyurina YY, Tyurin VA, Anand D, Mandavia DN, Gius D, et al. Thioredoxin and lipoic acid catalyze the denitrosation of low molecular weight and protein S-nitrosothiols. J Am Chem Soc. 2005;127:15815–15823. doi: 10.1021/ja0529135. [DOI] [PubMed] [Google Scholar]
- [36].Forrester MT, Thompson JW, Foster MW, Nogueira L, Moseley MA, Stamler JS. Proteomic analysis of S-nitrosylation and denitrosylation by resin-assisted capture. Nat Biotechnol. 2009;27:557–559. doi: 10.1038/nbt.1545. [DOI] [PMC free article] [PubMed] [Google Scholar]
- [37].Held JM, Danielson SR, Behring JB, Atsriku C, Britton DJ, Puckett RL, et al. Targeted quantitation of site-specific cysteine oxidation in endogenous proteins using a differential alkylation and multiple reaction monitoring mass spectrometry approach. Mol Cell Proteomics. 2010;9:1400–1410. doi: 10.1074/mcp.M900643-MCP200. [DOI] [PMC free article] [PubMed] [Google Scholar]
- [38].Fujii J, Ikeda Y. Advances in our understanding of peroxiredoxin, a multifunctional, mammalian redox protein. Redox Rep. 2002;7:123–130. doi: 10.1179/135100002125000352. [DOI] [PubMed] [Google Scholar]
- [39].Vincent SR. Nitric oxide neurons and neurotransmission. Prog Neurobiol. 2010;90:246–255. doi: 10.1016/j.pneurobio.2009.10.007. [DOI] [PubMed] [Google Scholar]
- [40].Contestabile A. Regulation of transcription factors by nitric oxide in neurons and in neural-derived tumor cells. Prog Neurobiol. 2008;84:317–328. doi: 10.1016/j.pneurobio.2008.01.002. [DOI] [PubMed] [Google Scholar]
- [41].Kwak YD, Ma T, Diao S, Zhang X, Chen Y, Hsu J, et al. NO signaling and S-nitrosylation regulate PTEN inhibition in neurodegeneration. Mol Neurodegener. 2010;5:49. doi: 10.1186/1750-1326-5-49. [DOI] [PMC free article] [PubMed] [Google Scholar]
- [42].Gao C, Guo H, Wei J, Mi Z, Wai PY, Kuo PC. Identification of S-nitrosylated proteins in endotoxin-stimulated RAW264.7 murine macrophages. Nitric Oxide. 2005;12:121–126. doi: 10.1016/j.niox.2004.11.006. [DOI] [PubMed] [Google Scholar]
- [43].Greco TM, Hodara R, Parastatidis I, Heijnen HF, Dennehy MK, Liebler DC, et al. Identification of S-nitrosylation motifs by site-specific mapping of the S-nitrosocysteine proteome in human vascular smooth muscle cells. Proc Natl Acad Sci USA. 2006;103:7420–7425. doi: 10.1073/pnas.0600729103. [DOI] [PMC free article] [PubMed] [Google Scholar]
- [44].Lopez-Sanchez LM, Corrales FJ, Gonzalez R, Ferrin G, Munoz-Castaneda JR, Ranchal I, et al. Alteration of S-nitrosothiol homeostasis and targets for protein S-nitrosation in human hepatocytes. Proteomics. 2008;8:4709–4720. doi: 10.1002/pmic.200700313. [DOI] [PubMed] [Google Scholar]
- [45].Paige JS, Xu G, Stancevic B, Jaffrey SR. Nitrosothiol reactivity profiling identifies S-nitrosylated proteins with unexpected stability. Chem Biol. 2008;15:1307–1316. doi: 10.1016/j.chembiol.2008.10.013. [DOI] [PMC free article] [PubMed] [Google Scholar]
- [46].Jaffrey SR, Erdjument-Bromage H, Ferris CD, Tempst P, Snyder SH. Protein S-nitrosylation: a physiological signal for neuronal nitric oxide. Nat Cell Biol. 2001;3:193–197. doi: 10.1038/35055104. [DOI] [PubMed] [Google Scholar]
- [47].Molina y Vedia L, McDonald B, Reep B, Brune B, Di Silvio M, Billiar TR, et al. Nitric oxide-induced S-nitrosylation of glyceraldehyde-3-phosphate dehydrogenase inhibits enzymatic activity and increases endogenous ADP-ribosylation. J Biol Chem. 1992;267:24929–24932. [PubMed] [Google Scholar]
- [48].Padgett CM, Whorton AR. S-nitrosoglutathione reversibly inhibits GAPDH by S-nitrosylation. Am J Physiol. 1995;269:C739–C749. doi: 10.1152/ajpcell.1995.269.3.C739. [DOI] [PubMed] [Google Scholar]
- [49].Mohr S, Stamler JS, Brune B. Posttranslational modification of glyceraldehyde-3-phosphate dehydrogenase by S-nitrosylation and subsequent NADH attachment. J Biol Chem. 1996;271:4209–4214. doi: 10.1074/jbc.271.8.4209. [DOI] [PubMed] [Google Scholar]
- [50].Mohr S, Hallak H, de Boitte A, Lapetina EG, Brune B. Nitric oxide-induced S-glutathionylation and inactivation of glyceraldehyde-3-phosphate dehydrogenase. J Biol Chem. 1999;274:9427–9430. doi: 10.1074/jbc.274.14.9427. [DOI] [PubMed] [Google Scholar]
- [51].Martinez-Ruiz A, Lamas S. Detection and proteomic identification of S-nitrosylated proteins in endothelial cells. Arch Biochem Biophys. 2004;423:192–199. doi: 10.1016/j.abb.2003.12.006. [DOI] [PubMed] [Google Scholar]
- [52].Hara MR, Agrawal N, Kim SF, Cascio MB, Fujimuro M, Ozeki Y, et al. S-nitrosylated GAPDH initiates apoptotic cell death by nuclear translocation following Siah1 binding. Nat Cell Biol. 2005;7:665–674. doi: 10.1038/ncb1268. [DOI] [PubMed] [Google Scholar]
- [53].Lefievre L, Chen Y, Conner SJ, Scott JL, Publicover SJ, Ford WC, et al. Human spermatozoa contain multiple targets for protein S-nitrosylation: an alternative mechanism of the modulation of sperm function by nitric oxide. Proteomics. 2007;7:3066–3084. doi: 10.1002/pmic.200700254. [DOI] [PMC free article] [PubMed] [Google Scholar]
- [54].Huang B, Chen SC, Wang DL. Shear flow increases S-nitrosylation of proteins in endothelial cells. Cardiovasc Res. 2009;83:536–546. doi: 10.1093/cvr/cvp154. [DOI] [PubMed] [Google Scholar]
Associated Data
This section collects any data citations, data availability statements, or supplementary materials included in this article.