Abstract
Accessibility to the bulbar conjunctival microvasculature provides a means to assess blood supply to the cerebral cortex and thus optimize therapeutic interventions designed to prevent or reduce the risk of cerebral vascular disease and stroke. The feasibility of a method for quantitative measurements of conjunctiva blood vessel diameter, blood velocity, and flow in the human eye is reported. The method is based on slit lamp biomicroscope digital imaging coupled with a space time image analysis technique. A sequence of conjunctiva microvasculature images were captured at a rate of 50 Hz. The images were analyzed to determine blood vessel diameter, velocity and flow. Blood vessel diameter measurements ranged between 8.7 and 24.3 microns, with a mean value of 15.5 microns. Blood flow rate ranged between 27.3 and 296.9 pl/s, with a mean value of 111.8 pl/s. The relationship between blood flow and vessel diameter was fit with a power law curve (R = 0.87). The application of this technique for in vivo quantitative assessment of blood flow dynamics has potential to impact diagnosis and monitoring of various cardiovascular and blood disorders.
Keywords: Conjunctiva, circulation, blood flow, blood vessel diameter, microvasculature
It is broadly recognized that ex vivo examination and study of human hemorheology lacks the validity to accurately portray the in vivo human circumstance. Conversely, in-situ, non-invasive visualization of human microcapillary hemorheology is perhaps the most formidable methodology to accurately describe rheological parameters of blood flow dynamics. However, suitable in vivo imaging paradigms are hindered by limitations in terms of tissue accessibility and mechanistic validity of the technology. A tissue source representative of critical organ systems, notably the human brain, is required in which microvascular arteriolar and venular networks are accessible within a transparent medium to allow noninvasive in vivo imaging. Perhaps the most appropriate tissue for such a task is the thin mucous membrane that covers the sclera of the human eye, the conjunctiva.
The eye and brain have several notable parallels that from a hemorheologic standpoint are distinctive in terms of human anatomy. The eye and at least a portion of the brain are supplied by branches of the internal carotid artery that when studied from a physical perspective results in similar microcaliber size vessels at equidistance from the main vessel branching tree, with corresponding parallels in hydraulic fluid dynamics. Therefore, physical effects of blood pressure and rheological components of blood flow are likely to be essentially equivalent in respective arteriolar and venular capillary beds of both the eye and at least in a portion of the cerebral cortex. Furthermore, the eye is compartmentalized into a singular unit within the skull that is subject to the same external and physical internal force of the cerebral cortex. Previous studies have shown a significant correlation between the blood flow of the bulbar conjunctiva and cerebral cortex in dogs(Ohtani, 1996) and demonstrated the use of the conjunctiva microcirculation as an indicator of cerebral microcirculation and hemodynamics in patients with diabetes(Alizade, 2007) and during carotid artery surgery.(Schaser, et al., 2003) Therefore, examination of blood flow characteristics of the human eye would be reasonably expected to parallel that of the cerebral circulation, providing a succinct portrayal of vascular hemodynamics alterations due to disease and therapeutic interventions. Specifically, accessibility of the eye, notably the bulbar conjunctival microvasculature, could be utilized to assess and optimize the use of various pharmacotherapeutic interventions designed to prevent or reduce the risk of cerebral vascular disease and stroke.
The human conjunctiva is a richly vascularized transparent tissue that provides both protection and lubrication to the eye and is readily accessible for examination by a variety of techniques. Measurements of conjunctiva blood flow in human eyes have been reported using a modified scanning laser ophthalmoscope (Duench, et al., 2007). Other methods for digital imaging of the conjunctiva vasculature and blood flow velocity measurements based on displacement of red blood cells in successive image frames have been previously reported (Cheung, et al., 2001; Koutsiaris, et al., 2007; Schaser, et al., 2003). Also, an image processing method based on space time images for automated tracking of red blood cells in the rectractor muscle of hamsters has been published (Ellis, et al., 1992; Japee, et al., 2005; Japee, et al., 2005). In the current study, we report the feasibility of a method based on slit lamp biomicroscope digital imaging in conjunction with a space time image analysis technique for quantitative measurements of human eye conjunctiva blood vessel diameter, velocity, and flow rate in a manner not previously reported.
Materials and Methods
A Zeiss slit lamp biomicroscope equipped with a digital charged coupled device camera (UNIQVision Inc., Santa Clara, CA) was used to capture images of the human bulbar conjunctiva. A green filter with a transmission wavelength of 540 ± 5 nm was placed in the path of the slit lamp illumination light to improve the contrast of blood vessels. The optics of the slit lamp and additional magnification optics placed in front of the camera magnified the image of conjunctiva blood vessels. The system was calibrated by capturing an image of a ruler placed at the image plane. The digital image was comprised of 1024×1024 pixels and each pixel on the image was equivalent to 0.7 microns. During image acquisition, a sequence of 62 images was acquired at a rate of 50 Hz. In one normal human subject, 3 sets of conjunctiva images were acquired from different locations. From each image set, 20 to 40 consecutive frames were selected for registration based on image focus and the absence of blinks or large eye movements.
Image registration and analysis algorithms were written in Matlab software (The Mathworks Inc. Natick, MA). Image registration was a necessary pre-processing step to compensate for eye motion during image acquisition and to put each image in a common reference. A semi-automated, area based image registration technique was employed. The first image frame served as the reference frame, and each subsequent image was registered to the reference frame. The registration procedure consisted of first identifying approximately 20-40 high contrast points (e.g. vessel intersections) in the first frame by hand. Windows of 81×81 pixels were automatically centered on each reference point. Correlation coefficients (CC) were computed between pixel values in the reference frame windows and search windows in the non-registered frames to establish correspondence (similarity). The location of the search window in the non-registered image that resulted in the largest CC was assumed to be the location matching the reference point location. A sub-pixel matching algorithm (Gruen, 1985), was employed to improve the precision of the matched points location and increase the CC values. Using all reference and matched points with a CC > 0.8, parameters of a conformal transformation were defined with a least squares solution. Since eye motion only translated and rotated image features, a linear conformal transformation was considered appropriate. Using this procedure, a unique conformal transformation was established for each frame and used to register the frame to the reference frame.
Vessel centerlines were extracted by processing the mean image of the registered images. First, a polygonal region of interest (ROI) was selected that included a target vessel. Adaptive local thresholding was then applied to the ROI to create a binary image with vessel features assigned to one and all other features assigned to zero. Several morphological steps were then utilized to thin the vessel to a centerline including: 1) hole filling to eliminate any holes within the vessel after binarization, 2) dilation followed by erosion to bridge unconnected vessel areas, 3) thinning to reduce the vessel to a single line 4) removal of isolated pixels and noise 5) selection of the longest continuous line and 6) spur elimination to remove smaller erroneous branches of the centerline.
The vessel centerline was divided into 5-pixel length segments. For each segment, using linear regression analysis, the slope and offset were determined and a line perpendicular to the centerline, and extending beyond the vessel walls, was defined. Two-dimensional interpolation was performed to obtain the intensity profile of the perpendicular line. The intensity profile was normalized and the full-width at half maximum (FWHM) was computed. The vessel diameter was objectively and automatically quantified by the FWHM of the normalized intensity profile, a commonly used parameter for evaluation of vessel width in retinal images.(Patton, et al., 2006) This procedure was repeated for each centerline segment and the vessel diameter was derived as the average of FWHM measurements.
Axial red blood cell (RBC) velocity (Va) was measured by tracking the movement of RBCs along the vessel. Tracking of cells was accomplished using a modification of a technique (Ellis, et al., 1992; Japee, et al., 2005; Japee, et al., 2005) which involved creating a spatial-temporal image (STI) composed of the location of RBCs (spatial) as a function of the image frame (temporal). For each pixel along the vessel centerline, a line perpendicular to the centerline with length equal to the vessel diameter was selected. The intensity values along the perpendicular line were averaged to obtain a mean intensity over the vessel diameter. This procedure was repeated for each registered image frame. The intensity values along the vessel centerline from each image frame were stored in a separate column of the STI. In this manner, the STI was created such that the columns represented time (image frame) and the rows represent the distance along the blood vessel. The STI revealed distinct bands, each corresponding to either the movement of RBCs or the space between them in the image sequence. To obtain Va, a binary STI was created by thresholding of the grayscale STI. The longest continuous bands were identified and the slope of each band was determined using linear regression analysis. The mean slope of the identified band was a measure of Va. Cross sectional blood velocity, Vs, was calculated from Va using a previously defined function (Koutsiaris, et al., 2007) that accounts for the diameter of the blood vessel (D) relative to the size of the human erythrocyte diameter (7.65 microns). From Vs, the cross-sectional flow rate, Q, was determined using a standard flow rate equation: Q = Vs π D2/4.
Results
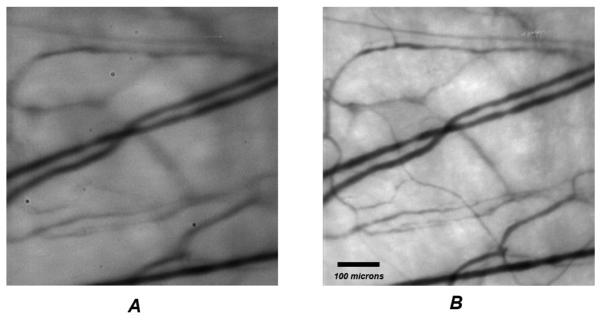
A typical example of the mean image of 40 consecutive non-registered images of the conjunctiva vasculature acquired in one image sequence is shown in Fig 1A. Clearly, significant blurring occurs due to eye motion. Images were registered by selecting control points with high contrast in the first image frame (reference frame). Fig 1B displays the mean of the registered images. Improvement in vessel sharpness is observed, which indicates correct image registration.
Figure 1.
A) An image of conjunctiva blood vessels derived by averaging 40 consecutive non-registered images; B) An image of conjunctiva blood vessels derived by averaging 40 consecutive registered images.
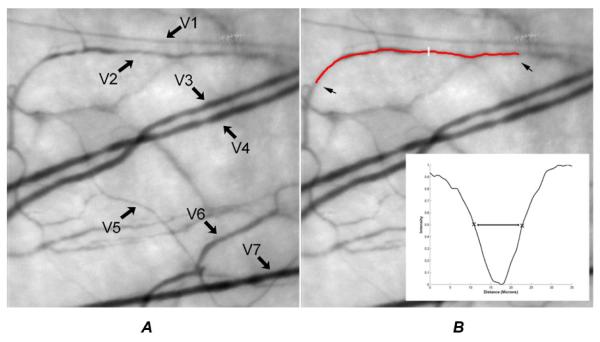
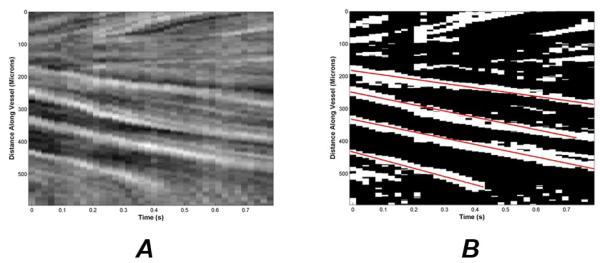
A registered mean conjunctiva vasculature image depicting 7 blood vessels is shown in Fig 2A. As an example, the overlay of the computed blood vessel centerline on the blood vessel V2 is shown in Fig 2B. From the normalized intensity profile of the line perpendicular to the blood vessel centerline, the FWHM was calculated as a measure of blood vessel diameter. Multiple measurements were made along a blood vessel V2, yielding a mean blood vessel diameter of 13.1 ± 3.7 microns (N = 156). Fig 3A displays an example of a STI generated for blood vessel V2 (Fig 2A). The vertical and horizontal axes represent distance along the vessel and time, respectively. The pixel values represent the intensity values at a given distance along the vessel and frame time. The best fit lines to each continuous band on the binarized STI are shown (Fig 3B). Each band represents tracking of RBCs and its slope is a measure of axial RBC velocity, Va. The average Va in blood vessel V2 was 0.31 ± 0.13 mm/sec (N = 4).
Figure 2.
A) Blood vessel diameters and blood velocities were measured in 7 blood vessels identified on the image; B) Overlay of center line on the blood vessel segment marked by arrows. The intensity profile along the white line drawn perpendicular to the blood vessel center line (insert). The full width at half-maximum of the intensity profile is a measure of blood vessel diameter.
Figure 3.
A) A space time image generated for the blood vessel V2 outlined in Fig 2B. The vertical and horizontal axes represent vessel path length and frame time, respectively; B) The best fit line to each continuous band on the binarized space time image is displayed. The line slope is a measure of axial blood velocity.
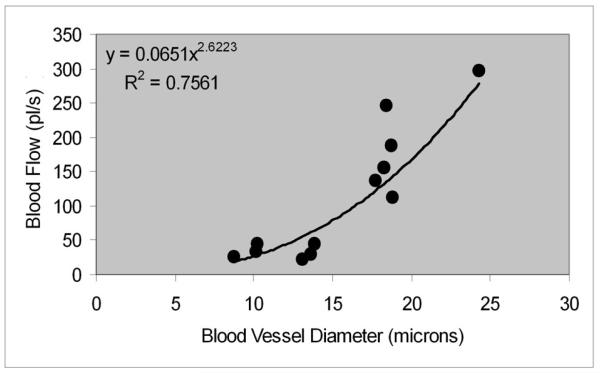
Blood vessel diameter and cross sectional blood velocity measurements were obtained in 12 blood vessels from 3 image sequences. A summary of blood vessel diameter and axial velocity measurements is shown in Table 1. Blood vessels had diameters ranging between 8.7 and 24.3 microns, with a mean value of 15.5 microns. On average, the standard error of the mean (SEM) for blood vessel diameter measurements was 0.3 microns and the coefficient of variation (COV) was 19% (3 microns) (N = 12). Cross sectional blood velocities ranged between 0.2 and 1.2 mm/ sec, with a mean value of 0.7 mm/sec. The COV for cross sectional blood velocity measurements was on average 18 %, ranging between 4% and 36% (N = 12). The relationship between flow rate and blood vessel diameter is shown in Fig 4. Blood flow rate ranged between 27.3 and 296.9 pl/s, with a mean value of 111.8 pl/s. The best fit curve to the flow rate data was a power law curve (Q = 0.065D2.62), displaying a high correlation (R = 0.87).
Table 1. Mean and standard error of the mean (SEM) of blood vessel diameter and axial velocity measurements.
| Vessel | Diameter (microns) | Axial Velocity (mm/sec) | ||||
|---|---|---|---|---|---|---|
| Mean | SEM | N | Mean | SEM | N | |
| V1 | 10.2 | 0.4 | 87 | 1.1 | 0.1 | 4 |
| V2 | 13.1 | 0.3 | 156 | 0.3 | 0.1 | 4 |
| V3 | 18.3 | 0.4 | 176 | 1.1 | 0.1 | 3 |
| V4 | 17.7 | 0.2 | 183 | 1.0 | 0.1 | 3 |
| V5 | 8.7 | 0.2 | 33 | 0.9 | 0.1 | 4 |
| V6 | 13.8 | 0.2 | 46 | 0.6 | 0.1 | 3 |
| V7 | 18.4 | 0.2 | 109 | 1.6 | 0.1 | 2 |
| V8 | 10.1 | 0.4 | 59 | 0.8 | 0.2 | 2 |
| V9 | 13.6 | 0.2 | 79 | 0.4 | 0.1 | 5 |
| V10 | 18.7 | 0.1 | 179 | 1.2 | 0.2 | 3 |
| V11 | 18.8 | 0.2 | 154 | 0.7 | 0.1 | 2 |
| V12 | 24.3 | 0.4 | 44 | 1.1 | 0.3 | 2 |
Figure 4.
Relationship between blood flow rate and vessel diameter (N = 12).
Conclusions
The ease of accessibility of the conjunctiva microcirculation can serve as a window to the body, ideal for evaluation of pathologic conditions or diseases that affect systemic circulation. Conjunctiva blood flow changes have been reported in sickle cell disease (Cheung, et al., 2002; Cheung, et al., 2001; Embury, et al., 1999) and lung cancer patients (Startseva, et al., 2006) as well as in individuals following carotid artery surgery (Schaser, et al., 2003). An imaging method for quantitative measurement of bulbar conjunctiva blood flow is reported. This method is noninvasive and allows simultaneous imaging and measurements in multiple blood vessels. The utility of space time image analysis technique for tracking of red blood cells over time in the human conjunctiva microvasculature was demonstrated, allowing estimation of blood velocity and flow.
Although an image processing method based on space time images for tracking of red blood cells in the retractor muscle of hamsters has been published (Ellis, et al., 1992; Japee, et al., 2005; Japee, et al., 2005), to our knowledge the current study reports the first application of this technique for assessment of conjunctival blood flow in human eyes. Additionally, the method for space time image generation and axial velocity data extraction reported in the current study differs from previous studies. In previous studies (Ellis, et al., 1992; Japee, et al., 2005; Japee, et al., 2005), the STI was generated after extracting the position and length of RBCs and an average axial velocity was obtained by spatial correlation of adjacent vertical lines in the STI. Alternatively, axial velocity was determined by calculating the distance between RBC centroid positions in consecutive frames and dividing by the image acquisition time, similar to other methods of axial velocity measurement in the bulbar conjunctiva (Cheung, et al., 2001; Koutsiaris, et al., 2007; Schaser, et al., 2003). In contrast, in the current study, the STI was created based on intensity values along the vessel centerline and axial velocity was determined as the average slope of the lines fitted to the prominent bands in the STI.
In the current study, the variation in blood velocity measurements was on average 18%, similar to measurements in the hamster retractor muscle microvessels (Japee, et al., 2005) and human conjunctiva microvasculature using a different technique (Cheung, et al., 2002; Koutsiaris, et al., 2007), despite the small sample size in the current study. The current method requires at least 20 sequential registered image frames for deriving reliable blood velocity measurements. Due to the high magnification of the system, small eye motion may limit the number of sequential images that can be successfully registered. However, the use of digital cameras with higher acquisition rates will likely overcome this potential limitation.
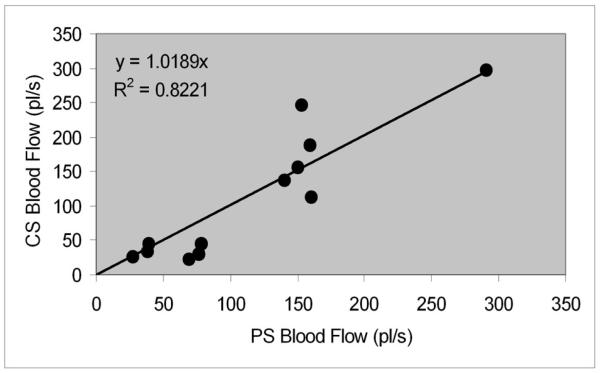
Blood flow rate measurements were related to blood vessel diameter following a power law curve, in agreement with a previously study (Koutsiaris, et al., 2007). The coefficients that described the power curve law in the 2 studies were only slightly different, which may be attributed to the small sample size in the current study. In Fig 5, flow rates estimated from the power law curve derived in the current study is plotted as function of flow rates estimated using the power law curve derived from a previous study (Koutsiaris, et al., 2007). Linear regression analysis yielded a best fit line with slope of 1.02 and a very high correlation (R = 0.91).
Figure 5.
Relationship between blood flow estimated by the power law curve derived in the current study (CS) and in a previous study (PS)(Koutsiaris, et al., 2007).
In the future, this method could be employed to establish blood flow properties of healthy subjects and detect abnormalities due to blood or vascular diseases. By distinguishing blood flow parameters affected by disease, one could potentially monitor disease progression as well as optimize the effect of various pharmacotherapeutic entities in the treatment of various cardiovascular and blood disorders in a manner that reduces negative patient outcomes. In addition, application of this method could be used to add to our general knowledge of in vivo blood rheology and erythrocyte flow dynamics.
Acknowledgements
This study was supported by the National Eye Institute, Bethesda, MD, EY17918 (MS) and EY01792 (UIC), and Research to Prevent Blindness, New York, NY, senior scientific investigator award (MS) and an unrestricted departmental award.
Footnotes
Publisher's Disclaimer: This is a PDF file of an unedited manuscript that has been accepted for publication. As a service to our customers we are providing this early version of the manuscript. The manuscript will undergo copyediting, typesetting, and review of the resulting proof before it is published in its final citable form. Please note that during the production process errors may be discovered which could affect the content, and all legal disclaimers that apply to the journal pertain.
References
- Alizade IT. Acoustic dysfunction and microcirculation in patients with diabetes mellitus. Vestn Otorinolaringol. 2007:11–13. [PubMed] [Google Scholar]
- Cheung AT, et al. Microvascular abnormalities in sickle cell disease: a computer-assisted intravital microscopy study. Blood. 2002;99:3999–4005. doi: 10.1182/blood.v99.11.3999. [DOI] [PubMed] [Google Scholar]
- Cheung AT, et al. Correlation of abnormal intracranial vessel velocity, measured by transcranial Doppler ultrasonography, with abnormal conjunctival vessel velocity, measured by computer-assisted intravital microscopy, in sickle cell disease. Blood. 2001;97:3401–3404. doi: 10.1182/blood.v97.11.3401. [DOI] [PubMed] [Google Scholar]
- Duench S, et al. Assessment of variation in bulbar conjunctival redness, temperature, and blood flow. Optom Vis Sci. 2007;84:511–516. doi: 10.1097/OPX.0b013e318073c304. [DOI] [PubMed] [Google Scholar]
- Ellis CG, et al. Application of image analysis for evaluation of red blood cell dynamics in capillaries. Microvasc Res. 1992;44:214–225. doi: 10.1016/0026-2862(92)90081-y. [DOI] [PubMed] [Google Scholar]
- Embury SH, et al. In vivo blood flow abnormalities in the transgenic knockout sickle cell mouse. J Clin Invest. 1999;103:915–920. doi: 10.1172/JCI5977. [DOI] [PMC free article] [PubMed] [Google Scholar]
- Gruen A. Adaptive least-squares correlation - a powerful matching technique. S Afr J Photogramm Remote Sensing Cartography. 1985;14:175–187. [Google Scholar]
- Japee SA, et al. Automated method for tracking individual red blood cells within capillaries to compute velocity and oxygen saturation. Microcirculation. 2005;12:507–515. doi: 10.1080/10739680591003341. [DOI] [PubMed] [Google Scholar]
- Japee SA, et al. A new video image analysis system to study red blood cell dynamics and oxygenation in capillary networks. Microcirculation. 2005;12:489–506. doi: 10.1080/10739680591003332. [DOI] [PubMed] [Google Scholar]
- Koutsiaris AG, et al. Volume flow and wall shear stress quantification in the human conjunctival capillaries and post-capillary venules in vivo. Biorheology. 2007;44:375–386. [PubMed] [Google Scholar]
- Ohtani N. Laser Doppler flowmetry of the bulbar conjunctiva as a monitor of the cerebral blood flow. Nippon Kyobu Geka Gakkai Zasshi. 1996;44:1721–1728. [PubMed] [Google Scholar]
- Patton N, et al. Retinal image analysis: concepts, applications and potential. Prog Retin Eye Res. 2006;25:99–127. doi: 10.1016/j.preteyeres.2005.07.001. [DOI] [PubMed] [Google Scholar]
- Schaser KD, et al. Noninvasive analysis of conjunctival microcirculation during carotid artery surgery reveals microvascular evidence of collateral compensation and stenosis-dependent adaptation. J Vasc Surg. 2003;37:789–797. doi: 10.1067/mva.2003.139. [DOI] [PubMed] [Google Scholar]
- Startseva J, et al. The diagnosis of transcapillary flow disturbances in the lungs of lung cancer. Clin Hemorheol Microcirc. 2006;35:305–306. [PubMed] [Google Scholar]


