The enzymatic activation of human legumain requires both proteolytic cleavage and conformational reordering and is modulated by its substrate as well as cofactors. These biochemical findings are aided by the crystallization and initial crystallographic analysis of legumain.
Keywords: cysteine proteases, pH regulation, conformational activation, substrate-dependent activity, autoimmune diseases, cancer
Abstract
Localized mainly to endo/lysosomes, legumain plays an important role in exogenous antigen processing and presentation. The cysteine protease legumain, also known as asparaginyl endopepetidase AEP, is synthesized as a zymogen and is known to undergo pH-dependent autoproteolytic activation whereby N-terminal and C-terminal propeptides are released. However, important mechanistic details of this pH-dependent activation as well as the characteristic pH activity profile remain unclear. Here, it is shown that all but one of the autocatalytic cleavage events occur in trans, with only the release of the C-terminal propeptide being relevant to enzymatic activity. An intriguing super-activation event that appears to be exclusively conformational in nature and enhances the enzymatic activity of proteolytically fully processed legumain by about twofold was also found. Accepting asparagines and, to lesser extent, aspartic acid in P1, super-activated legumain exhibits a marked pH dependence that is governed by the P1 residue of its substrate and conformationally stabilizing factors such as temperature or ligands. The crystallization and preliminary diffraction data analysis of active legumain are presented, which form an important basis for further studies that should clarify fundamental aspects of activation, activity and inactivation of legumain, which is a key target in (auto-)immunity and cancer.
1. Introduction
1.1. Location and physiological relevance
Legumain is a lysosomal/vacuolar cysteine protease that was originally identified in plants, where it contributes to the processing and maturation of seed storage proteins (Kembhavi et al., 1993 ▶; Hara-Nishimura et al., 1991 ▶). It is synonymously termed asparaginyl endopeptidase (AEP), reflecting its strict specificity towards asparaginyl and, to a lesser extent, aspartyl peptide bonds (Chen et al., 1997 ▶; Mathieu et al., 2002 ▶). In addition to their role as vacuolar processing enzymes (VPE), plant legumains have been shown to trigger virus-induced programmed cell death (Hatsugai et al., 2004 ▶; Panjikar et al., 2005 ▶; Alim et al., 2008 ▶). This functional relationship of plant legumains to caspases is further reflected by a weak sequence similarity of ∼15%.
Legumain is known to play important additional roles in parasites and mammals. It represents a key enzyme in the processing of foreign antigens, such as the tetanus toxin, and the destruction of autoantigen epitopes, which has been best studied for the myelin basic protein, as well as their consequent presentation by the MHCII complex (Manoury et al., 1998 ▶, 2002 ▶; Burster et al., 2004 ▶). Additionally, legumain proteolytically activates TLR-9 and thus contributes to the innate immune response mediated by dendritic cells (Sepulveda et al., 2009 ▶). Moreover, both in vitro and in vivo studies indicate that legumain participates in the activation of cathepsins B, H and L and progelatinase A (Maehr et al., 2005 ▶; Chen et al., 2001 ▶).
Overexpression of the enzyme is associated with enhanced tissue invasion and metastasis in many tumours (Gawenda et al., 2007 ▶). Together with its strict substrate specificity, legumain has therefore emerged as an attractive target for the local activation of prodrugs in tumour tissues (Luo et al., 2006 ▶; Bajjuri et al., 2011 ▶).
Finally, mammalian legumain is found in diverse tissues, albeit in varying concentrations. This wide distribution is accompanied by functions that are partially independent of its proteolytic activity. A prominent example is the involvement of legumain in the inhibition of osteoclast formation and bone resorption, which could be mapped to the C-terminal propeptide of legumain (Choi et al., 2001 ▶).
1.2. Comparison of legumain with related cysteine proteases, including cathepsins and caspases
The cysteine protease legumain shares with cathepsins its fundamental mechanism of action and localization to the endo/lysosomes as well as its ability to undergo a pH-dependent autoproteolytic maturation. Despite these similarities, there is no sequence homology between cathepsins and legumain (Chen et al., 1997 ▶). Instead, as a member of the C13 family, legumain (EC 3.4.22.34) belongs to the CD clan, which is defined by a characteristic pattern in the sequences flanking the catalytic dyad formed by the His148-Gly-spacer-Ala-Cys189 motif. This highly conserved motif is also found in caspase 1, clostripain, gingipain R, separase and the RTX self-cleaving toxin and is expected to translate into a structural relationship within the CD-clan members (Barrett & Rawlings, 2001 ▶; Chen et al., 1998 ▶; Rawlings et al., 2010 ▶).
Intriguingly, legumain is effectively inhibited by several members of the cystatin protein-inhibitor family, including cystatins C, D and E/M, suggesting a further relationship with the cathepsin protease family. However, the legumain reactive-centre loop is distinct from that interacting with papain-like proteases (Alvarez-Fernandez et al., 1999 ▶; Cheng et al., 2006 ▶). The sensitivity of legumain towards cystatins thus does not indicate a similarity of its active-site topology to that of cathepsins, but presumably mirrors the co-localization of these proteases and inhibitors to the endo/lysosome. Consistently, legumain is insensitive to E-64, an epoxide-based broad-spectrum inhibitor of papain proteases (Kembhavi et al., 1993 ▶).
1.3. Preliminary characterization of autocleavages and their role in activation
Legumain is synthesized as inactive zymogen consisting of a signal peptide (Met1–Ala17) that is released during secretion, an eight-amino-acid N-terminal propeptide (Val18–Asp25), the cysteine protease domain spanning Gly26–Asn323 and a C-terminal pro-domain (Asp324–Tyr433) of 110 amino acids in length (Chen et al., 1997 ▶). Upon pH shift to below ∼5.5 the inactive full-length 56 kDa glycoprotein undergoes an autocatalytic removal of the C-terminal pro-domain, resulting in a 47 kDa intermediate. A further decrease in pH triggers the release of the short N-terminal propeptide and produces the final 46 kDa protease (Chen et al., 2000 ▶; Li et al., 2003 ▶). However, the causative relationship of these cleavages to enzymatic activation has remained unclear and controversial. In vivo, the autocatalytic processing is supplemented, resulting in a further conversion of the 46 kDa species to the 36 kDa mature legumain. This conversion can be inhibited by E-64 and leupeptin, but the identity of the protease that cleaves legumain and the exact processing site remain unclear (Chen et al., 2000 ▶). However, the enzymatic activity does not significantly differ between these two species.
We observed that activated legumain is heterogeneous both with respect to its cleavage pattern and its specific activity. These early observations prompted further studies to elucidate a more detailed understanding of the activation mechanism. Here, we present the delicately pH-controlled activation which induces distinct proteolytic cleavages. The subsequent conformational transition, which is only accessible at pH 4 or below, super-activates legumain at pH 5.5 and thus represents a new paradigm of conformational hysteresis in protein activation. Additionally, we provide evidence for substrate-dependence of the proteolytic activity of legumain.
2. Materials and methods
2.1. Materials
Human legumain full-length cDNA clone Hs.18069 was obtained from imaGenes (Berlin, Germany). Restriction enzymes and T4 ligase were obtained from Fermentas (St Leon-Rot, Germany) and Pfu Ultra II Fusion HS DNA polymerase was obtained from Stratagene (La Jolla, USA). Custom-made primers were obtained from Sigma–Aldrich (München, Germany) and sequence analyses were performed at Eurofins MWG Operon (Martinsried, Germany). Escherichia coli strain XL1 Blue (Stratagene, La Jolla, USA) was used for subcloning expression constructs. To produce fully glycosylated protein, the Leishmania tarentolae expression system (LEXSY; Jena Bioscience, Germany) was used (Breitling et al., 2002 ▶; Chen et al., 1997 ▶). Z-Ala-Ala-AzaAsn-CMK was a generous gift from U. Demuth (Probiodrug, Halle, Germany). All reagents used were of the highest standard available from Sigma–Aldrich (München, Germany) or AppliChem (Darmstadt, Germany).
2.2. Plasmid construction for recombinant expression in LEXSY
The encoding DNA fragment was amplified by polymerase chain reaction (Eppendorf Mastercycler ep gradient thermal cycler) using human legumain full-length cDNA clone Hs.18069 as template and an appropriate primer containing an XbaI restriction site (ACGGTCTAGAGATTCCTATAGATGATCC) and a reverse primer containing a KpnI restriction site (ACGTGGTACCGTAGTGACCAAGGC). Subsequently, the PCR product was cloned in the pLEXSY-sat2 vector utilizing the XbaI and KpnI restriction sites in the case of wild-type legumain and SalI and KpnI in the case of the N-terminally truncated Δ-(Val18–Asn25) mutant. Point mutations were introduced following a protocol based on the inverse PCR method (Wang & Wilkinson, 2001 ▶; Williams et al., 2007 ▶). The expression constructs carried an N-terminal signal sequence for secretory expression in the LEXSY supernatant. For purification, a C-terminal His6 tag was attached which is removed during autoactivation. All constructs were confirmed by DNA sequencing prior to protein expression.
2.3. Cell culture and protein expression and purification
Expression constructs were stably transfected into the LEXSY P10 host strain and grown at 299 K in BHI medium (Jena Bioscience) supplemented with 5 µg ml−1 haemin, 50 units ml−1 penicillin and 50 µg ml−1 streptomycin (Carl Roth). Positive clones were selected by addition of nourseothricin (Jena Bioscience). Protein expression was carried out in a 500 ml shaking culture (140 rev min−1, 299 K) inoculated 1:10 with transfected strain culture at OD600 ≃ 1.0 before harvesting at OD600 ≃ 3.
Recombinant protein was removed from the LEXSY supernatant via Ni purification using Ni–NTA Superflow resin (Qiagen, Hilden, Germany). Eluates were concentrated using Amicon Ultra centrifugal filter units (10 kDa molecular-weight cutoff, Millipore) and desalted using PD-10 columns (GE Healthcare) followed by gel filtration of selected samples utilizing an ÄKTA FPLC system equipped with a Superdex 75 10/300 GL column (GE Healthcare) to give the protein in the final buffer 20 mM Tris pH 7.5, 20 mM NaCl, 5 mM DTT.
2.4. Autoactivation
5–10 µM purified prolegumain was incubated at pH values between 4.0 and 7.5 at 310 K and the progress of autoactivation was monitored by SDS–PAGE. The pH value was varied in steps of 0.5 in 50 mM buffer (pH 4.0–6.0, citric acid; pH 6.5–7.5, HEPES). The amidolytic activity of activation intermediates was measured using the legumain-specific substrate benzoyl-l-asparaginyl-para-NHPhNO2 (Bz-Asn-pNA; Bachem) at 0.2 mM in a reaction buffer consisting of 100 mM citric acid (pH 5.5, unless otherwise noted), 100 mM NaCl, 5 mM DTT and 0.25–0.5 µM enzyme at 310 K. The end-point absorption of the released product was monitored spectrophotometrically at 405 nm in an Infinite M200 Plate Reader (Tecan). The kinetic parameters K m and V max were determined using nonlinear regression routines (Hernández & Ruiz, 1998 ▶). The catalytic efficiency k cat was calculated as V max/E tot. All experiments were carried out in triplicate. N-terminal sequencing of some of the activation intermediates was performed by Toplab (Martinsried, Germany).
2.5. pH control measurement
A pH control measurement was performed to confirm that the absorption of the product pNA was independent of pH. For this purpose, an enzymatic reaction was started at pH 4 and stopped after 5 min (293 K) via addition of the covalent inhibitor Z-Ala-Ala-AzaAsn-chloromethylketone (AAN-CMK), which was kindly provided by Professor Demuth (Probiodrug, Halle, Germany; Niestroj et al., 2002 ▶). End-point absorption was measured at pH 4 and after adjusting the pH to 7.5. The product absorption was independent of pH from pH 4.0 to pH 7.5, which is consistent with published data (Levine et al., 2008 ▶).
2.6. Activation of the C189S dead mutant
5 µM C189S prolegumain was incubated with fully activated wild-type legumain in a 1:20 molar ratio at pH values between 4.0 and 7.5 (pH 4.0–6.0, citric acid; pH 6.5–7.5, HEPES) at 310 K. Proteolytic processing was monitored by SDS–PAGE and selected intermediates were analyzed by N-terminal sequencing.
2.7. pH activity profile of mature legumain
Activated wild-type legumain was incubated in 50 mM buffer (pH 3.0–6.0, citric acid; pH 6.5–7.5, HEPES), 100 mM NaCl, 5 mM DTT and 0.2 mM Bz-Asn-pNA or Ac-Tyr-Val-Ala-Asp-pNA (Bachem) at 310 K and end-point product absorption was measured at 405 nm.
2.8. Inhibition studies
To study the P1–S1 interaction, covalent active-site-directed inhibitors were used. Mature legumain (15 µM) was incubated with Ac-Tyr-Val-Ala-Asp-chloromethylketone (YVAD-CMK; Bachem) and AAN-CMK at 15 µM final concentration. After 1 min incubation (293 K), turnover of Bz-Asn-pNA was measured at pH 4.0 and pH 5.5 in legumain reaction buffer (see §2.4). Control experiments contained DMSO instead of inhibitor.
2.9. Thermofluor assay
A thermal shift assay was performed as described by Ericsson et al. (2006 ▶). 2 mg ml−1 activated protein containing 50× SYPRO Orange (Invitrogen) was added in a 1:10 ratio to 22.5 µl screen solution. The pH of the screen solution was varied from 3 to 8.5 in steps of 0.5 using 60 mM of an appropriate buffer (pH 3–6, citric acid; pH 6.5, MES; pH 7–8.5, Tris). Thermal denaturation was measured in a 7500 Real Time PCR System (Applied Biosystems) from 293 to 368 K. Data processing was performed according to Niesen (2010 ▶).
2.10. Protein crystallization
For crystallization, protein–inhibitor complex formation was monitored by inactivation in the chromogenic activity assay. Excess inhibitor was dialysed away by repeated concentration in centrifugal filter units. Initial crystallization screening was carried out using the sitting-drop vapour-diffusion method utilizing a Hydra II Plus One (Matrix) liquid-handling system. 0.2 µl protein solution consisting of activated legumain in complex with covalent Z-Ala-Ala-AzaAsn-CMK at a concentration of 20 mg ml−1 was mixed with 0.2 µl screen solution (Hampton Index HT or JBScreen Classic) and equilibrated against 60 µl reservoir solution in 96-well Intelli-Plates (Art Robbins Instruments) at 293 K. Crystals grew within 10–14 d in a condition consisting of 0.1 M HEPES pH 7.5, 0.2 M lithium sulfate monohydrate and 25% PEG 3350. Fine screens were set up in 24-well Cryschem plates (Hampton Research). Heavy-atom derivatization was carried out by soaking native crystals with 20 mM ethylmercuryphosphate (EMP) for 72 h. For cryoprotection, the drops were covered with a layer of LV CryoOil (MiTeGen).
2.11. Data collection and processing
An X-ray diffraction data set was collected on beamline ID14-4 at the ESRF to a resolution of 2.47 Å. The beamline was equipped with a Q315r ADSC CCD detector. Data collection was performed using a crystal-to-detector distance of 364.9 mm and a wavelength of 1.0059 Å. The exposure time was 0.5 s at 12% transmission. 360 images were collected with a 1.0° oscillation range at 100 K. Data processing was performed utilizing iMOSFLM (Battye et al., 2011 ▶) and SCALA from the CCP4 program suite (Winn et al., 2011 ▶). Packing density was calculated according to Matthews (1968 ▶). SIRAS phasing was performed using AutoSol from the PHENIX program suite (Adams et al., 2002 ▶).
3. Results
3.1. Uncleaved full-length legumain is completely inactive independent of pH
Purified wild-type prolegumain, comprising residues Val18–Tyr433, was incubated at pH values between 4.0 and 7.5. The status of autocatalytic processing and activation was monitored on SDS–PAGE, and in selected cases by N-terminal Edman sequencing, to unambiguously define the reaction intermediate. Enzymatic activity was assayed using the legumain-specific substrate Bz-Asn-pNA. When full-length legumain was incubated with the synthetic substrate at pH values between 4 and 7.5 no chromogenic signal could be detected as long as legumain remained intact as a full-length protein. Activity only appeared with the beginning of the autocatalytic processing, which started spontaneously at low pH with the release of propeptides at the C-terminus and at the N-terminus, as described below.
Thus, we conclude that the propeptides strictly prevent enzymatic activity either by shielding the active site or by preventing the conformational transition necessary for full enzymatic activity, as described later.
3.2. Lowering the pH induces stepwise propeptide release and complex activation
In the following, we investigated how autocatalytic processing and the chromogenic activity of legumain were affected by the specified pH at which the sample was incubated for ∼20 h if not mentioned otherwise. While the protein was incubated at varying pH values, chromogenic activity using Bz-Asn-pNA was assayed at the pH optimum of 5.5 to allow comparison of the different reaction intermediates.
3.2.1. pH 7.0→pH 5.5
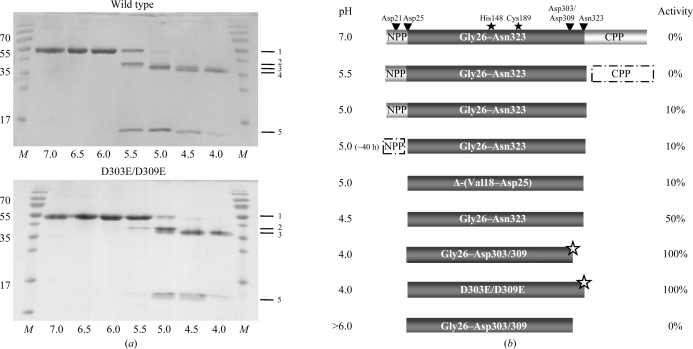
At neutral pH, full-length legumain remained stable with no indication of proteolytic processing as judged by SDS–PAGE. After shifting the pH to 5.5 the C-terminal propeptide Asp324–Tyr433 was cleaved within 20 h at 310 K (Fig. 1 ▶). Remarkably, this activation intermediate (Val18–Asn323) showed no activity in a chromogenic substrate assay at pH 5.5 (Fig. 2 ▶).
Figure 1.
Activation intermediates of legumain. (a) pH-dependent autoproteolytic processing shown by SDS–PAGE. SDS–PAGE of wild-type (wt) prolegumain and D303E/D309E prolegumain after incubation at the indicated pH values (310 K, 20 h). Lane M, molecular-weight marker (labelled in kDa); band 1, prolegumain (no cleavage); band 2, C-terminal propeptide cleaved (cleavage after Asn323); band 3, N- and C-terminal propeptides cleaved (after Asp25 and Asn323); lane 4, N-terminal propeptide cleaved and additionally processed at the C-terminus (Asp25 and Asp303/309); band 5, C-terminal propeptide. Band 4 was not observed for the D303E/D309E double mutant. (b) Schematic representation of autolytic cleavage intermediates. Activity is expressed as Bz-Asn-pNA turnover normalized to that of super-activated legumain. Autocatalytic cleavage sites are indicated by arrows. Δ-(Val18–Asp25) refers to the N-terminal truncation variant and D303E/D309E to the double mutant with disrupted C-terminal cleavage site. The variant at the bottom (pH > 6) illustrates irreversible inactivation of super-activated legumain after exposure to neutral pH. NPP, N-terminal propeptide (Val18–Asp25); CPP, C-terminal propeptide (Asp324–Tyr433); grey stars, super-activated legumain; filled stars, catalytic His148 and Cys189 residues.
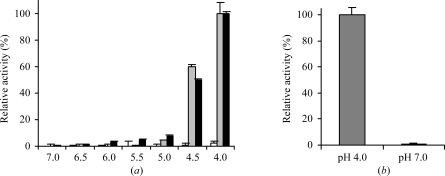
Figure 2.
The pH controls the activation and inactivation of legumain. (a) pH-dependent activation of legumain. Wild-type (black) and Δ-(Val18–Asp25) prolegumain (grey) were incubated at different pH values ranging from 7.0 to 4.0 (310 K) for 20 h. Bz-Asn-pNA turnover by the resulting activation intermediates in legumain activity-assay buffer at pH 5.5 was measured after autoprocessing was complete as judged by SDS–PAGE (4 h at pH 4.0; 20 h for all other pH values). White bars: prolegumain activity after incubation with Bz-Asn-pNA at the indicated pH. Prolegumain is inactive from pH 7 to pH 4. Activities are normalized to that of super-activated legumain. (b) Active legumain is irreversibly inactivated when incubated at neutral pH. Super-activated legumain was incubated at pH 4 and pH 7 (30 min, 310 K) and enzymatic activity was measured in legumain reaction buffer at pH 5.5. Neutral pH leads to irreversible inactivation of legumain. Activity values are averaged over three independent measurements and are shown together with the corresponding standard deviations.
3.2.2. pH 5.5→pH 5.0
Upon further lowering the pH from 5.5 to 5.0, the C-terminally processed legumain displayed approximately 10% activity compared with the fully active state (Fig. 2 ▶). Since this onset of enzymatic activity at pH 5.0 appeared to be independent of an additional cleavage, this suggests that it is a consequence of conformational changes within (pro-)legumain Val18–Asn323.
However, if the incubation of legumain at pH 5.0 was extended to approximately 40 h a further proteolytic processing at the N-terminus was observed. The resulting N-terminally trimmed variant Gly26–Asn323 showed similar enzymatic activity in the chromogenic assay as the Val18–Asn323 intermediate, i.e. ∼10% of the maximal activity. This result suggests that the N-terminal propeptide Val18–Asp25 does not downregulate enzymatic activity (Fig. 1 ▶).
3.2.3. Δ-(Val18–Asp25) variant
N-terminal propeptides often serve two purposes in proteases, namely chaperoning the correct folding and inactivation of the protease (Baker et al., 1993 ▶). The observed autoactivation intermediate Gly26–Asn323 indicated that the N-terminal propeptide does not inhibit enzymatic acitivity. To further test the role of the N-terminal propeptide in enzymatic activity, we prepared an N-terminal truncation variant lacking the N-terminal propeptide [Δ-(Val18–Asp25)]. The activity of this variant resembled that of the wild-type protein and it was inactive in the unprocessed form (Gly26–Tyr433) at pH 7.0 or pH 5.5. Like the wild-type protein, the truncation variant underwent correct maturation at pH 5.5 to the Gly26–Asn323 form, confirming correct folding of the protein. This conclusion was further corroborated by the fact that the truncation variant attained full activity upon further pH-triggered maturation, as described below.
Consequently, the N-terminal propeptide does not play a critical role as a folding chaperone or as an inhibitor of enzymatic activity.
3.2.4. pH 5.0→4.5
On lowering the pH to 4.5, we observed autocatalytic cleavage occurring at the N-terminus, releasing the N-terminal propeptide. As described above, this autocatalytic cleavage of the N-terminal propeptide already occurs at pH 5.0, albeit very slowly on a timescale of days. In contrast, at pH 4.5 the N-terminal trimming occurred rapidly and we observed no additional N-terminal trimming cleavages when the pH was lowered further (Fig. 1 ▶), as also confirmed by N-terminal sequencing. Despite being proteolytically fully processed (Gly26–Asn323), we observed only 50% of the maximal activity for legumain that was incubated at pH 4.0 (Fig. 2) ▶. Importantly, the observed N-terminal cleavages occurred after aspartic acid residues (Asp25; possibly also Asp21 and Asp22), indicating that legumain can accept Asp as the P1 residue at low pH.
3.2.5. pH 4.5→4.0: release of additional C-terminal peptide
When lowering the pH to 4.0, we observed an unexpected further shift in the molecular weight of prolegumain. N-terminal sequencing confirmed that the protein sequence of activated legumain started with Gly26, i.e. the mature N-terminus. Consequently, we concluded that an additional autocatalytic cleavage site was present at the C-terminus. Based on our observations with N-terminal propeptide release, we hypothesized that the cleavage at pH 4.0 might occur after an aspartic residue. Furthermore, by analysing eukaryotic prolegumain sequence profiles we identified two potential candidate residues which could act as conserved regulatory elements and were consistent with the observed mass distribution of the cleavage products: Asp303 and Asp309, which are both highly conserved in mammals and other eukaryotes. We next constructed a D303E/D309E double mutant in which the pH 4.0-dependent cleavage site should be disrupted. The D303E/D309E double mutant autoprocessed in the same pH-dependent manner as the wild-type protein. However, the D303E/D309E double mutant did not undergo the additional shift on SDS–PAGE when incubated at pH 4 (Fig. 1 ▶). We could thus confirm that Asp303 or Asp309, or both, serve as additional autolysis site(s).
In vivo maturated legumain has a molecular weight lower than what would be expected corresponding to the Gly26–Asn323 form. Since the N-terminus of this species could be confirmed as Gly26 (Chen et al., 2000 ▶), the additional processing must have occurred at the C-terminus. The in vivo processing will thus be closer to the Asp303/Asp309 site identified here than that at Asn323.
3.2.6. pH 4.0 ‘super-activation’ is independent of proteolytic processing
Legumain matures to the fully active form only when incubated at pH 4.0. This form yields maximum activity in the chromogenic Bz-Asn-pNA assay at pH 5.5, as will be described in more detail below, and it is this activity which we refer to as 100% activity (Fig. 2 ▶). The additional twofold activity boost of legumain upon its exposure to pH 4.0 is accompanied by release of the C-terminal Asp303/309–Asn323 peptide. To test whether the cleavage and release of the highly conserved Asp303/309–Asn323 peptide causes the additional twofold activity increase, we investigated the D303E/D309E double mutant in which the pH 4.0-dependent cleavage site is disrupted. The D303E/D309E mutant exhibited the same activity boost, which is thus independent of the cleavage at Asp303 or Asp309.
To clarify that the activity enhancement at pH 4.0 is independent of proteolytic processing, we refer to it as ‘super-activation’. It appears that super-activation is linked to the pH itself and the accompanying change in protonation of amino acids, in particular the side chains of glutamate (pK a ≃ 4.3) and aspartate (pK a ≃ 3.8) (Stryer, 2003 ▶). The change in protonation may break up salt bridges that are formed at neutral pH, e.g. Arg–Glu, and also induce new salt-bridge formation, e.g. Asp–Glu, and thus produce a conformational rearrangement.
3.3. Mechanism of autoproteolytic activation
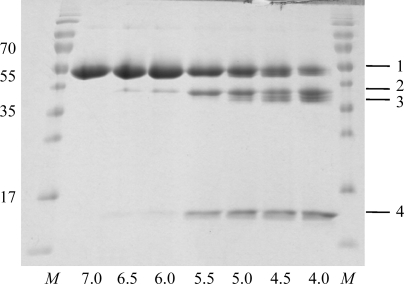
We next investigated whether the activation cleavages were carried out in cis or in trans. To this end, we constructed a C189S dead mutant and triggered its proteolytic processing by adding a small amount of super-activated wild-type legumain. Using a combination of SDS–PAGE analysis and N-terminal sequencing, we observed proteolytic cleavages at the C-terminus (Asn323–Asp324) and at the N-terminus (Asp21–Asp22 and Asp25–Gly26) of the C189S variant (Fig. 3 ▶). The pH optimum of these cleavages was pH 4 and thus mirrored the autoactivation characteristics of the wild-type protein. Notably, and in contrast to the wild-type protein, we found no evidence for the additional C-terminal cleavage after Asp303/309 (Fig. 3 ▶).
Figure 3.
Autocatalytic cleavage of prolegumain occurs in trans. SDS–PAGE of C189S prolegumain incubated with super-activated wild-type legumain at pH values as indicated (4 h, 310 K). M, molecular-weight marker (labelled in kDa); band 1, C189S prolegumain; band 2, C-terminal propeptide cleaved (cleavage after Asn323); band 3, N-terminal and C-terminal propeptides cleaved (cleavage after Asp25 and Asn323); band 4, C-terminal propeptide.
These results suggest that all but the last cleavage can occur in trans, consistent with the conclusions that were drawn based on the concentration dependence of the Asn323–Asp324 and Asp25–Gly26 cleavages (Li et al., 2003 ▶). In contrast, the cleavage after Asp303/309 necessarily occurs in cis. The situation thus parallels that in cathepsins, in which unimolecular cleavages similarly contribute to the protease activation of procathepsins B and S (Quraishi & Storer, 2001 ▶).
3.4. Irreversible inactivation of activated legumain at pH > 6.0
While prolegumain was stable at neutral and slightly basic pH values over weeks, activated legumain was rapidly and irreversibly inactivated when exposed to pH values of >6.0 (Fig. 2 ▶).
The drastic difference between prolegumain and activated legumain may be caused by (i) the presence or absence of the C-terminal propeptide, (ii) pH-induced conformational transitions during maturation, or a combination of both effects.
3.5. Relevance of the C-terminal propeptide (Asp324–Tyr433) to protein stability
To distinguish between these two possible mechanistic explanations, we constructed a Δ-(Asp324–Tyr433) variant lacking the C-terminal propeptide. This protein variant did not express detectable amounts of protein, clearly indicating that the C-terminal propeptide acts as a chaperone in folding the protein. The C-terminal Δ-(Asp324–Tyr433) truncation variant thus drastically differed from the N-terminal truncation variant Δ-(Val18–Asp25), which produced correctly folded protein that could be fully activated.
The result further supports the notion that the presence of the C-terminal propeptide confers stabilizing interactions to the protein at neutral pH which are not required at acidic pH, consistent with a pH-dependent conformational rearrangement during activation.
3.6. Legumain activity is pH-dependent and substrate-dependent
3.6.1. Legumain activity shows a pH optimum of 5.5 towards substrates with Asn at the P1 position
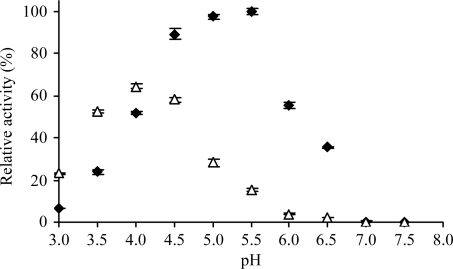
As described above, super-activation of prolegumain required its incubation at pH 4.0, although all proteolytic processing accompanying activation was completed at pH 5.0–4.5. However, maximum enzymatic activity towards Bz-Asn-pNA was observed at pH 5.5 (Fig. 4 ▶).
Figure 4.
pH-dependent asparaginyl-peptidase and aspartyl-peptidase activity of legumain. Bz-Asn-pNA (filled rectangles) and Ac-Tyr-Val-Ala-Asp-pNA (open triangles) turnover of super-activated legumain was measured in legumain reaction buffer at the indicated pH values at 310 K. Activity is represented by k cat/K m normalized to maximum activity (100%), which is obtained at pH 5.5 (n = 3, standard deviations indicated). The maximum activity was determined as k cat/K m = 7.3 ± 0.05 × 10² s−1 M −1, with k cat = 2 ± 0.5 s−1 and K m = 2.4 ± 0.1 mM.
These findings suggest that legumain undergoes a conformational hysteresis whereby it adopts a conformation that is accessible only at pH 4.0 and is retained up to pH 5.5.
3.6.2. Legumain activity shows a pH optimum of 4.0 towards substrates with Asp at the P1 position
To investigate whether the pH optimum is substrate-dependent, we capitalized on the legumain dead mutant C189S as a substrate for super-activated legumain. The turnover of the protein substrate was monitored by SDS–PAGE. As expected, and consistent with the activity profile towards Bz-Asn-pNA, the cleavage rate of the Asn323–Asp324 site was highest at a pH of 5.5 (Fig. 3 ▶). However, the additional cleavages at the N- and C-termini bearing aspartates at the P1 position (Asp22, Asp25 and Asp303/309) were hardly cleaved or not cleaved at all at pH 5.5. Only at pH 4 were these P1-Asp sites rapidly cleaved, indicating that the pH optimum of legumain is substrate-dependent (Fig. 3 ▶).
To further confirm the P1-Asp-dependent pH profile, we determined the amidolytic activity towards Ac-Tyr-Val-Ala-Asp-pNA (Fig. 4 ▶). The absolute aspartyl-peptidase activity closely resembles the asparaginyl-peptidase activity at acidic pH up to pH 4.0, where the former reaches its maximum.
Given the pK a of aspartates, which is close to 4, the observed pH-dependent Asn-peptidase and Asp-peptidase activities suggest that legumain accepts Asp in P1 only in the protonated state, where Asp closest resembles Asn both sterically and electrostatically.
3.6.3. Inhibition profiles cross-validate the P1-dependent pH optimum
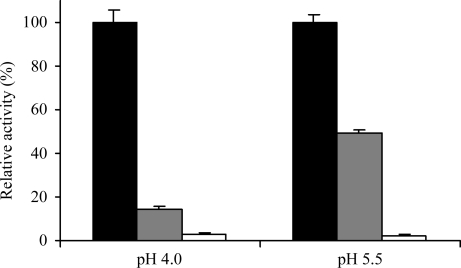
To further validate that the observed pH optimum of the enzymatic activity is related to the pH-dependent recognition of the P1 residue, we analysed the inactivation rates of the pNA activity of legumain at pH 4.0 and 5.5 by two peptidic inhibitors with Asn and Asp at P1. We found that the rate of inhibition by Asn-CMK was approximately 1.3 times more rapid at pH 5.5 than at pH 4.0; conversely, the rate of inhibition by Asp-CMK was approximately three times more rapid at pH 4.0 than at pH 5.5 (Fig. 5 ▶).
Figure 5.
P1-Asp is preferred at pH 4.0 over pH 5.5. The inhibition profile suggests that P1-Asp is only tolerated in its protonated form. Mature legumain (15 µM) was incubated for 1 min with YVAD-CMK and AAN-CMK (15 µM each) at pH 4 and pH 5.5 and residual activity was measured. Activity was normalized to the activity of the uninhibited control at the respective pH. Black, uninhibited; grey, inhibited with YVAD-CMK; white, inhibited with AAN-CMK (n = 3, standard deviations indicated).
Together, these analyses indicate that the observed pH optima are primarily governed by the S1–P1 interaction and to a much lesser extent by properties intrinsic to the protease itself, such as the protonation states of the catalytic residues His148 and Cys189.
3.7. The pH-dependent thermal stability relates to the activity profile of legumain
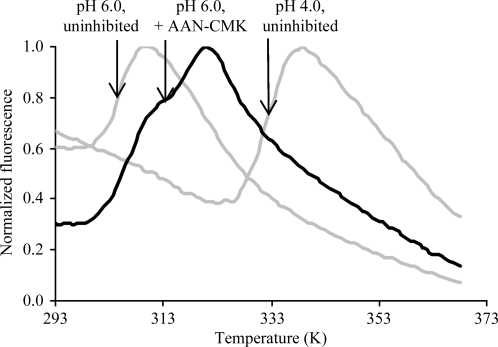
In an attempt to further investigate the mechanism of enzyme inactivation at neutral pH, we performed thermal melting studies at different pH values. We found that the thermal stability of active legumain was highest in the pH interval 4.0–5.5, with a melting temperature T m of ∼333 K. At pH values higher than 6.0 the melting temperature T m decreased to below 303 K (Fig. 6 ▶). The presence of an active-site-directed covalent inhibitor significantly increased the stability of legumain (Fig. 6 ▶).
Figure 6.
Active legumain is conformationally destabilized at neutral pH. pH-dependent melting curves of super-activated legumain in the presence and absence of an active site-directed inhibitor are shown. Activated legumain was incubated at the indicated pH values and thermal denaturation was measured by the Thermofluor method. An increase in fluorescence indicates the exposure of hydrophobic protein segments which accompanies protein unfolding. Melting points are indicated.
This finding clarifies (i) that an increase in pH destabilizes the conformation of legumain and (ii) that this destabilization critically affects the shape of the active site. A covalent Asn-chloromethylketone-based inhibitor stabilized the active-site conformation and thereby counteracted the overall destabilization. This finding further explains why the activity falls off at pH values of >5.5 independent of properties intrinsic to the protease catalytic residues, e.g. the protonation state of the catalytic residues His148 and Cys189. If accordingly stabilized, legumain may well have an activity optimum at pH 6 or higher towards P1-Asn substrates.
3.8. Protein crystallization and preliminary X-ray characterization
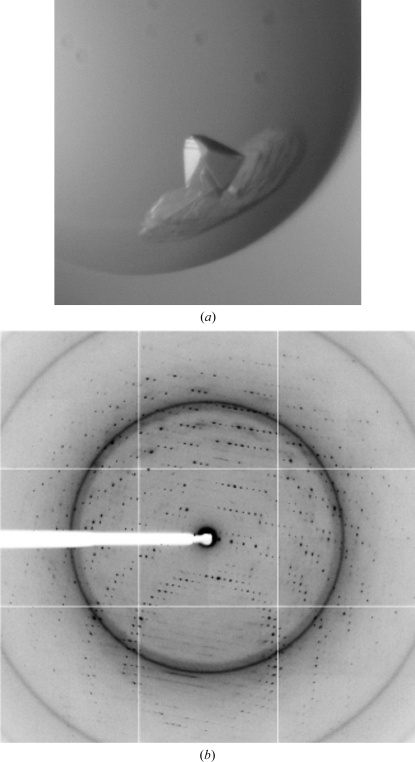
Super-activated legumain was crystallized in complex with the legumain-specific inhibitor AAN-CMK (Fig. 7 ▶). The crystals belonged to space group P42 and contained one molecule in the asymmetric unit, with a solvent content of 49%. While the sequence identity of legumain to caspases of ∼15% suggests some structural relationship, experimental phasing will be necessary for structure determination. We exploited a combination of isomorphous and anomalous scattering to enable structure determination. While derivatization with several heavy-atom compounds, including HgCl2, EMP (ethylmercury phosphate; C2H5HgH2PO4), K2PtCl4 and Ta6Br12, looked promising, only data from an EMP-soaked crystal could be collected at the L III edge to a resolution of 2.47 Å (Fig. 7 ▶ and Table 1 ▶). Two mercury sites could be located via SIRAS phasing using AutoSol from the PHENIX program suite (Adams et al., 2002 ▶), with a mean figure of merit of 0.64 after density modification. Model building is currently under way.
Figure 7.
Mercury-soaked crystals of mature legumain diffracted to beyond 2.5 Å resolution. Super-activated legumain was crystallized in complex with the covalent legumain-specific inhibitor AAN-CMK in a tetragonal lattice. (a) Legumain crystals are about 100 × 100 × 100 µm in size. (b) Diffraction image taken at ID14-4 (ESRF). Resolution at the edge, 2.47 Å; resolution at the corner, 1.86 Å. The diffraction patterns of native and Hg-derivative crystals are isomorphous (<1%) and similar in diffraction quality, e.g. resolution and mosaicity.
Table 1. Data-collection statistics.
Values in parentheses are for the highest resolution shell.
| Beamline | ESRF ID14-4 |
| Wavelength (Å) | 1.0059 |
| Space group | P42 |
| Unit-cell parameters (Å) | a = b = 64.31, c = 78.85 |
| Molecules per asymmetric unit | 1 |
| Solvent content (%) | 49 |
| Mosaicity (°) | 0.49 |
| Resolution range (Å) | 64.31–2.47 (7.81–2.47) |
| Mean I/σ(I) | 21.5 (10.2) |
| Rmerge† | 0.10 (0.23) |
| Ranom‡ | 0.09 (0.22) |
| No. of unique reflections | 11589 (1705) |
| Completeness (%) | 99.9 (100.0) |
| Multiplicity | 14.3 (14.2) |
| Anomalous completeness (%) | 99.9 (99.9) |
| Anomalous multiplicity | 7.3 (7.2) |
| No. of heavy-atom sites | 2 |
| Mean figure of merit (FOM) | 0.64 |
R
merge = 
 .
.
R
anom =  −
− 
 .
.
4. Discussion
4.1. Cleavage of C-terminal propeptide and conformational reordering are essential for full activation
By using the Δ-(Val18–Asp25) variant, we could show that the removal of the N-terminal propeptide is not sufficient for legumain activation. The release of the N-terminal propeptide is presumably also not necessary for activation, as confirmed by the identical activity of the Gly26–Asn323 and Val18–Asn323 variants at pH 5.5 (Figs. 1 ▶ and 2 ▶). This conclusion is corroborated by the comparison with plant legumains that do not require N-terminal processing for activation (Kuroyanagi et al., 2002 ▶). However, cleavage of the C-terminal propeptide is necessary to obtain enzymatic activity, although not sufficient for full activation (Fig. 2 ▶). Our findings thus refine previous conclusions on the relevance of the propeptide cleavage (Halfon et al., 1998 ▶; Chen et al., 2000 ▶; Li et al., 2003 ▶). The autoproteoloytic processing must be accompanied by a conformational reordering for full activation. Interestingly, the C-terminal propeptide does not dissociate spontaneously after cleavage but rather remains bound to the protease, as shown by co-migration on gel filtration. Over time, the propeptide is degraded and thus disappears, a process that is strongly accelerated at pH 4.0.
4.2. Legumain activity in nonlysosomal locations
Legumain is found in diverse tissues and in many tumours (Choi et al., 2001 ▶; Gawenda et al., 2007 ▶). This distribution appears surprising given its strict and rather narrow pH activity profile, which is limited to pH < 6.5 (Fig. 2 ▶). The apparent conflict may be reconciled when noting that the protease may well be active at neutral pH if it were suitably stabilized. It appears that this stabilization can be accomplished by integrins such as αVβ3 and α5β1, which act as receptors and cofactors of legumain, thereby enhancing its proteolytic activity (Liu et al., 2003 ▶).
Acknowledgments
We are grateful to Guy Salvesen and Lukas Mach for valuable discussions comparing the enzymatic and structural properties of legumain with cathepsins and caspases, Uli Demuth for providing the inhibitor Z-Ala-Ala-AzaAsn-CMK, the beamline scientists at ID14-4 for assistance during data collection and the Austrian Academy of Sciences (ÖAW; project No. 22866) as well as the Austrian Science Fund (FWF P_23454-B11) for funding.
References
- Adams, P. D., Grosse-Kunstleve, R. W., Hung, L.-W., Ioerger, T. R., McCoy, A. J., Moriarty, N. W., Read, R. J., Sacchettini, J. C., Sauter, N. K. & Terwilliger, T. C. (2002). Acta Cryst. D58, 1948–1954. [DOI] [PubMed]
- Alim, M. A., Tsuji, N., Miyoshi, T., Islam, M. K., Huang, X., Hatta, T. & Fujisaki, K. (2008). J. Insect Physiol. 54, 573–585. [DOI] [PubMed]
- Alvarez-Fernandez, M., Barrett, A. J., Gerhartz, B., Dando, P. M., Ni, J. & Abrahamson, M. (1999). J. Biol. Chem. 274, 19195–19203. [DOI] [PubMed]
- Bajjuri, K. M., Liu, Y., Liu, C. & Sinha, S. C. (2011). ChemMedChem, 6, 54–59. [DOI] [PMC free article] [PubMed]
- Baker, D., Shiau, A. K. & Agard, D. A. (1993). Curr. Opin. Cell Biol. 5, 966–970. [DOI] [PubMed]
- Barrett, A. J. & Rawlings, N. D. (2001). Biol. Chem. 382, 727–733. [DOI] [PubMed]
- Battye, T. G. G., Kontogiannis, L., Johnson, O., Powell, H. R. & Leslie, A. G. W. (2011). Acta Cryst. D67, 271–281. [DOI] [PMC free article] [PubMed]
- Breitling, R., Klingner, S., Callewaert, N., Pietrucha, R., Geyer, A., Ehrlich, G., Hartung, R., Müller, A., Contreras, R., Beverley, S. M. & Alexandrov, K. (2002). Protein Expr. Purif. 25, 209–218. [DOI] [PubMed]
- Burster, T. et al. (2004). J. Immunol. 172, 5495–5503. [DOI] [PubMed]
- Chen, J.-M., Dando, P. M., Rawlings, N. D., Brown, M. A., Young, N. E., Stevens, R. A., Hewitt, E., Watts, C. & Barrett, A. J. (1997). J. Biol. Chem. 272, 8090–8098. [DOI] [PubMed]
- Chen, J.-M., Fortunato, M. & Barrett, A. J. (2000). Biochem. J. 352, 327–334. [PMC free article] [PubMed]
- Chen, J.-M., Fortunato, M., Stevens, R. A. & Barrett, A. J. (2001). Biol. Chem. 382, 777–783. [DOI] [PubMed]
- Chen, J.-M., Rawlings, N. D., Stevens, R. A. & Barrett, A. J. (1998). FEBS Lett. 441, 361–365. [DOI] [PubMed]
- Cheng, T., Hitomi, K., van Vlijmen-Willems, I. M., de Jongh, G. J., Yamamoto, K., Nishi, K., Watts, C., Reinheckel, T., Schalkwijk, J. & Zeeuwen, P. L. (2006). J. Biol. Chem. 281, 15893–15899. [DOI] [PubMed]
- Choi, S. J., Kurihara, N., Oba, Y. & Roodman, G. D. (2001). J. Bone Miner. Res. 16, 1804–1811. [DOI] [PubMed]
- Ericsson, U. B., Hallberg, B. M., Detitta, G. T., Dekker, N. & Nordlund, P. (2006). Anal. Biochem. 357, 289–298. [DOI] [PubMed]
- Gawenda, J., Traub, F., Lück, H. J., Kreipe, H. & von Wasielewski, R. (2007). Breast Cancer Res. Treat. 102, 1–6. [DOI] [PubMed]
- Halfon, S., Patel, S., Vega, F., Zurawski, S. & Zurawski, G. (1998). FEBS Lett. 438, 114–118. [DOI] [PubMed]
- Hara-Nishimura, I., Inoue, K. & Nishimura, M. (1991). FEBS Lett. 294, 89–93. [DOI] [PubMed]
- Hatsugai, N., Kuroyanagi, M., Yamada, K., Meshi, T., Tsuda, S., Kondo, M., Nishimura, M. & Hara-Nishimura, I. (2004). Science, 305, 855–858. [DOI] [PubMed]
- Hernández, A. & Ruiz, M. T. (1998). Bioinformatics, 14, 227–228. [DOI] [PubMed]
- Kembhavi, A. A., Buttle, D. J., Knight, C. G. & Barrett, A. J. (1993). Arch. Biochem. Biophys. 303, 208–213. [DOI] [PubMed]
- Kuroyanagi, M., Nishimura, M. & Hara-Nishimura, I. (2002). Plant Cell Physiol. 43, 143–151. [DOI] [PubMed]
- Levine, M. N., Lavis, L. D. & Raines, R. T. (2008). Molecules, 13, 204–211. [DOI] [PMC free article] [PubMed]
- Li, D. N., Matthews, S. P., Antoniou, A. N., Mazzeo, D. & Watts, C. (2003). J. Biol. Chem. 278, 38980–38990. [DOI] [PubMed]
- Liu, C., Sun, C., Huang, H., Janda, K. & Edgington, T. (2003). Cancer Res. 63, 2957–2964. [PubMed]
- Luo, Y., Zhou, H., Krueger, J., Kaplan, C., Lee, S.-H., Dolman, C., Markowitz, D., Wu, W., Liu, C., Reisfeld, R. A. & Xiang, R. (2006). J. Clin. Invest. 116, 2132–2141. [DOI] [PMC free article] [PubMed]
- Maehr, R., Hang, H. C., Mintern, J. D., Kim, Y.-M., Cuvillier, A., Nishimura, M., Yamada, K., Shirahama-Noda, K., Hara-Nishimura, I. & Ploegh, H. L. (2005). J. Immunol. 174, 7066–7074. [DOI] [PubMed]
- Manoury, B., Hewitt, E. W., Morrice, N., Dando, P. M., Barrett, A. J. & Watts, C. (1998). Nature (London), 396, 695–699. [DOI] [PubMed]
- Manoury, B., Mazzeo, D., Fugger, L., Viner, N., Ponsford, M., Streeter, H., Mazza, G., Wraith, D. C. & Watts, C. (2002). Nature Immunol. 3, 169–174. [DOI] [PubMed]
- Mathieu, M. A., Bogyo, M., Caffrey, C. R., Choe, Y., Lee, J., Chapman, H., Sajid, M., Craik, C. S. & McKerrow, J. H. (2002). Mol. Biochem. Parasitol. 121, 99–105. [DOI] [PubMed]
- Matthews, B. W. (1968). J. Mol. Biol. 33, 491–497. [DOI] [PubMed]
- Niesen, F. (2010). DSF Analysis Manual v.3.0. Oxford: Structural Genomics Consortium. http://thermofluor.org/resources/DSF-Analysis-Manual-v3.0.pdf.
- Niestroj, A. J., Feussner, K., Heiser, U., Dando, P. M., Barrett, A., Gerhartz, B. & Demuth, H. U. (2002). Biol. Chem. 383, 1205–1214. [DOI] [PubMed]
- Panjikar, S., Parthasarathy, V., Lamzin, V. S., Weiss, M. S. & Tucker, P. A. (2005). Acta Cryst. D61, 449–457. [DOI] [PubMed]
- Quraishi, O. & Storer, A. C. (2001). J. Biol. Chem. 276, 8118–8124. [DOI] [PubMed]
- Rawlings, N. D., Barrett, A. J. & Bateman, A. (2010). Nucleic Acids Res. 38, D227–D233. [DOI] [PMC free article] [PubMed]
- Sepulveda, F. E., Maschalidi, S., Colisson, R., Heslop, L., Ghirelli, C., Sakka, E., Lennon-Duménil, A. M., Amigorena, S., Cabanie, L. & Manoury, B. (2009). Immunity, 31, 737–748. [DOI] [PubMed]
- Stryer, L. (2003). Biochemistry New York: W. H. Freeman & Co.
- Wang, J. & Wilkinson, M. F. (2001). Biotechniques, 31, 722–724. [DOI] [PubMed]
- Williams, M., Louw, A. I. & Birkholtz, L. M. (2007). Malar. J. 6, 64. [DOI] [PMC free article] [PubMed]
- Winn, M. D. et al. (2011). Acta Cryst. D67, 235–242.


