This study reports the expression, purification, crystallization and preliminary X-ray crystallographic analysis of human lysosomal β-d-galactosidase.
Keywords: β-galactosidase, galactose, 1-deoxygalactonojirimycin
Abstract
β-d-Galactosidase (β-Gal) is an exoglycosidase that cleaves β-galactosides from glycoproteins, sphingolipids and keratan sulfate. This study reports the expression, purification, crystallization and preliminary X-ray crystallographic analysis of human lysosomal β-Gal. The sitting-drop vapour-diffusion method was used to crystallize β-Gal in complexes with its product galactose and with the inhibitor 1-deoxygalactonojirimycin. The resulting crystals were isomorphous and belonged to space group P21. The crystals of the β-Gal–galactose and the β-Gal–inhibitor complexes had unit-cell parameters a = 94.8, b = 116.1, c = 140.3 Å, β = 92.2° and a = 94.8, b = 116.0, c = 140.3 Å, β = 92.2°, respectively. Diffraction data were collected to 1.8 Å resolution for both crystals.
1. Introduction
Human β-d-galactosidase (β-Gal; EC 3.2.1.23; GenBank Accession No. M22590.1) is a lysosomal enzyme that catalyses the hydrolysis of terminal β-galactosides from various substrates such as ganglioside GM1 and keratan sulfate (Alpers, 1969 ▶; Asp & Dahlqvist, 1972 ▶; Distler & Jourdian, 1973 ▶). Deficiencies in β-Gal cause metabolic storage disorders such as GM1 gangliosidosis and Morquio B disease, which are characterized by the accumulation of ganglioside GM1 and keratan sulfate, respectively (Oshima et al., 1991 ▶; Yoshida et al., 1991 ▶; Callahan, 1999 ▶).
Human β-Gal is a 677-amino-acid protein that has an N-terminal secretion signal and seven potential N-glycosylation sites (Asn26, Asn247, Asn464, Asn498, Asn542, Asn545 and Asn555; Oshima et al., 1988 ▶; Yamamoto et al., 1990 ▶). The enzyme is synthesized as an 88 kDa precursor that is transported to lysosomes, where it is proteolytically cleaved to the 64 kDa mature form (Hoogeveen et al., 1983 ▶, 1984 ▶). However, the C-terminal proteolytic fragment remains associated with the rest of the protein (van der Spoel et al., 2000 ▶). In addition, β-Gal forms a multienzyme complex with cathepsin A and neuraminidase that is important for its processing and function (Hoogeveen et al., 1986 ▶).
On the basis of sequence similarity to the enzymes of glycoside hydrolase family 35 (GH35; Henrissat, 1991 ▶), the active site of human β-Gal is predicted to use the TIM-barrel motif that is characteristic of this family. β-Gal catalyses the hydrolysis of glycosidic bonds in a retaining manner such that the anomeric configuration of the substrate is retained by a double-displacement mechanism. Two carboxylic acids are necessary for this mechanism; in human β-Gal Glu268 is the catalytic nucleophile and Glu188 is likely to be the acid/base catalyst (McCarter et al., 1997 ▶). 1-Deoxygalactonojirimycin (DGJ), a potent inhibitor of β-Gal, directly competes with the substrate and is a potential therapeutical agent that acts as a molecular chaperone that stabilizes and restores the catalytic activity of β-Gal (Suzuki, 2006 ▶). The differences in the chemical structures of DGJ and galactose are the absence of the 1-hydroxy group in DGJ and the substitution of oxygen in the O6 position with nitrogen in DGJ.
To understand the structural basis of the catalytic mechanism of β-Gal and its role in lysosomal storage diseases, we expressed, purified, crystallized and performed preliminary X-ray crystallographic analysis of human β-Gal in complexes with its product galactose and with the inhibitor DGJ.
2. Methods
2.1. Protein expression and purification
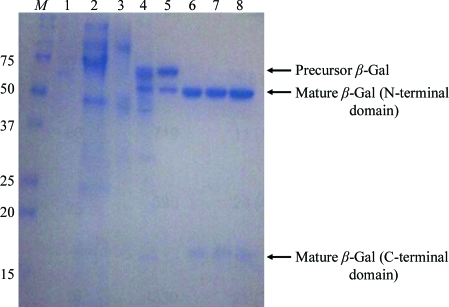
The DNA sequence encoding human β-Gal (residues 24–677) was inserted downstream of the Saccharomyces cerevisiae α-factor signal sequence in the Pichia pastoris expression vector pPIC9 (Invitrogen, San Diego, California, USA). Subsequently, this vector was transformed into P. pastoris KM71 and His+ transformants were selected on minimal dextrose plates containing 400 µg l−1 biotin, 20 g l−1 dextrose, 15 g l−1 agar and 13.4 g l−1 yeast nitrogen base without amino acids. The selected cells were incubated in a 10 l fermenter at 303 K for growth and 300 K for expression. The culture supernatant was harvested, mixed with ammonium sulfate [15%(w/v) final concentration] and then loaded onto a Phenyl Sepharose column (GE Healthcare Biosciences, Piscataway, New Jersey, USA) equilibrated with buffer A [20 mM 2-(N-morpholino)ethanesulfonic acid (MES) buffer pH 5.5, 20%(w/v) ammonium sulfate]. β-Gal was eluted with 20 mM MES buffer pH 5.5. The eluate was dialysed against buffer B (20 mM sodium/potassium phosphate buffer pH 7.0, 0.1 M NaCl) and then loaded onto a Q Sepharose Fast Flow column (GE Healthcare Biosciences) equilibrated with buffer B. Flowthrough fractions were collected and buffer-exchanged with buffer C (20 mM sodium acetate buffer pH 5.0, 0.1 M NaCl). Subsequently, these fractions were incubated with Endo Hf endoglycosidase (2000 U g−1 β-Gal; New England Biolabs, Ipswich, Massachusetts, USA) overnight at 303 K to cleave polysaccharides from β-Gal. The deglycosylated β-Gal was loaded onto a p-aminophenyl β-d-thiogalactopyranoside agarose column (Sigma–Aldrich, St Louis, Missouri, USA) equilibrated with buffer C and then eluted with buffer C containing 1.0 M galactose. The β-Gal-containing fractions were pooled, buffer-exchanged with buffer B and then subjected to limited proteolysis with 1:25(w:w) bovine trypsin (Sigma) at 310 K for 30 min. To stop the reaction, 1 mM tosyl-l-lysyl-chloromethane hydrochloride (Sigma) was added. Subsequently, buffer exchange was performed with buffer C and the protein was loaded onto a Poros HS cation-exchange column (Applied Biosystems, Foster City, California, USA) equilibrated with buffer C. β-Gal was subsequently eluted with a linear gradient of NaCl and the β-Gal-containing fractions were concentrated and loaded onto a Superdex 200 size-exclusion column (GE Healthcare Biosciences) equilibrated with buffer D (20 mM MES buffer pH 6.0, 0.1 M NaCl). Finally, purified β-Gal was concentrated to 10 mg ml−1 in buffer D containing 1 mM 1-deoxygalactonojirimycin (DGJ; Sigma). Protein purity was confirmed by SDS–PAGE analysis (Fig. 1 ▶).
Figure 1.
SDS–PAGE analysis of β-Gal purification. Lane M, molecular markers (labelled in kDa); lane 1, culture supernatant; lane 2, β-Gal after Phenyl Sepharose purification; lane 3, β-Gal after Q Sepharose purification; lane 4, β-Gal after Endo Hf endoglycosidase treatment; lane 5, β-Gal after aminophenyl β-d-thiogalactopyranoside affinity purification; lane 6, β-Gal after limited trypsinization; lane 7, β-Gal after Pros HS purification; lane 8, β-Gal after Superdex 200 gel filtration. Deglycosylated β-Gal precursor and mature β-Gal are indicated by arrows.
2.2. Crystallization
Crystallization experiments were performed using the sitting-drop vapour-diffusion method at 277 K. Initial crystals of the β-Gal–DGJ complex formed within a week after mixing equal volumes of the protein and reservoir solutions [20%(w/v) PEG 3350, 0.2 M ammonium sulfate, 100 mM Tris–HCl pH 8.0]. Diffraction-quality crystals were obtained by streak-seeding the initial crystals. Crystals were harvested in the mother liquor (25% PEG 3350, 0.2 M ammonium sulfate, 100 mM Tris–HCl pH 8.0) supplemented with 1 mM DGJ. To prepare crystals of the β-Gal–galactose complex, β-Gal–DGJ crystals were transferred into mother liquor supplemented with 200 mM galactose and incubated overnight.
3. Data collection and processing
Diffraction images were collected on beamline NW12A at the Photon Factory (PF; Tsukuba, Japan). All data sets were collected under cryogenic conditions at 95 K. The β-Gal–galactose and β-Gal–DGJ crystals were soaked in a cryoprotectant solution (mother liquor supplemented with 15% ethylene glycol and 200 mM galactose or 1 mM DGJ, respectively). Both data sets were collected from single crystals using the rotation method with 180 frames (1° per frame). The data sets were processed with MOSFLM and SCALA (Winn et al., 2011 ▶) and the HKL-2000 software package (Otwinowski & Minor, 1997 ▶).
4. Results and discussion
SDS–PAGE analysis of the purified protein (Fig. 1 ▶) showed a single band migrating at approximately 100 kDa, which suggested that the β-Gal was highly glycosylated. After treatment with endoglycosidase, β-Gal migrated at approximately 70 kDa, which is consistent with the calculated molecular mass of nonglycosylated β-Gal.
Since initial attempts to crystallize the deglycosylated β-Gal precursor failed, limited trypsinization was employed, which resulted in the production of two major polypeptide fragments of β-Gal that migrated at approximately 50 and 20 kDa on SDS–PAGE analysis. The N-terminal amino acid of the 50 kDa fragment corresponded to Asn26, indicating that the signal sequence of β-Gal was cleaved after Arg25. We obtained two N-terminal peptide sequences of the 20 kDa fragment from different samples; the corresponding N-terminal amino acids were Asp531 and Asn542, indicating cleavage after Arg530 and His541, respectively. As a result, we concluded that the 50 and 20 kDa fragments corresponded to the N-terminal domain (residues 26–530) and the C-terminal domain (starting at residues 531 or 542) of β-Gal, respectively. However, it is unlikely that trypsin was responsible for the cleavage event after His541 since trypsin cleaves specifically after basic residues. It is most likely that an unidentified protease from P. pastoris was responsible for this cleavage product. Indeed, some of this cleavage product could be observed before trypsinization was performed (e.g. Fig. 1 ▶, lane 4). The hydrolysis of 4-methylumbelliferyl-β-d-galactopyranoside by β-Gal was not altered by the cleavage by the protease. Following cleavage, the 50 and 20 kDa fragments copurified in the subsequent purification steps. As the mature form of β-Gal is reported to be cleaved on the N-terminal side of Ser543 or Ser544 into N-terminal domain and C-terminal domain fragments, which are associated (van der Spoel et al., 2000 ▶), we concluded that the partial proteolytic products of β-Gal closely resembled the mature form of β-Gal.
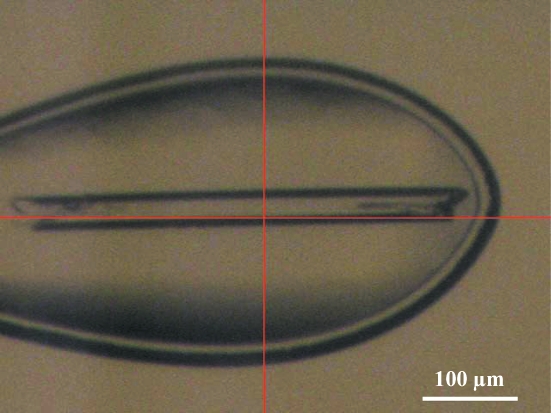
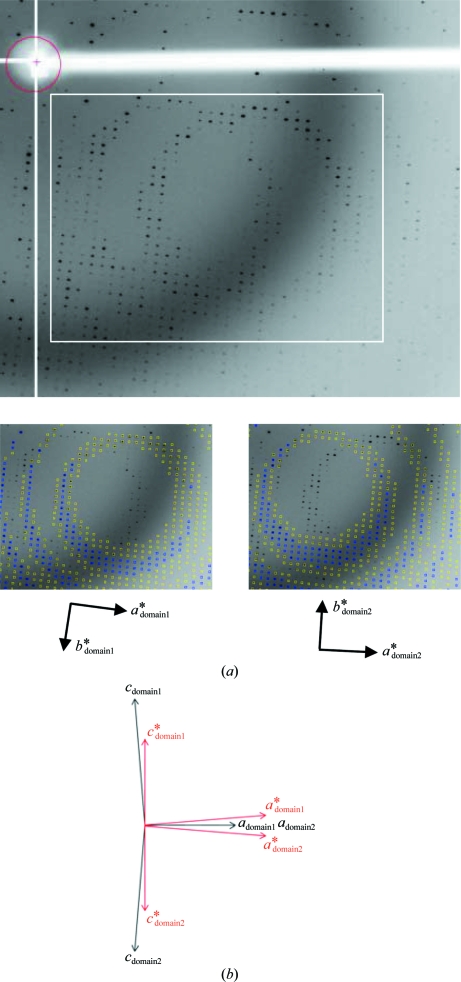
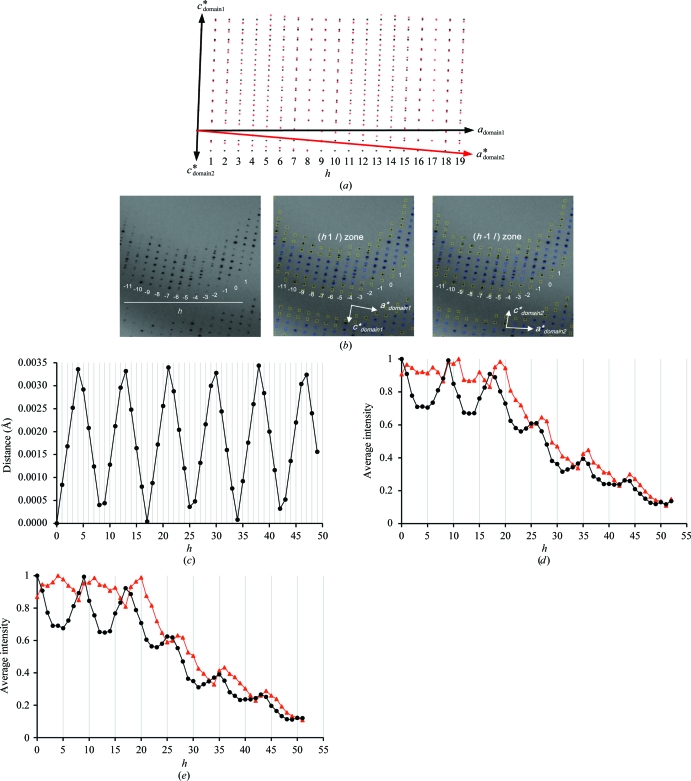
The deglycosylated and trypsinized form of β-Gal was readily crystallized using PEG 3350 and ammonium sulfate as precipitants in the presence of the inhibitor DGJ. The crystals of the β-Gal–galactose complex were obtained by soaking methods. The sufficient replacement of DGJ by galactose was confirmed by the resultant electron-density maps. The average dimensions of the crystals were 400 × 25 × 25 µm (Fig. 2 ▶). They belonged to space group P21, with unit-cell parameters a = 94.8, b = 116.1, c = 140.3 Å, β = 92.2° and a = 94.8, b = 116.0, c = 140.3 Å, β = 92.2° for the β-Gal–galactose and the β-Gal–inhibitor complexes, respectively. Both complex crystals diffracted to 1.8 Å resolution; however, the diffraction pattern indicated nonmerohedral twinning (Fig. 3 ▶ a). The crystals contained two twin domains with identical space groups and unit-cell parameters related by a 180° rotation along the a axis (Fig. 3 ▶ b). As a result, the diffraction pattern from the resulting twinned specimen consisted of two distinct lattices. We processed these two lattices independently. Twin domain 1 was readily identified with autoindexing by the HKL-2000 or MOSFLM programs. Using the orientation matrix of twin domain 1 and the twin operator of 180° rotation along the a axis, we obtained the orientation matrix of twin domain 2. Predicted reflection positions using this orientation matrix closely fitted the actual reflection positions (Fig. 3 ▶ a, lower panels). The average I/σ(I) values for twin domain 1 and twin domain 2 were 9.4 and 4.9, respectively, for the galactose complex crystal; those for the DGJ complex crystal were 9.2 and 5.1, respectively (Table 1 ▶). The b*c* planes are common between the twin domains and only the a* axes are oriented in slightly different directions by about 4° (Fig. 3 ▶ b). Hence, the degree of overlap mostly depends on the index h and is independent of the indices k and l. Simulated reciprocal lattices showing the a*c* planes of the twin domains are shown in Fig. 4 ▶(a) and the corresponding diffraction images are shown in Fig. 4 ▶(b). To analyse the degree of overlap, the distances to the neighbouring reciprocal-lattice point from the other twin domain are plotted against the index h (Fig. 4 ▶ c). The overlap is a periodical function of h, and apparent twin indices of 8 or 9, which are higher than Mallard’s empirical limit of 6 (Le Page, 2002 ▶), and obliquity angles of 0.02° (galactose complex) and 0.08° (DGJ complex) were observed. This twinning is very similar to that of the crystal of l-2-haloacid dehalogenase from Sulfolobus tokodaii (Rye et al., 2007 ▶). About 11% of the reflections are estimated to be heavily overlapped and the average intensities of the measured reflections show modulation arising from the contribution from the alternative lattice (Figs. 4 ▶ d and 4 ▶ e; black filled circles). We therefore decided to detwin the data, but the deconvolution of partially overlapped reflections during data processing is not yet possible with standard software for protein crystallography. We undertook a detwinning procedure to improve the data, described below. The measured intensities can be obtained using the following equations:
where I T1 and I T2 are the measured intensities of the alternative lattices, I 1 and I 2 are the detwinned intensities and α and q(h) are the twinning fraction and the overlap (Yeates, 1997 ▶). We estimated q(h) using the following equations based on the assumption that q(h) is a function of the distance between the closest reciprocal-lattice point,
where t is the threshold distance of overlap and d is the distance between the closest reciprocal-lattice points. t and α were optimized based on the free R factor that was obtained using REFMAC with the detwinned data. The optimized α were 0.25 and 0.40 for the galactose complex and the DGJ complex crystals, respectively. This detwinning procedure worked well as the averages of the detwinned intensities show no clear modulation (Figs. 4 ▶ d and 4 ▶ e; red triangles). In addition, the model was refined well against the detwinned data, with a 1% decrease in the free R factor (from 23.0% to 22.0% for the galactose complex crystals and from 23.3 to 21.8% for the DGJ complex crystals). The Matthews coefficient (Matthews, 1968 ▶) was calculated to be 2.57 Å3 Da−1, which corresponds to four β-Gal molecules per asymmetric unit and a solvent content of 52.2%. Currently, structural analyses of both complexes are in progress and the details will be reported elsewhere.
Figure 2.
A β-Gal–galactose crystal in the cryoloop used for data collection.
Figure 3.
Image showing the alternative lattices. (a) Diffraction pattern showing the a*b* planes, with the area shown in the lower panels indicated by a white box. Predicted reflection positions of the alternative lattices twin domain 1 and twin domain 2 are shown in the lower left and right panels, respectively. (b) Schematic representation of the two alternative lattices of the β-Gal crystal viewed along the b axis. The real and reciprocal lattices are indicated in black and red, respectively.
Table 1. Data-collection statistics.
Values in parentheses are for the highest resolution shell (1.83–1.80 Å).
| Galactose complex | DGJ complex | |||
|---|---|---|---|---|
| Twin domain 1 | Twin domain 2 | Twin domain 1 | Twin domain 2 | |
| No. of crystals | 1 | 1 | ||
| X-ray source | PF NW12A | PF NW12A | ||
| Wavelength (Å) | 1.0000 | 1.0000 | ||
| Rotation range per image (°) | 1.0 | 1.0 | ||
| Total rotation range (°) | 180 | 180 | ||
| Resolution range (Å) | 30.0–1.8 | 30.0–1.8 | 30.0–1.8 | 30.0–1.8 |
| Space group | P21 | P21 | P21 | P21 |
| Unit-cell parameters | ||||
| a (Å) | 94.7 | 94.7 | 94.7 | 94.7 |
| b (Å) | 116.1 | 116.0 | 116.0 | 116.0 |
| c (Å) | 140.4 | 140.3 | 140.1 | 140.1 |
| β (°) | 92.3 | 92.2 | 92.2 | 92.2 |
| No. of measured reflections | 914683 | 911614 | 922816 | 914287 |
| No. of unique reflections | 267816 | 269376 | 268799 | 268678 |
| Multiplicity | 3.4 (3.1) | 3.4 (3.1) | 3.4 (3.1) | 3.4 (3.1) |
| Average I/σ(I) | 9.4 (3.2) | 4.9 (2.1) | 9.2 (3.0) | 5.1 (2.1) |
| Completeness (%) | 95.7 (88.8) | 96.4 (90.6) | 96.4 (90.6) | 96.3 (90.7) |
| Rmerge† | 0.095 (0.366) | 0.175 (0.527) | 0.099 (0.391) | 0.169 (0.529) |
R
merge = 
 .
.
Figure 4.
Twin analyses. (a) Simulated pattern showing a k = constant reciprocal-space section. Reciprocal-lattice points of twin domains 1 and 2 are shown as black and red points, respectively. (b) Observed diffraction pattern showing the (h1l) zone corresponding to the simulated pattern in (a). Predicted reflection positions of twin domains 1 and 2 are shown in the middle and right panels, respectively. (c) The distances between neighbouring reciprocal-lattice points from alternative lattices are plotted against the index h. (d, e) The average intensities of the measured (black filled circles) and the detwinned (red triangles) intensities for the galactose complex crystal (d) and the DGJ complex crystal (e), respectively, plotted against the index h.
References
- Alpers, D. H. (1969). J. Biol. Chem. 244, 1238–1246. [PubMed]
- Asp, N. G. & Dahlqvist, A. (1972). Anal. Biochem. 47, 527–538. [DOI] [PubMed]
- Callahan, J. W. (1999). Biochim. Biophys. Acta, 1455, 85–103. [DOI] [PubMed]
- Distler, J. J. & Jourdian, G. W. (1973). J. Biol. Chem. 248, 6772–6780. [PubMed]
- Henrissat, B. (1991). Biochem. J. 280, 309–316. [DOI] [PMC free article] [PubMed]
- Hoogeveen, A. T., Graham-Kawashima, H., d’Azzo, A. & Galjaard, H. (1984). J. Biol. Chem. 259, 1974–1977. [PubMed]
- Hoogeveen, A. T., Reuser, A. J., Kroos, M. & Galjaard, H. (1986). J. Biol. Chem. 261, 5702–5704. [PubMed]
- Hoogeveen, A. T., Verheijen, F. W. & Galjaard, H. (1983). J. Biol. Chem. 258, 12143–12146. [PubMed]
- Le Page, Y. (2002). J. Appl. Cryst. 35, 175–181.
- Matthews, B. W. (1968). J. Mol. Biol. 33, 491–497. [DOI] [PubMed]
- McCarter, J. D., Burgoyne, D. L., Miao, S., Zhang, S., Callahan, J. W. & Withers, S. G. (1997). J. Biol. Chem. 272, 396–400. [DOI] [PubMed]
- Oshima, A., Tsuji, A., Nagao, Y., Sakuraba, H. & Suzuki, Y. (1988). Biochem. Biophys. Res. Commun. 157, 238–244. [DOI] [PubMed]
- Oshima, A., Yoshida, K., Shimmoto, M., Fukuhara, Y., Sakuraba, H. & Suzuki, Y. (1991). Am. J. Hum. Genet. 49, 1091–1093. [PMC free article] [PubMed]
- Otwinowski, Z. & Minor, W. (1997). Methods Enzymol. 276, 307–326. [DOI] [PubMed]
- Rye, C. A., Isupov, M. N., Lebedev, A. A. & Littlechild, J. A. (2007). Acta Cryst. D63, 926–930. [DOI] [PubMed]
- Spoel, A. van der, Bonten, E. & d’Azzo, A. (2000). J. Biol. Chem. 275, 10035–10040. [DOI] [PubMed]
- Suzuki, Y. (2006). J. Inherit. Metab. Dis. 29, 471–476. [DOI] [PubMed]
- Winn, M. D. et al. (2011). Acta Cryst. D67, 235–242.
- Yamamoto, Y., Hake, C. A., Martin, B. M., Kretz, K. A., Ahern-Rindell, A. J., Naylor, S. L., Mudd, M. & O’Brien, J. S. (1990). DNA Cell Biol. 9, 119–127. [DOI] [PubMed]
- Yeates, T. O. (1997). Methods Enzymol. 276, 344–358. [PubMed]
- Yoshida, K., Oshima, A., Shimmoto, M., Fukuhara, Y., Sakuraba, H., Yanagisawa, N. & Suzuki, Y. (1991). Am. J. Hum. Genet. 49, 435–442. [PMC free article] [PubMed]


