Abstract
Heparin glycosaminoglycans (GAGs) present the most difficult glycoform for analytical characterization due to high levels of sulfation and structural heterogeneity. Recent contamination of the clinical heparin supply and subsequent fatalities has highlighted the need for sensitive methodologies of analysis. In the last decade, tandem mass spectrometry has been increasingly applied for the analysis of GAGs, but developments in the characterization of highly sulfated compounds have been minimal due to the low number of cross-ring cleavages generated by threshold ion activation by collisional induced dissociation (CID). In the current work, electron detachment dissociation (EDD) and infrared multiphoton dissociation (IRMPD) are applied to a series of heparin tetrasaccharides. With both activation methods, abundant glycosidic and cross-ring cleavages are observed. The concept of Ionized Sulfate Criteria (ISC) is presented as a succinct method for describing the charge state, degree of ionization and sodium/proton exchange in the precursor ion. These factors contribute to the propensity for useful fragmentation during MS/MS measurements. Precursors with ISC values of 0 are studied here, and shown to yield adequate structural information from ion activation by EDD or IRMPD.
INTRODUCTION
The analytical characterization of sulfated glycosaminoglycan (GAG) carbohydrates has remained topical. Sulfated GAGs are linear, acidic biopolymers that are synthesized through a non-template driven mechanism. This mechanism results in high polydispersivity in natural samples and presents a challenging system for analytical characterization. Of the established glycoform classes, the heparin and heparan sulfates are the most diverse, demonstrating high variability in sites of O-sulfation, N-sulfation or N–acetylation, and hexuronic acid stereochemistry. Specifically, heparin has posed a daunting challenge for direct analysis since its discovery nearly 100 years ago, due to its high molecular weight (Mw: range 5 kDa – 40 kDa, average 15 kDa) [1] and polydispersity. Heparin is known to interact with a variety of proteins [1] via domains with specific sequence motifs such as the pentasaccharide sequence for heparin binding to antithrombin III [2, 3].
The characterization of heparin is of vital importance to clinical applications as an anticoagulant through its inhibition of serine proteases in the blood coagulation cascade [1]. Recently, the heparin market suffered a contamination crisis, resulting in several fatalities. The source of the contaminant was traced to a highly sulfated chondroitin sulfate with similar physical-chemical properties to heparin that was not identified using the quality control protocols in place at the time [4]. In light of this event, additional sensitive methods are needed to determine any impurities within heparin.
The purification of heparin oligosaccharides and subsequent characterization by 2-D NMR has been applied to heparin chains having a degree of polymerization (dp) 2 to 40 [5]. NMR was also shown to effectively differentiate heparin from over-sulfated chondroitin sulfate during the contamination crisis based on unique signals generated by the N-acetyl group found in chondroitin [4]. Historically, the characterization of heparin has been conducted at the oligosaccharide level by preparation with heparin lyases [6] and separation by liquid chromatography [7, 8] or capillary zone electrophoresis [9].
Mass spectrometry-based analysis has followed digestion and purification by the abovementioned methods, eliminating the need for chemical modification of the analyte, a common preliminary step for separation. Both MALDI-MS [10] and ESI-MSn [11–16] methods have been developed for small heparin oligomers. MALDI-MS in combination with enzymology has presented a powerful approach for structural analysis due to the charge-deconvoluted nature of MALDI and sensitivity (~ fmol), but requires the non-covalent complexation with a peptide to ionize in positive ion mode [10, 17, 18]. ESI-MS approaches have provided the ability to ionize heparin and other sulfated GAGs directly into the negative ion mode, producing high charge states while retaining the labile sulfate groups. Ion traps have largely been employed for these efforts to conduct CID-MSn and oliogmer lengths have varied from disaccharide to octasaccharide with a combination of enzymatic steps [11–16].
Several difficulties exist in the MS-based analysis of highly sulfated GAGs. The first is the polydisperse nature of GAGs, which results in a complex mixture of chain lengths and sulfation states, but can be resolved by chromatographic methods before ionization. The second is MS-level heterogeneity due to Na/H exchange [19], which results in the division of a single GAG chain into many mass channels. This effect is especially pronounced in highly sulfated GAGs such as heparin where the degree of Na/H exchange can match or exceed the number of sulfate half esters present in a chain. Lastly, it is difficult to ionize all of the sulfates on a given oligosaccharide due to charge repulsion from having more than one ionized site in a given residue. It is well known in the ESI-MS of GAGs that all sulfate half esters should be ionized and/or paired with a metal counter ion to reduce the facile loss of the modification as SO3 through H-rearrangement [20]. Therefore, the ESI solvent conditions should be adjusted such that Na exchange can occur at an acceptable level to produce a suitable precursor ion yet not to the point of reducing the ionization efficiency.
Tandem mass spectrometry can be employed to locate the sites of sulfation in highly sulfated GAGs, but difficulty arises when assignment of the hexuronic acid stereochemistry is needed. Previously, electron detachment dissociation (EDD) [21] has demonstrated a duality in GAG ion activation [22] where sites of sulfation and hexuronic acid stereochemistry could be determined during a single tandem mass spectrometry experiment when applied to heparan sulfate tetrasaccharides [23]. The proposed mechanism for the generation of stereo-specific products by EDD is based on detachment from a carboxylate, and it becomes difficult to find conditions that allow ionization of this more weakly acidic functional group as the sulfate density increases. Fortunately, a correlation between 2-O-sulfation and hexuronic acid stereochemistry has been demonstrated that can assist in the stereochemical assignment [24]. Although heparin may contain either IdoA or GlcA, the dominant disaccharide repeat unit is (IdoA2S-GlcNS6S). The IdoA constituents are typically substituted with 2-O-sulfo group whereas the GlcA residues are not [24]. Knowledge of sample origin is critical, though, as murine mastocytoma heparan sulfate has been demonstrated to contain 2-O-sulfo GlcA residues, but this residue has not been found in porcine intestinal muscosa heparin [25].
The following work has extended the application of EDD and infrared multiphoton dissociation (IRMPD) in GAG oligosaccharides to heparin tetrasaccharides derived from porcine mucosa. The selection of a precursor ion for MS/MS activation where all sulfates are ionized or paired with a metal counter ion minimizes the loss of sulfo groups as SO3 and subsequent fragmentation by either method is shown to provide sufficient provide ion suites for the assignment of sulfate position, except in the hexasulfated tetrasaccharide case (GlcNS6S-IdoA2S) where the question of 3-O- or 6-O-sulfation remains (although the occurrence of 3-O-sulfo groups is infrequent when compared to 6-O-sulfo groups, occurring at 1 in 50 GlcN residues [25]). Based on the knowledge of sample origin, hexuronic acid stereochemistry can be determined by the assignment of 2-O-sulfo group substitution from cross-ring cleavage product ions. Conversely, the absence of 2-O-sulfo groups cannot be used to definitively assign GlcA as the occurrence of un-sulfated IdoA is approximately 10 % in heparin [25].
EXPERIMENTAL METHODS
Heparin Oligosaccharide Preparation
Heparin sodium salt (6 g), derived from porcine intestinal mucosa (Celsus Laboratories, Cincinnati, OH), was partially depolymerized with recombinant heparinase 1 (E.C. 4.2.2.7) from F. heparinum to 30 % completion, as determined by ultraviolet absorbance at 232 nm, at which point the digestion was quenched by boiling. The oligosaccharide mixture was concentrated on a rotary evaporator, filtered through a 0.22 μm filter, and separated on a 1.5 m × 5.0 cm Bio-Gel P10 column (BioRad, Hercules, CA). The oligosaccharides were eluted at 1.2 mL/min with 0.2 M NaCl. Size-fractionated oligosaccharides were further separated by HPLC on a 2.0 cm × 25 cm semi-preparative strong anion exchange (SAX) column (Waters Spherisorb S5, Milford, MA) using a 60- minute salt gradient at a flow rate of 4.0 mL/min with absorbance detection at 232 nm [5]. Purity of HPLC-separated oligosaccharides was assessed using a 46 mm × 250 mm SAX column (Waters Spherisorb, 5 μm) and additional semi-preparative purification was carried out when necessary to achieve > 95 % purity. All oligosaccharides used in the present work were determined to be > 95 % pure by analytical SAX-HPLC, PAGE analysis, RPIP-HPLC-ESI-MS, high resolution MS, and 1D and 2D NMR [24].
Mass Spectrometry Analysis
Experiments were performed with a 9.4 T Bruker Apex Ultra QeFTMS (Billerica, MA) fitted with an MTP dual ion source, 25 W CO2 laser (Synrad model J48-2, Mukilteo, WA) for IRMPD, and an indirectly heated hollow cathode (HeatWave, Watsonville, CA) to generate electrons for EDD. The sample solutions were infused at a rate of 120 μL/hour and ionized by electrospray using a metal capillary (Agilent Technologies, Santa Clara, CA, #G2427A) or at 10 μL/hour and ionized by nanospray (pulled fused silica tip model FS360-75-15-D-20; New Objective, Woburn, MA, USA). Based on the extent of sulfation and desired charge state or degree of sodiation, the ESI solvent was varied. Solutions of each tetrasaccharide were introduced at a concentration of 0.1–0.2 mg/mL in aqueous methanol with the addition of 1 % 100 μM NaOH to generate sodium adduct ions. All tetrasaccharides were examined in negative ion mode.
For EDD experiments, precursor ions were isolated in the external quadrupole and accumulated for 1–3 seconds in an RF-only hexapole before injection into the FT-ICR MS cell. One or two quadrupole isolation/analyzer cell fills were utilized per scan. The selection of the precursor ion was further refined by using in-cell isolation with a coherent harmonic excitation frequency (CHEF) event [26]. For electron irradiation the cathode bias was set to −19 V. The extraction lens was set to −18.5±0.1 V, and the cathode heater was set to 1.5 A. The precursor ions were then irradiated with electrons for 1 second. 24–36 acquisitions were signal averaged per mass spectrum. IRMPD was conducted with a 25 W CO2 laser (Synrad model J48-2, Mukilteo, WA). Ions were irradiated for 0.025 s to 0.075 s at 65 % laser attenuation.
For each mass spectrum, 1M points were acquired, padded with one zero fill, and apodized using a sinebell window. Background spectra were acquired by leaving all parameters the same but setting the cathode bias to 0 V to ensure that no electrons reached the analyzer cell. External calibration of mass spectra produced mass accuracy of 5 ppm. Internal calibration was also performed using confidently assigned glycosidic bond cleavage products as internal calibrants, providing mass accuracy of <1 ppm. Due to the large number of low intensity products formed by EDD, only peaks with S/N > 10 are reported. Product ions were assigned using accurate mass measurement and Glycoworkbench version 2.0 [27], which predicts the masses of conventional fragment ions (A, B, C, X, Y, Z), with and without SO3 losses, for a given carbohydrate structure.
All product ions are reported using the annotation proposed by Wolff and Amster [29], derived from the Domon and Costello nomenclature [30], in which a prime or double prime next to the product type indicates the loss of one or two atoms of hydrogen from the conventional glycosidic fragment. Fragmentation is illustrated in the molecular structure drawings with dashed lines. The slanted line at the top or bottom of the dashed line is used to indicate reducing end or non-reducing end products, respectively. Single and double hash marks across the slanted line indicate an additional loss of 1 or 2 hydrogen atoms from the conventional glycosidic fragments. To denote sulfate decomposition accompanying glycosidic or cross-ring cleavage, an open circle placed at the end of a slanted line indicates the loss of one SO3 from a sulfate half ester, while a filled circle is used to show a loss of 2 or more equivalents of SO3. An integer placed next to a slanted line indicates the number of sodium ions that are replacing protons in the denoted fragment ion. In annotated spectra, the charge states of all ions are 1- unless otherwise indicated.
RESULTS AND DISCUSSION
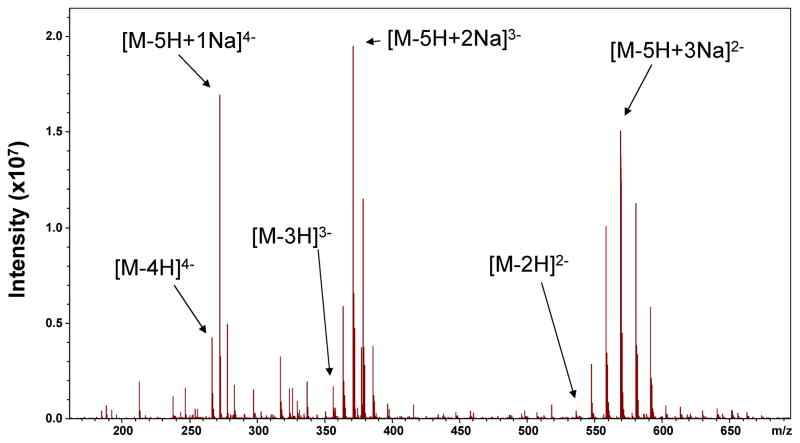
Highly sulfated GAG oligosaccharides readily form ionic salts (e.g. sodium). This chemistry introduces additional heterogeneity at the MS level shown in Figure 1. In purified compounds, this splits the ion signal between many channels, reducing the intensity in of any single precursor for tandem mass spectrometry. Sodium/proton exchange often occurs in the capillary used to infuse the sample into the electrospray source. The addition of 0.1 % formic acid has been shown to reduce this heterogeneity in CS glycoforms [29], but has limited success when applied to highly sulfated heparin oligosaccharides. Conveniently, the affinity for sodium is beneficial in that it enables the generation of precursor ions where the total number of ionized sites, including those with sodium counter-ions, equals the number of sulfate groups. To reduce SO3 loss during MS/MS of sulfated GAGs, it is desirable that all sulfate groups are ionized; however, when multiple sites of sulfation are present on one hexose ring, ionization of both sites is energetically unfavorable due to charge repulsion; sodium cationization fulfills the need for having an ionized sulfate group while reducing the charge repulsion between anionic sites.
FIGURE 1.
MS of the pentasulfated heparin tetrasaccharide, T1, demonstrating spectral heterogeneity due to charge state variation and sodium exchange.
To succinctly convey this concept, we define a value called the “ionized sulfate criteria” (ISC). The ISC value of a GAG precursor ion is calculated by the difference in total sites of sulfation subtracted from the summed number of charges and sodium counter-ions. Positive ISC values correspond to precursor ions for which the number of ionized sites (including those with sodium counterions) exceeds the number of sulfate groups; in such cases, at least one uronic acid carboxyl group is ionized. Precursor ions with negative ISC values do not guarantee this, and given the higher acidity of sulfonic acid, most likely have a mix of ionized and protonated sulfate groups, and no ionized carboxyl groups. A precursor ion with an ISC value of zero has an equal number of ionized sites (including those with sodium counterions) as there are sulfate groups. For example, a pentasulfated GAG ion with a charge state of 4 and 1 Na ion, would have an ISC of 0, that is, 5−(4+1) = 0. Increasing the ISC to 1, by selecting a higher charge state or an ion with an additional sodium, would require an ionized site on a carboxyl group and introduce the potential for EDD generated products that differentiate GlcA from IdoA. An ISC of < 1 would leave a protonated sulfate moiety, increasing the potential for loss as SO3. Due to charge repulsion in highly sulfated GAGs, it is difficult to produce precursor ions with positive ISC values. In the current work, precursor ions are selected with an ISC of 0 to minimize sulfate loss. In future work where sulfate densities are reduced, precursor ions with ISC values greater than 0 will be studied.
T1 (ΔUA2S-GlcNS6S-GlcA-GlcNS6S)
Based on the MS data presented in Figure 1, three potential precursors ions are available where the precursor ion satisfies the ISC = 0. The EDD activation of each precursor state enables the evaluation of the degree of ionization/sodiation for highly sulfated tetrasaccharides. Additional threshold activation by IRMPD is made for comparison in certain cases.
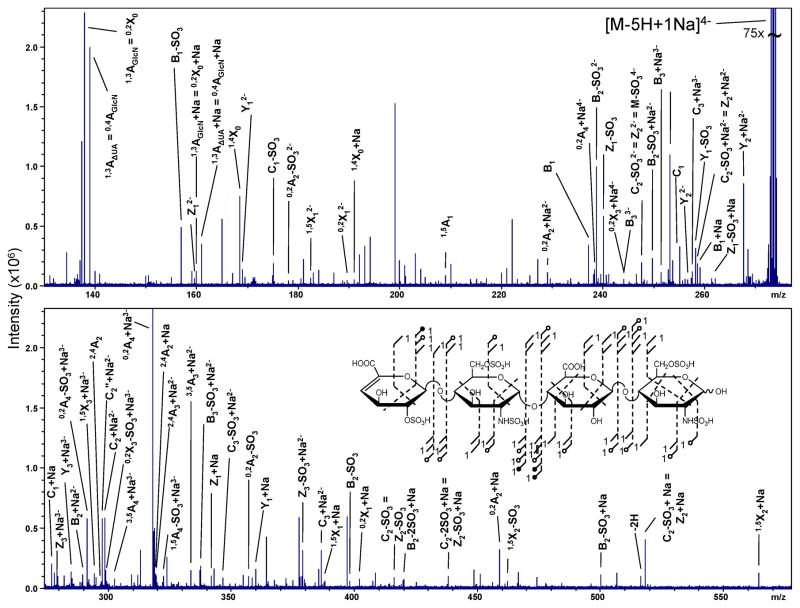
The highest degree of ionization for a tetrasaccharide without introducing charge repulsion effects is achieved at 4−. With four ionized sites, it is hypothesized that an ionized site will exist on each hexose ring. For T1 containing five sulfates, the addition of one Na+ ions satisfies the ISC = 0. The EDD of this precursor ion, [M-5H+1Na]4−, is shown in Figure 2. Abundant glycosidic and cross-ring bond cleavage products are observed, ranging in charge state from 1− to 4−. The masses of glycosidic bond cleavages can be utilized to deduce the location of sites of sulfation as follows: one on the non-reducing hexuronic acid, two on the central glucosamine, and two on the reducing end glucosamine.
FIGURE 2.
EDD spectrum of tetrasaccharied,T1. Structural inset denotes the assigned product ions. The annotations used to represent fragmentation types in the structure are defined at the end of the Experimental Methods.
The knowledge of sample origin in combination with an accurate mass measurement of the precursor ion can directly assign the positions of three sulfate groups. On hexuronic acid residues, only 2-O-sulfo groups are known to occur and the difference in precursor ion mass due to N-sulfo modification instead of N-acetylation assigns the second and third positions. The remaining two sites of sulfation cannot be assigned directly at the MS level, even though it is highly likely that 6-O-sulfation occurs on both glucosamine residues based on the known 1–4 glycosidic bond linkage in heparin oligosaccharides and rare occurrence of 3-O-sulfation. Cross-ring cleavage assignments can validate this hypothesis. The assignment of 6-O-sulfation on the reducing end glucosamine can be confirmed by the generation of the 2,4X0 cross-ring product as well as the 3,5A4 ion. The occurrence of 6-O-sulfation on the central glucosamine can be assigned by the difference in mass due to SO3 between the 0,2A2 and 2,4A2 cross-ring products.
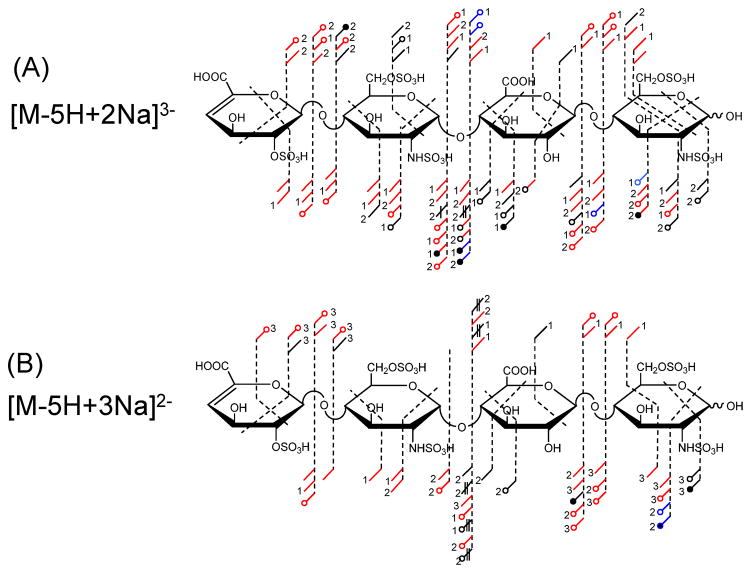
As described previously, two other ions, [M-5H+2Na]3− and [M-5H+3Na]2− satisfy the ISC = 0. The annotated structures indicating both EDD and IRMPD fragmentation [31] for each precursor are shown in Figure 3. A precursory examination of both Figure 3A and 3B reveal that EDD and IRMPD generate the previously denoted product ions employed to assign the five sites of sulfation in T1. When the product ion sets are compared based on activation method, the majority of assigned products are observed in both EDD and IRMPD spectra (indicated by red) with additional cross-ring (1,5X and 1,5A) and glycosidic bond cleavages with the loss of 1H or 2H present only in the EDD data set (black). This observation is consistent with prior results in DS GAGs where threshold activation products were shown to be a subset of EDD [31].
FIGURE 3.
Annotated structures denoting the assigned EDD and IRMPD product ions for the [M-5H+2Na]3− AND [M-5H+3Na]2− precursor ions of tetrasaccharide, T1.
Consistent behavior is observed in Figure 3B for the [M-5H+3Na]2− where both EDD and IRMPD can be employed independently to locate the five sites of sulfation, although the absolute number of cleavages is reduced when compared to the discussed 4− and 3− precursor ions. This decrease in observed fragmentation with increasing sodium exchange has been documented in both DS [29] and HS GAG oligosaccharides [32]. The addition of the Na+ counter-ion reduces the number of sulfate loss fragments, but concurrently eliminates fragment ions that are presumably due to the presence of an ionized site.
T2 (ΔUA2S-GlcNS6S-IdoA2S-GlcNS)
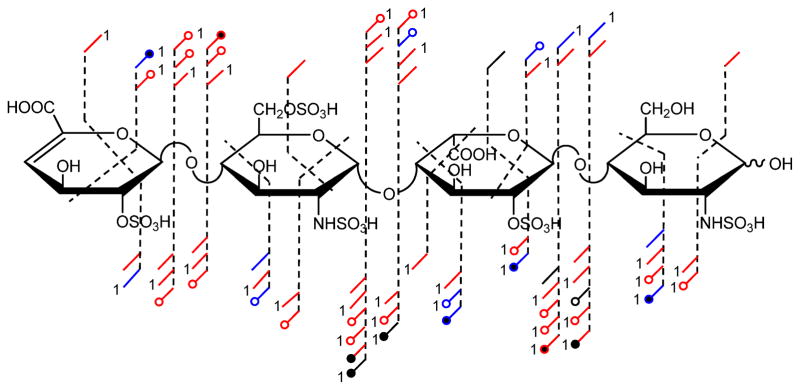
Based on the evaluation of the observed decrease in product ions with increasing sodium exchange for T1, the [M-5H+1Na]4− precursor ion was activated for T2. Both T1 and T1 are penta-sulfated, but T2 is sulfated on the IdoA residue and only N-sulfated on the reducing end (RE) glucosamine. This sulfation sequence is one sulfate group less than that of the typical heparin disaccharide repeat which will be examined in the following section. Depicted in Figure 4, are product ions assigned for EDD and/or IRMPD. Examination of the product ions generated by both activation methods reveals that sufficient cleavages are generated to locate all of the sulfation sites by a combination of glycosidic and cross-ring cleavages by the reductive method utilized in the prior section. Although the loss of SO3 is observed in the majority of product ions, in only one case (0,2X3) is the sulfate-intact ion not observed. Losses of 2 sulfate groups are largely observed from glycosidic bonds for both activation methods and only for IRMPD generated cross-ring cleavages.
FIGURE 4.
Annotated structure indicating the assigned EDD and IRMPD products ions from the activation of the [M-5H+1Na]4− precursor ion for pentasulfated heparin tetrasaccharide, T2.
T3 (ΔUA2S-GlcNS6S-IdoA2S-GlcNS6S)
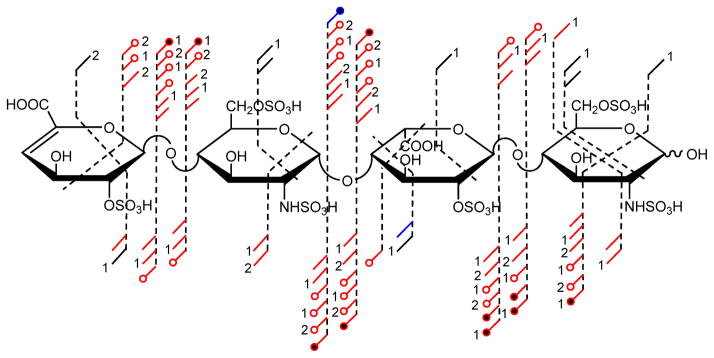
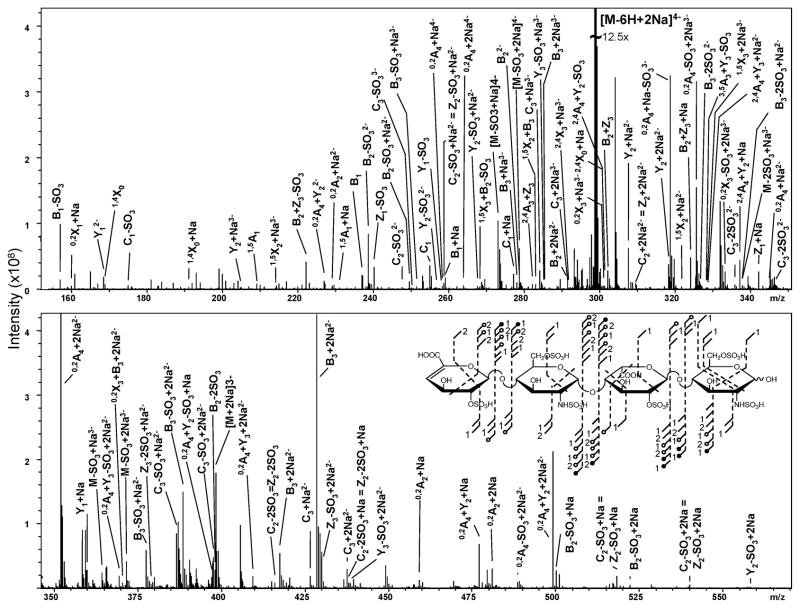
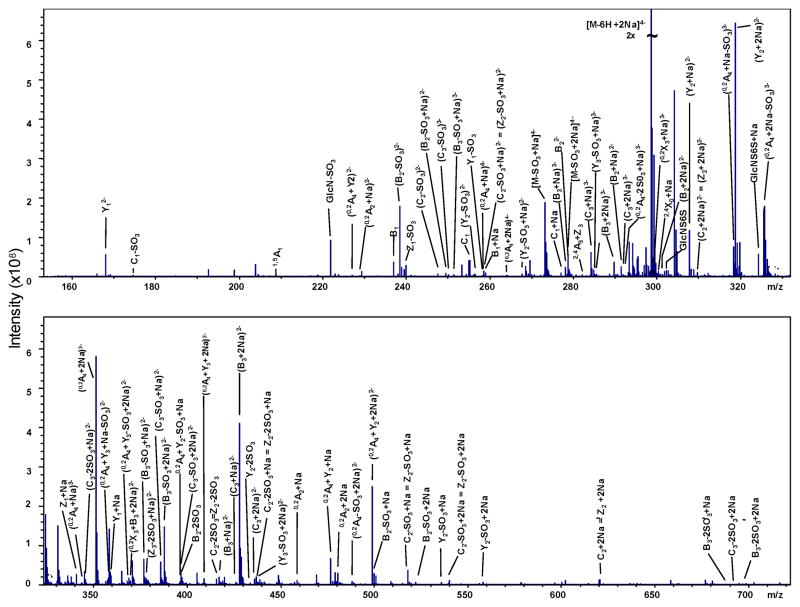
The highest degree of sulfation examined to date by EDD and/or IRMPD is the tri-sulfated disaccharide repeat unit present in T3. This increase in sulfation introduced further heterogeneity at the MS level when compared to T1 or T2, but precursor ions still exist where the ISC = 0. Shown in Figure 5 are the product ions assigned due to activation by both EDD and IRMPD of the [M-6H+2Na]4− ion. An annotated spectrum for the EDD of T3 is shown in Figure 6 and for IRMPD is shown in Figure 7. Consistent with results in samples T1 and T2, the majority of product ions are consistent within both activation types.
FIGURE 5.
Annotated structure indicating the assigned EDD and IRMPD products ions from the activation of the [M-6H+2Na]4− precursor ion for hexasulfated heparin tetrasaccharide, T3.
FIGURE 6.
Annotated EDD spectrum of the [M-6H+2Na]4− precursor ion for tetrasaccharide T3.
FIGURE 7.
Annotated IRMPD spectrum of the [M-6H+2Na]4− precursor ion for tetrasaccharide T3.
Both IRMPD and EDD result in the cleavage of all glycosidic bonds. In either case, each glycosidic bond product ion is paired with at least one sulfate loss with the number increasing to two losses as the fragment length is increased. As described previously, when the number of sulfation sites increases for a given oligomer length, the possible structures decreases due to the finite number of O-sulfo possibilities. Analysis of glycosidic bond cleavage products places 1 sulfate on each hexuronic acid and 2 sulfates on each glucosamine, which by accurate mass is known to be N-sulfo. Location of the O-sulfo group on the RE N-sulfo-glucosamine can be established by the occurrence of 2,4X0 in both EDD and IRMPD. Due to the lack of additional cross-ring cleavage on the central N-sulfo-glucosamine, the exact location to 6-O-sulfation cannot be determined by MS/MS, but is known due to complimentary NMR data. Subtle differences do exist between the two data sets, such as the occurrence of a 1,5X cleavage on each hexose ring in only EDD and additional losses of sulfates as SO3 in IRMPD.
Determination of Hexuronic Acid Stereochemistry
In the examined tetrasaccharides, the ability of EDD to assign the hexuronic acid stereochemistry has not been fully realized. Due to the distribution of ion signal between many product ion channels, many are low intensity. The previous indicators of hexuronic acid stereochemistry, e.g. B3’, B3’-CO2, nor 0,2A3 are not assigned in T2 (GlcA) nor C3” in T1 or T3 (both containing IdoA). The EDD of a sufficiently desulfated precursor produced by solvolytic means may result in that determination [32], but insight can be achieved by known biology where 2-O-sulfation is known to only occur on iduronic acid residues [24]. The generation of sufficient cross-ring cleavage on hexuronic acid residues can lead to the assignment of 2-O-sulfation as shown in T1 and T3; therefore, in combination with the known biology, IdoA can be inferred.
CONCLUSIONS
The selection of the appropriate precursor ion for the tandem mass spectrometry of GAG oligosaccharides is critical to the generation of informative mass spectra. This case is especially true in highly sulfated GAGs such as heparin. To minimize sulfate loss as SO3 and maximize the number of product ions observed, the highest charge state should be selected with the minimal number of sodium counter-ions (if needed). Slight differences in the product ion distributions generated by EDD and IRMPD are observed, but both provide sufficient information to locate sites of sulfation. This result contradicts prior results in ion trap mass spectrometers where CID proved to generate minimal bond cleavage in highly sulfated GAGs. Although previous detachment generated products are not observed, the combination of the knowledge of sulfate location and sample origin can be utilized to some extent to identify hexuronic acid stereochemistry.
Supplementary Material
Acknowledgments
The authors would like to acknowledge Professor John Eyler for his contributions to FTMS, tandem mass spectrometry, and the structural analysis of carbohydrates. The authors gratefully acknowledge financial support from the National Institutes of Health grant #2R01-GM038060-16. FEL III personally acknowledges the University of Georgia Graduate School for funding from a Dissertation Completion Award.
Footnotes
Publisher's Disclaimer: This is a PDF file of an unedited manuscript that has been accepted for publication. As a service to our customers we are providing this early version of the manuscript. The manuscript will undergo copyediting, typesetting, and review of the resulting proof before it is published in its final citable form. Please note that during the production process errors may be discovered which could affect the content, and all legal disclaimers that apply to the journal pertain.
References
- 1.Capila I, Linhardt RJ. Angew Chem Intl Ed. 2002;41:390. doi: 10.1002/1521-3773(20020201)41:3<390::aid-anie390>3.0.co;2-b. [DOI] [PubMed] [Google Scholar]
- 2.Lindahl U, Backstrom G, Hook M, Thunberg L, Fransson LA, Linker A. Proc Natl Acad Sci U S A. 1979;76:3198. doi: 10.1073/pnas.76.7.3198. [DOI] [PMC free article] [PubMed] [Google Scholar]
- 3.Lindahl U, Kusche-Gullberg M, Kjellen L. J Biol Chem. 1998;273:24979. doi: 10.1074/jbc.273.39.24979. [DOI] [PubMed] [Google Scholar]
- 4.Guerrini M, Beccati D, Shriver Z, Naggi A, Viswanathan K, Bisio A, Capila I, Lansing JC, Guglieri S, Fraser B, Al-Hakim A, Gunay NS, Zhang Z, Robinson L, Buhse L, Nasr M, Woodcock J, Langer R, Venkataraman G, Linhardt RJ, Casu B, Torri G, Sasisekharan R. Nat Biotech. 2008;26:669. doi: 10.1038/nbt1407. [DOI] [PMC free article] [PubMed] [Google Scholar]
- 5.Pervin A, Gallo C, Jandik KA, Han X-J, Linhardt RJ. Glycobiology. 1995;5:83. doi: 10.1093/glycob/5.1.83. [DOI] [PubMed] [Google Scholar]
- 6.Lohse DL, Linhardt RJ. J Biol Chem. 1992;267:24347. [PubMed] [Google Scholar]
- 7.Bienkowski MJ, Conrad HE. J Biol Chem. 1985;260:356. [PubMed] [Google Scholar]
- 8.Guo Y, Conrad HE. Anal Biochem. 1989;176:96. doi: 10.1016/0003-2697(89)90278-9. [DOI] [PubMed] [Google Scholar]
- 9.Ampofo SA, Wang HM, Linhardt RJ. Anal Biochem. 1991;199:249. doi: 10.1016/0003-2697(91)90098-e. [DOI] [PubMed] [Google Scholar]
- 10.Venkataraman G, Shriver Z, Raman R, Sasisekharan R. Science. 1999;286:537. doi: 10.1126/science.286.5439.537. [DOI] [PubMed] [Google Scholar]
- 11.Saad OM, Leary JA. Anal Chem. 2003;75:2985. doi: 10.1021/ac0340455. [DOI] [PubMed] [Google Scholar]
- 12.Saad OM, Leary JA. J Am Soc Mass Spectrom. 2004;15:1274. doi: 10.1016/j.jasms.2004.05.008. [DOI] [PubMed] [Google Scholar]
- 13.Saad OM, Ebel H, Uchimura K, Rosen SD, Bertozzi CR, Leary JA. Glycobiology. 2005;15:818. doi: 10.1093/glycob/cwi064. [DOI] [PubMed] [Google Scholar]
- 14.Saad OM, Leary JA. Anal Chem. 2005;77:5902. doi: 10.1021/ac050793d. [DOI] [PubMed] [Google Scholar]
- 15.Sweeney MD, Yu Y, Leary JA. J Am Soc Mass Spectrom. 2006;17:1114. doi: 10.1016/j.jasms.2006.04.025. [DOI] [PubMed] [Google Scholar]
- 16.Zaia J, Costello CE. Anal Chem. 2003;75:2445. doi: 10.1021/ac0263418. [DOI] [PubMed] [Google Scholar]
- 17.Juhasz P, Biemann K. Proc Natl Acad Sci U S A. 1994;91:4333. doi: 10.1073/pnas.91.10.4333. [DOI] [PMC free article] [PubMed] [Google Scholar]
- 18.Juhasz P, Biemann K. Carbohydr Res. 1995;270:131. doi: 10.1016/0008-6215(94)00012-5. [DOI] [PubMed] [Google Scholar]
- 19.Chi L, Wolff JJ, Laremore TN, Restaino OF, Xie J, Schiraldi C, Toida T, Amster IJ, Linhardt RJ. J Am Chem Soc. 2008;130:2617. doi: 10.1021/ja0778500. [DOI] [PMC free article] [PubMed] [Google Scholar]
- 20.Zaia J. Journal of Biomolecular Mass Spectrometry. 2005;1:3. [Google Scholar]
- 21.Budnik BA, Haselmann KF, Zubarev RA. Chem Phys Lett. 2001;342:299. [Google Scholar]
- 22.Wolff JJ, Amster IJ, Chi L, Linhardt RJ. J Am Soc Mass Spectrom. 2007;18:234. doi: 10.1016/j.jasms.2006.09.020. [DOI] [PMC free article] [PubMed] [Google Scholar]
- 23.Wolff JJ, Chi L, Linhardt RJ, Amster IJ. Anal Chem. 2007;79:2015. doi: 10.1021/ac061636x. [DOI] [PMC free article] [PubMed] [Google Scholar]
- 24.Xiao Z, Zhao W, Yang B, Zhang Z, Guan H, Linhardt RJ. Glycobiology. doi: 10.1093/glycob/cwq123. [DOI] [PMC free article] [PubMed] [Google Scholar]
- 25.Kusche M, Lindahl U. J Biol Chem. 1990;265:15403. [PubMed] [Google Scholar]
- 26.Heck AJR, de Koning LJ, Pinkse FA, Nibbering NMM. Rapid Commun Mass Spectrom. 1991;5:406. [Google Scholar]
- 27.Ceroni A, Maass K, Geyer H, Geyer R, Dell A, Haslam SM. Journal of Proteome Research. 2008;7:1650. doi: 10.1021/pr7008252. [DOI] [PubMed] [Google Scholar]
- 28.Horn DM, Zubarev RA, McLafferty FW. Proc Natl Acad Sci U S A. 2000;97:10313. doi: 10.1073/pnas.97.19.10313. [DOI] [PMC free article] [PubMed] [Google Scholar]
- 29.Wolff JJ, Laremore TN, Busch AM, Linhardt RJ, Amster IJ. J Am Soc Mass Spectrom. 2008;19:294. doi: 10.1016/j.jasms.2007.10.007. [DOI] [PMC free article] [PubMed] [Google Scholar]
- 30.Domon B, Costello CE. Glycoconjugate J. 1988;5:397. [Google Scholar]
- 31.Wolff JJ, Laremore TN, Busch AM, Linhardt RJ, Amster IJ. J Am Soc Mass Spectrom. 2008;19:294. doi: 10.1016/j.jasms.2007.10.007. [DOI] [PMC free article] [PubMed] [Google Scholar]
- 32.Leach FE, III, Oh HB, Arungundram S, Al-Mafraji K, Venot A, Boons G-J, Amster IJ. 2010 Manuscript Submitted. [Google Scholar]
Associated Data
This section collects any data citations, data availability statements, or supplementary materials included in this article.


