Abstract
This article presents a three-dimensional analytical model to investigate cross-stream diffusion transport in rectangular microchannels with arbitrary aspect ratios under pressure-driven flow. The Fourier series solution to the three-dimensional convection–diffusion equation is obtained using a double integral transformation method and associated eigensystem calculation. A phase diagram derived from the dimensional analysis is presented to thoroughly interrogate the characteristics in various transport regimes and examine the validity of the model. The analytical model is verified against both experimental and numerical models in terms of the concentration profile, diffusion scaling law, and mixing efficiency with excellent agreement (with <0.5% relative error). Quantitative comparison against other prior analytical models in extensive parameter space is also performed, which demonstrates that the present model accommodates much broader transport regimes with significantly enhanced applicability.
Keywords: Cross-stream diffusion, Mixing, Microfluidics, Pressure-driven flow
1 Introduction
Lab-on-a-chip systems hold great promise for a variety of applications in biology, medicine, and chemistry (Aurouz et al. 2002; Reyes et al. 2002; Whitesides 2006). In microfluidic applications, the utilization of the cross-stream diffusion under laminar flow for precise analyte handling plays an essential role in numerous chemical and biological assays such as sample preparation (mixing and separation) (Hatch et al. 2004), concentration gradient generation (Dertinger et al. 2001; Jeon et al. 2000), and molecular interactions (Hatch et al. 2004). In contrast to macro-scale devices, the cross-stream diffusion in the low-Reynolds microchannel flows is governed by molecular diffusion-dominant transport at the interface between the two fluidic streams. The non-uniform velocity profile along the cross-section of the microchannel under the pressure-driven flow results in unique species transport phenomena including Taylor dispersion (Beard 2001a, b; Dorfman and Brenner 2001; Lam et al. 2005), heterogeneous transport rate, and position-dependent diffusion scaling law (Ayodele et al.2009; Ismagilov et al. 2000; Kamholz and Yager 2001, 2002; Salmon and Ajdari 2007), which have been actively investigated by several researchers.
The non-uniform velocity profile induces a substantial difference in the residence time of the analyte at different positions and gives rise to a unique butterfly shaped concentration profile (termed “butterfly effect”) along the cross-section, which was first observed by Kamholz et al. (1999). By using the confocal fluorescent microscopy, Ismagilov et al. (2000) found that the diffusion broadening region near the top and bottom walls of the channel is significantly wider than that at the half-depth of the channel, and the thickness of the diffusion zone scales as one-third power of (zH2/Pe) at the walls and as one-half power of (zH/Pe) at the half-depth plane, where H is the channel depth/height, z is the axial distance from the channel inlet, and Pe is the Péclet number defined using H. Subsequently, Kamholz and Yager (2001, 2002) presented optical measurement and theoretical analysis to investigate transverse molecular diffusion in microchannels and found similar diffusion scaling law. Chen et al. (2006) used conventional microscopy to measure the mixing efficiency along the channel, which also scales as a power law of the ratio of the normalized downstream distance to the average flow velocity. As a non-invasive technique, magnetic resonance imaging (MRI) has also been used to visualize the cross-stream diffusion. The cross-sectional velocity and analyte concentration profile were captured, which clearly showed a butterfly effect (Akpa et al. 2007; Sullivan et al. 2007).
In parallel, modeling and simulation analysis (both numerical and analytical) have been actively pursued by numerous researchers to enable a fully resolved view of the unique transport behavior observed in the experiments. Numerical methods such as finite difference method (Kamholz and Yager 2001; Salmon and Ajdari 2007), finite element method (Beard 2001), the method of lines (Chen et al. 2006), and lattice Boltzmann (LB) method (Ayodele et al. 2009; Sullivan et al. 2007) have been utilized to quantitatively describe the analyte concentration profile in rectangular microchannels with arbitrary aspect ratios. However, numerical simulation inherently suffers from two limitations. First, it is difficult to provide direct, physical insight into the underlying diffusion transport mechanism. Large amount of reliable data are necessary to deduce and generalize the governing law (Ayodele et al. 2009). In addition, numerical diffusion (or called pseudo-diffusion) caused by the discretization of the governing equations induces an additional, artificial broadening of the diffusion zone leading to error in the analysis, which becomes more appreciable at high Péclet number regime (e.g., low values of diffusion coefficients and fast flow velocity). This can be even exacerbated in the scaling law analysis, where the scaling coefficient is susceptible to the diffusion flux and the computational meshes. One way to alleviate the issue of the numerical diffusion is to employ very fine meshes for the simulation, which can be prohibitively expensive for acquiring the large, representative data pool as discussed above.
In this context, several analytical models have been developed to address the aforementioned limitations. However, the non-uniform axial velocity profile in the 3D convection–diffusion equation poses a formidable challenge to deriving an analytical solution. Therefore, several assumptions have been made in prior analytical models, including (1) the aspect ratio of the channel has to be large (i.e., flat, slit-like channels) and (2) the depth-wise diffusion is assumed to be negligible (i.e., depth-wise concentration distribution is assumed to be uniform). For instance, by replacing the non-uniform velocity profile with the average flow velocity and neglecting the terms associated with axial and depth-wise diffusion, an analytical model was obtained (Holden et al. 2003; Wang et al. 2006, 2007) to predict analyte concentration profile in the 2D domain (width-wise and axial). Wu et al. (2004) improved this solution by incorporating axial diffusion. To take into account the Taylor dispersion resulting from the non-uniform velocity profile, an improved model was developed using two different approaches, the direct incorporation of the effective Taylor-dispersion coefficient along the axial direction (Beard 2001a, b; Dorfman and Brenner 2001) and the depth-wise averaging method (Lam et al. 2005). These models share several common limitations, such as only applicable to microchannels with large aspect ratios and only able to provide 2D concentration map, which markedly limit their utility.
We present an analytical model to investigate the cross-stream diffusion in rectangular microchannels with arbitrary aspect ratios under pressure-driven flow. The three-dimensional steady-state convection–diffusion equation is solved in terms of a Fourier series. Based on a double integral transformation (de Almeida et al. 2008; Moreira et al. 2005; Wortmann et al. 2005) of the governing equation, the Fourier coefficients are obtained analytically via eigensystem calculation. A phase diagram attained from the dimensional analysis is also presented to thoroughly interrogate the characteristics of various transport regimes and the validity of the present and prior analytical models. The present analytical model is extensively verified against experimental data extracted from the literature and quantitatively compared against high-fidelity numerical analysis and other analytical models in very broad parameter space within the phase diagram. The present model enables fully resolved, three-dimensional insight into the unique transport behavior of the cross-stream diffusion (e.g., position-dependent scaling law and the heterogeneous transport rate) in microchannels with arbitrary aspect ratios, and is thus well-suited for the design of microfluidic assays based on analyte concentration manipulation (Keenan and Folch 2008).
The article is organized as follows. The model formulation including the description of the governing equations, the double integral transformation method, and eigensystem calculation is first described in Sect. 2. Next, the dimensional analysis and phase diagram analysis encompassing various transport regimes is presented to examine the validity of present and prior analytical models (Sect. 3). The present analytical model is compared against experimental data, numerical analysis, as well as other analytical models in Sect. 4. The article concludes with a summary of the scientific findings and insights gained from the modeling and simulation study (Sect. 5).
2 Model formulation and solution
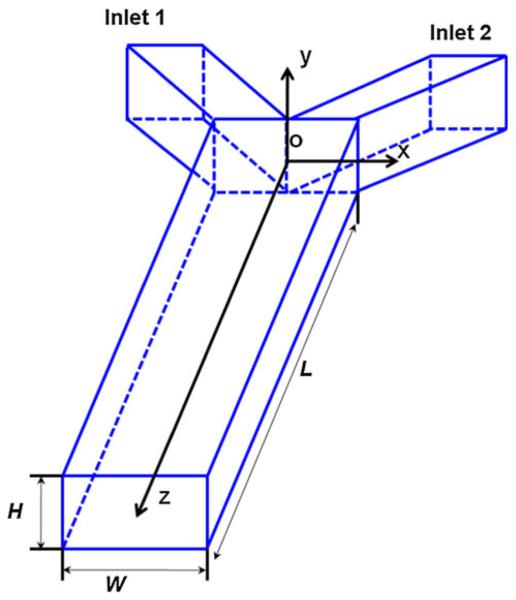
In this section, we present the governing equations and analytical solution to the cross-stream diffusion underpressure-driven flow. Figure 1 illustrates the coordinates for a Y-shaped microchannel with a rectangular cross-section used in this study. The microchannel has two inlet channels and a main diffusion channel for analyte supply and cross-stream diffusion, respectively. The present modeling focuses on the species transport of the analyte in the main diffusion channel. x, y, and z denote the channel’s cross-stream, depth-wise, and axial coordinates, respectively. The coordinate origin is located at the center of the plane, where the inlet channels and the main channel merge. The length, width, and height of the main channel are L, W, and H, respectively.
Fig. 1.
Geometry of the Y-shaped microchannel and the coordinate system definition. The coordinate origin is located at the center of the plane where the inlet channels and the main channel merge
Assumptions are made to simplify the present analytical model development, including:
The flow in the Y-shaped microchannel is steady state and laminar.
The length of the channel is significantly larger than its width and height (i.e., L ⪢ W and L ⪢ H). Note that in distinctly contrast to prior models, no constraint is imposed of the relative magnitude of W and H in the present model. The flow entry effect after the merging junction is not taken into account as its length is negligible compared to the main channel length.
Convective mass transport in the axial direction dominates over the axial diffusion. The latter is neglected in the present model.
Streams from both inlets are symmetric (i.e., the same cross-sectional shape, area, and flow rate) and have the identical, constant physical properties (e.g., density and viscosity independent of the analyte concentration).
The gravitational effect is neglected.
Based on these assumptions, the laminar flow in the main channel is governed by the steady-state Naviér–Stokes equation:
| (1) |
where u is the axial flow velocity, P is the pressure, and μ is the dynamic viscosity of the buffer. For fully developed flow in a rectangular channel, the velocity profile μ along the z-axis can be obtained analytically (Stroock and McGraw 2004):
| (2) |
where εs = π(2s − 1)/2 and u0 is the maximum axial velocity (e.g., velocity at the center), which can be expressed as u0 = κUavg. Here, Uavg is the average axial velocity and
is the ratio of the maximum velocity to the average velocity.
The analyte species transport can be described by the steady-state convection–diffusion equation, which is given by
| (3) |
where c is the analyte concentration, u is the flow velocity obtained from Eq. 2, and D is the diffusivity. The above equation is subject to the following boundary conditions for cross-stream diffusion:
| (4) |
where c0 is the initial analyte concentration at the merging junction (z = 0).
By defining , , , and , Eq. 3 can be normalized as:
| (5) |
where Pe = WUavg/D is the Péclet number defined using the cross-sectional average velocity Uavg and the channel width W; γ = W/H and l = L/W are, respectively, the aspect ratio and the length-to-depth ratio of the channel; and is the non-dimensional axial velocity. Similarly, the corresponding boundary conditions are rewritten as
| (6) |
Normally in microfluidic systems, Pe · l ⪢ 1, hence the axial diffusion term is negligible (the third assumption above) and Eq. 5 is reduced to
| (7) |
To solve this equation, the method of the double integral transformation is used. We first assume the solution of the dimensionless concentration takes the form of a Fourier series expansion of normalized eigenfunctions and :
| (8) |
The eigenfunctions and related eigenvalues can be structured from Sturm–Liouville auxiliary problems satisfying the related boundary conditions:
| (9) |
By solving Eq. 9, we obtain
| (10) |
where and . We then substitute the Fourier series of the concentration (i.e., Eq. 8 into Eq. 7) and apply an integral transformation operator . Taking advantage of the orthogonal properties of the eigenfunctions, we obtain an infinite system for the coefficients
| (11) |
where (see Appendix for detail) and . It is convenient to rewrite Eq. 11 in a single sum form (by replacing m, n with k and i, j with q)
| (12) |
Using the compact matrix expression, Eq. 12 is given by
| (13) |
where [Q] = [M]−1[R]. The analytical solution of Eq. 13 can be found as
| (14) |
The values of C[0] is obtained by applying the integral transformation to the initial boundary condition . On determining the eigenvalues and eigenvectors of matrix [Q], the solution in Eq. 14 in the decoupled form is
| (15) |
where [V] is the eigenvector matrix and [D] is the diagonal eigenvalue matrix, which satisfies [V][Q][V]−1 = [D].
3 Phase diagram study and other analytical models
Next, we will present a phase diagram obtained from dimensional analysis to analyze various transport regimes in the cross-stream diffusion and examine the validity and applicability of the present and prior analytical models.
The first analytical model (termed Model A) for microfluidic cross-stream diffusion assumes that the microchannel is slit-like with large aspect ratio γ (Holden et al. 2003; Wang et al. 2006). The non-uniform velocity profile is replaced with an average velocity Uavg, and the axial and depth-wise diffusion is neglected in the governing transport equation
| (16) |
By applying the pertinent boundary conditions, the solution can be obtained by
| (17) |
The second model (termed Model B) seeks to improve Model A by incorporating axial diffusion in the governing equation (Wu et al. 2004)
| (18) |
The corresponding solution is
| (19) |
where .
The third model (termed Model C) (Beard 2001; Lam et al. 2005) considers both axial diffusion and the nonuniform velocity profile along the axial direction subject to the constraints of large aspect ratios and neglecting depthwise diffusion, i.e.,
| (20) |
where Deff is the effective diffusivity (or dispersion coefficient) due to the axial molecular diffusion and the Taylor dispersion.1 The solution of Eq. 20 is the same as that in Eq. 19 except that λ1,2 is modified as2:
| (21) |
Table 1 summarizes the assumptions and valid regimes in the aforementioned analytical models. It shows that all prior models (Models A–C) assume large aspect ratio of the microchannel (γ ⪢ 1, the second column in Table 1). Under this circumstance, the depth-wise diffusion is sufficiently rapid that the concentration differences do not persist across the depth direction, and hence, the depth-wise diffusion can be neglected (i.e., the third column in Table 1). Thus, it is possible to replace the full set of 3D equations by depth-averaged equations. In Model A and Model B, the non-uniformity in the axial velocity profile is also neglected; hence it is unable to consider the effect of Taylor dispersion (the fifth column in Table 1). In contrast, the present model only neglects the axial diffusion in the species transport (the fourth column in Table 1). As we will show below that this assumption is valid in almost all of the microfluidic channels for cross-stream diffusion, although a complete solution including axial diffusion can also be pursued using the integral transformation approach at the cost of more complex model developments.
Table 1.
Summary of the assumptions and physical regions in various analytical models
| Models | Large aspect ratio/flat |
Neglect depth- wise diffusion |
Neglect axial diffusion |
Neglect non-uniformity velocity profile |
Valid regimes |
|---|---|---|---|---|---|
| Present model | √ | (i), (ii) | |||
| Model A | √ | √ | √ | √ | (ii) |
| Model B | √ | √ | √ | (ii) | |
| Model C | √ | √ | (ii), (iii) |
A phase diagram of the species transport in the diffusion microchannel is illustrated in Fig. 2, its horizontal and vertical axes, respectively, denote the aspect ratio of the channel and the Péclet number. The boundaries between the transport regions in the diagram are then derived from the assumptions used in the individual models. In the dimensional analysis below the term “sufficiently larger ⪢” and “sufficiently smaller ⪡”, respectively, represent at least eight times larger or eight times smaller.
Fig. 2.
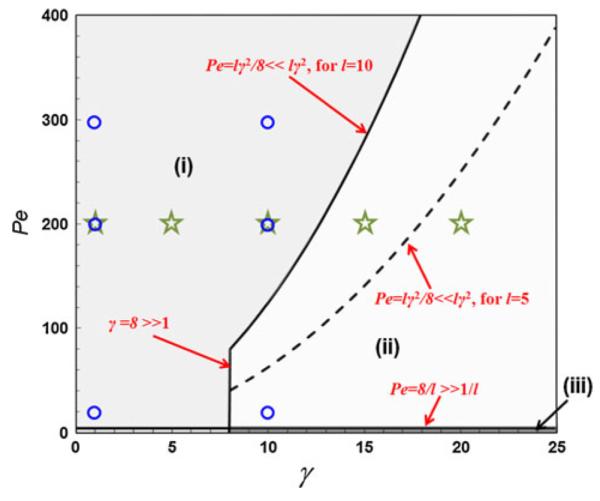
Phase diagram of cross-stream diffusion-based species transport in microchannels. Three regions—(i), (ii), and (iii)—were defined to establish the validity of the various analytical models: Region (i) corresponds to cases where the aspect ratio is low or modest and concentration differences can persist across the depth direction, Region (ii) corresponds to cases where the aspect ratio is large and where concentration differences do not persist across the depth direction (owing to rapid depth-wise diffusion), and Region (iii) corresponds to where the axial diffusion is not negligible. A parametric analysis was performed using the data points denoted by the stars and circles, which will be used for the discussion in Sect. 4.2.2
3.1 Axial diffusion is negligible
This assumption is made by Model A and the present model. By comparing the axial diffusion term (i.e., the third term in RHS of Eq. 5) and the convection term (i.e., the LHS of Eq. 5), it indicates that the criterion to ignore the former is Pe ⪢ 1/l. In the practical case of cross-stream diffusion, the diffusivity of the species is expected to be in the range of D ~ 10−11 − 10−9 m2/s, the channel width W ~ 10−5 − 10−3 m, and the average velocity Uave ~ 10−4 − 10−1 m/s, yielding a Péclet number of Pe ≥ 1, which is sufficiently larger than 1/l for a micro-channel (i.e., L ⪢ W in the second assumption in the previous section). Note that the extreme case involving even larger diffusivity, smaller channel width, and slower flow is of little value for practical microfluidic applications involving cross-stream diffusion (as the analyte will diffuse instantaneously to yield a uniform concentration profile). In the phase diagram, Pe ⪢ 1/l is a straight line (Pe = 8/l) parallel to and adjacent to the horizontal axis (i.e., the bold straight line at the bottom of Fig. 2). Therefore, the present model is applicable to both Region (i) and Region (ii) above the line of Pe = 8/l, which encompasses almost the entire domain in the diagram.
3.2 Large aspect ratio (flat channel)
The large aspect ratio is used in all Models A–C (except for the present model), yielding γ = W/H ⪢ 1, which is a vertical straight line. In Fig. 2, γ = 8 is used and deemed “sufficiently” large.
3.3 Depth-wise diffusion is negligible
Likewise, the depth-wise diffusion is neglected in the other three models (except for the present model). The valid condition for this assumption is that the time required for the analyte species to diffuse across the channel depth is sufficiently less than that for width-wise diffusion and axial convection, i.e., H2/D ⪡W2/D and H2/D ⪡ L/Uavg, which means that the depth-wise diffusion is much more rapid than the width-wise diffusion and axial convection. The former is spontaneously satisfied for Models A–C as they all assume large aspect ratio of the channel (see above), and the latter gives Pe ⪡ lγ2 covering the regions to the right of the parabolic curve defined by Pe ≤ lγ2/8 in Fig. 2. Hence, Region (ii) is the valid region for all Models A–C, while Model B and Model C also accommodate the thin Region (iii) as they are able to account for the axial diffusion (see discussion above).
3.4 Non-uniform velocity profile is negligible
The non-uniform velocity profile introduces an additional axial dispersion term (i.e., Taylor dispersion represented by Ddisp in Eq. 20) in the transport equation as opposed to Eq. 18 ignoring the non-uniformity. Therefore, by comparing the axial Taylor dispersion and the convection term in Eq. 20, we can obtain the criterion of neglecting the non-uniformity in the velocity profile in the species transport: Pe ⪡ 210lγ2 or Pe ≤ 210lγ2/8. This constraint will be spontaneously satisfied if the assumption for neglecting the depth-wise diffusion is valid which imposes a more rigorous constraint (i.e., Pe ≤ lγ2/8). Therefore, Taylor dispersion is negligible in the other three models in which the depth-wise diffusion is not taken into account.3
The phase diagram study indicates that in contrast to other analytical Models A–C, the present solution is applicable to broader transport regimes of microfluidic cross-stream diffusion (including the entire Region (i) in Fig. 2 that is unavailable to the existing models) by employing minimal, practically relevant assumptions, relaxing the constraints of the large aspect ratio, and considering the depth-wise diffusion.
4 Results and discussion
In this section, the analytical model will be validated against experimental data extracted from the literature in terms of the transverse concentration profile, diffusion scaling law, and the mixing efficiency, followed by quantitative comparison with high-fidelity numerical analysis and other analytical models in very broad parameter space to investigate the non-uniform, depth-wise transport behavior, and model applicability within the phase diagram. To obtain accurate results for comparison, 60 terms in the Fourier series along both and direction in the present analytical model (Eq. 8) are used. Likewise 60 terms are used in other analytical models (Models A–C) in Eqs. 17, 19, and 21.
The high-fidelity numerical simulation is performed with the commercial finite volume-based simulation software CFD-ACE+ (ESI-CFD, Inc.). The computational domain is meshed by a block-structured grid using the preprocessor available within CFD-ACE+. The software solves the 3D Naviér–Stokes equations for incompressible fluid flow for the flow velocity and the convection–diffusion equation for the analyte concentration in the microfluidic channels, respectively. The CFD-ACE+ solver uses the SIMPLEC algorithm for pressure–velocity coupling. A second order scheme is used for spatial discretization to obtain the analyte distribution. A grid-dependence check for the numerical simulation was undertaken by refining the computational mesh, and all the numerical results presented in this article converge to an accuracy level of <0.1% between two grid settings.
4.1 Model validation against experimental data
We first compare the present analytical model results with the 3D experimental data obtained by MRI measurements (Sullivan et al. 2007) in terms of the cross-sectional concentration distribution at various axial locations in the Y-shaped microchannel. The Y-shaped microchannel in the experiment has a length of 1.5 cm, a width of 500 μm, and a depth of 250 μm high (i.e., the aspect ratio γ = 2). The diffusivity of the analyte (Mn2+) is 1.6 × 10⁻⁹ m2/s and the average axial velocity is 1.1 mm/s yielding a Péclet number ~350.
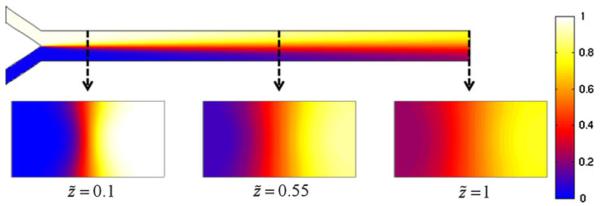
Figure 3 shows the concentration distribution of the analyte within the microchannel obtained using the present analytical model. The top trace shows the concentration profile at the half-depth plane from a top view, and the bottom trace illustrates the cross-sectional profiles at three downstream locations from the merging junction (i.e., , 0.55, 1). We can see that the concentration distribution is not uniform along the channel depth, and the transverse diffusion near the top and bottom walls is faster than that at the half-depth of the channel, exhibiting the well-known “butterfly effect” on the cross-section (Ismagilov et al. 2000; Kamholz and Yager 2001, 2002; Kamholz et al. 1999). As discussed above, this is caused by the longer residence time of the analyte molecules close to the wall relative to those at the central region due to the non-uniform velocity profile. It should be pointed out that to the best of our knowledge; it is the first time that the “butterfly effect” is captured by an analytical model.
Fig. 3.
The concentration distribution of the half-height plane (from top view), and the cross-sectional concentration distribution at different locations. The heterogeneous transport behavior in the depth-wise direction and the resulting “butterfly effect” in the microchannels is captured by the present model
Figure 4 depicts the quantitative comparison of the present analytical model results against the experimental data and LB simulation results (Sullivan et al. 2007) in terms of the depth-averaged, transverse concentration profile at two axial positions, respectively, and 0.78 from the merging junction. Details about data processing and averaging are given in Sullivan et al. (2007). The present analytical results agree very well with both the experimental observation and LB simulation.
Fig. 4.
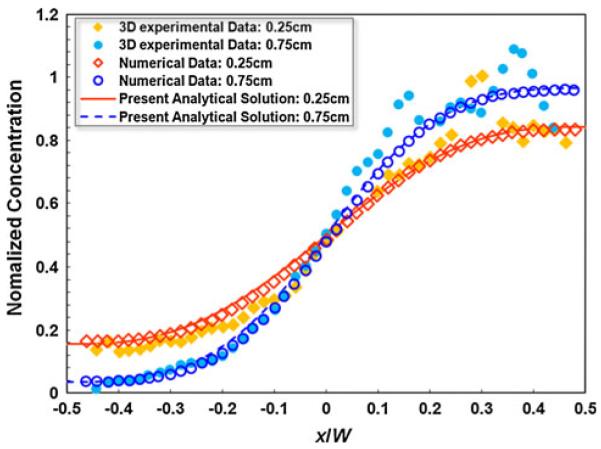
Comparison of the depth-averaged transverse concentration profile between the present analytical model and the experimental data and the lattice Boltzmann (LB) simulation data extracted from Sullivan et al. (2007)
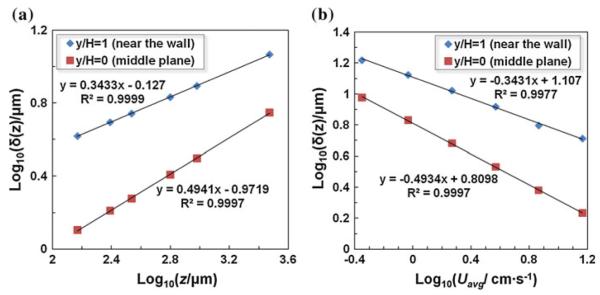
Next the present analytical model is used to investigate the diffusion scaling law in a microchannel. The scaling law states that the thickness δ of the interfacial diffusion layer between the streams is proportional to a power law of the ratio of the axial distance to the average flow velocity, i.e., δ ~ (z/Uavg)n. Similar to the experiments in Ismagilov et al. (2000), transport behavior of the Ca+ with a diffusivity of D = 1.2 × 10⁻⁹ m2/s (yielding Pe = 10,000 when Uavg = 0.08 m/s) in the Y-shaped microchannel (160 μm wide and 105 μm deep, yielding an aspect ratio of γ = 1.524) was analyzed using the present model. δ is defined as the transverse (along x direction) distance at which the concentration is reduced to 20% of the maximum value at the inlet. Figure 5 shows the analytical results of diffusion scaling law at the channel wall (∣y/H∣ = 1/2) and at the half-depth plane (y/H = 0), in which the symbols and the lines, respectively, denote the modeling results and the fitted lines. Figure 5a delineates the scaling relationship between δ and the downstream distance z. Based on the slope of the fitted line, it is found that the diffusion thickness δ scales as the 1/3 power (n = 0.3433 obtained from the fitted line) of the axial distance z at the top and bottom wall, and 1/2 power (n = 0.4941 from the fitted line) at the half-depth plane. Likewise, Fig. 5b depicts that δ scales as −1/3 power (n = −0.3372) and −1/2 power (n = −0.4934) of the average axial velocity Uavg, respectively, at the top and bottom wall and at the half-depth plane of the channel. The present analytical results agree with the experimental (Ismagilov et al. 2000) and theoretical analysis (Ayodele et al. 2009), which indicates that 1/2 and 1/3 power laws arise from the zero velocity gradient at the half-depth plane and the linearized velocity profile at the wall, respectively. We also noted that the measured δ in Ismagilov et al. (2000) is larger than the present analytical results (~50%). Salmon and Adjari (2007) also found a similar deviation when comparing their numerical simulation against experimental data in Ismagilov et al. (2000) which they attributed to the chemical reaction between the fluorescence (fluo-3) and CaCl2 that varies the local diffusion transport of Ca2+. In addition, the present analytical values of δ in Fig. 5 match very well the numerical simulation results without chemical reaction in Salmon and Adjari (2007), which verifies the present analytical model.
Fig. 5.
The thickness of the interfacial diffusion layer (δ) as a function of a the downstream axial distance z; and b the average velocity Uavg. The data for b were collected at z = 500 μm from the Y junction
Finally, we compared the present analytical results with the experimental data of the mixing efficiency in Chen et al. (2006) obtained from conventional microscopy. The mixing microchannel is 500 μm wide and 500 μm high (i.e., aspect ratio w = 1). In their experiments, two separate fluid streams were injected into the channel. One fluid contained phenolphthalein (C6H4COOC(C6H4-4-OH)2) dissolved in 99% alcohol, with a concentration of 0.031 mol/l. The other fluid contained sodium hydroxide (NaOH) dissolved in 99% alcohol, with a concentration of 0.25 mol/l and pH 13. The diffusivity for hydroxide ion to phenolphthalein solution is D = 5×10⁻⁹ m2/s. To quantitatively evaluate the non-uniformity in the concentration profile, a mixing efficiency is defined (Erickson and Li 2002):
| (22) |
where and are the concentration profile of the completely mixed and unmixed state, respectively. Figure 6 shows the comparison between the present analytical results and the experimental data along the downstream distance. Three sets of the analytical results of the mixing efficiency are presented, respectively, extracted at the top and bottom wall (∣y/H∣ = 1/2) and at the half-depth plane (y/H = 0), as well as the depth-averaged one (i.e., averaging Eq. 22 along the depth-). Note that the axial downstream distance in the horizontal axis of Fig. 6 is non-dimensionalized in the same manner as (Chen et al. 2006) to keep the data consistence for comparison. Due to the non-uniform velocity profile, the mixing efficiency η at the top wall is larger than that at the half-depth plane, which accords with the experimentally observed heterogeneous transport behavior and “butterfly effect” in the micro-channels with low aspect ratios. The present analytical results are in a good agreement with the measured experimental data. Note that the experimental data are closer to the analytical results at the channel wall than the depth-averaged one, which as discussed in Chen et al. (2006) can be attributed to the trapezoidal cross-section of the channel in the microchannels in the experiments.
Fig. 6.
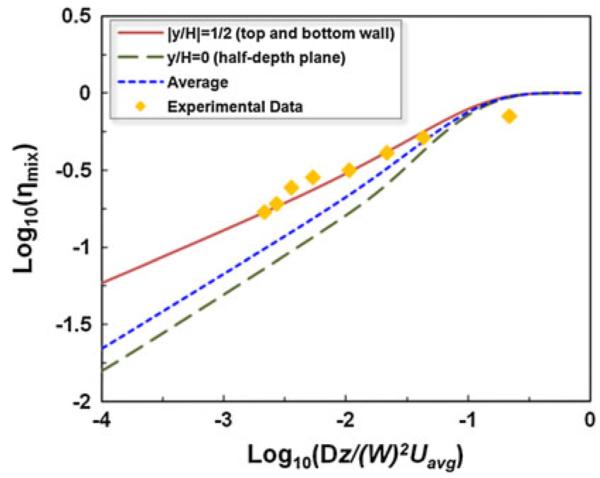
Comparison between the results of the present analytical model and the experimental data in terms of the mixing efficiency along the downstream distance extracted from Chen et al. (2006)
4.2 Comparison with numerical and other analytical models
In the previous section, we verified the present analytical model against the experimental data reported in the literature. Due to limited availability of experimental data, in this section the present analytical model is compared with full-scale numerical simulation and other three aforementioned analytical models in the entire computational domain within a broader parameter space to demonstrate the salient capability of the present model in terms of providing accurate, fully resolved 3D species transport.
To quantitatively characterize the discrepancy between high-fidelity CFD-ACE+ simulation and the analytical model, two error indices are defined (Lam et al. 2005; Bissacco et al. 2007; Rewienski and White 2003):
| (23) |
| (24) |
where and are the normalized concentration profile, respectively, obtained from the analytical model and CFD-ACE+ simulation, and is the average value (i.e., 0.5 for the normalized concentration). Δ in Eq. 23 denotes the relative error of a concentration profile along a transverse line (a function of ) at a fixed axial position (Lam et al. 2005), while Er in Eq. 24 is the relative error norm (Bissacco et al. 2007; Rewienski and White 2003) of a concentration profile along the cross-section and is a function of the axial position .
4.2.1 Butterfly effect of the species transport
In the first case study, a microchannel with a width of 100 μm, a depth of 100 μm, and a length of 1 mm was analyzed, yielding an aspect ratio γ = 1 and the length-to-width ratio l = 10. The average flow velocity was selected to be 2 mm/s and the diffusivity of the analyte was taken to be 1 × 10⁻⁹ m2/s corresponding to Pe = 200. Figure 7 shows the image comparison of the concentration profile along a cross-section at between the present analytical model, CFD-ACE+ simulation, and other three analytical models (Models A–C in Sect. 3). A salient butterfly shaped concentration profile across the channel arising from the heterogeneous transport rate along the depth-wise direction was observed in both CFD-ACE+ simulation and the present analytical model, which, however, is absent in the other three analytical models due to their assumptions of neglecting the depth-wise diffusion (Fig. 7).
Fig. 7.
Cross-sectional concentration profile obtained from the CFD-ACE+ simulation, the present analytical model, and the other three analytical models at for the aspect ratio γ = 1
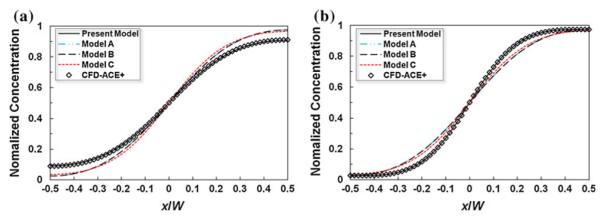
For quantitative comparison, the transverse concentration profiles extracted at the top wall (Fig. 8a) and the half-depth (Fig. 8b) at the downstream distance are presented in Fig. 8. It shows that the present analytical solution matches CFD-ACE+ result very well at both sampling lines, while the other three models exhibit marked deviation. It is interesting to note that other analytical models underestimate the cross-stream transport at the channel wall and overestimate it at the channel half-depth centerline, as they are unable to capture the non-uniform transport rate along the depth (i.e., faster at the wall and slower at the centerline due to the different residence time of the analyte.)
Fig. 8.
Comparison of the concentration distribution and at the downstream distance : a at the top and bottom wall (y/H = ±1/2); b at the half-depth plane (y/H = 0)
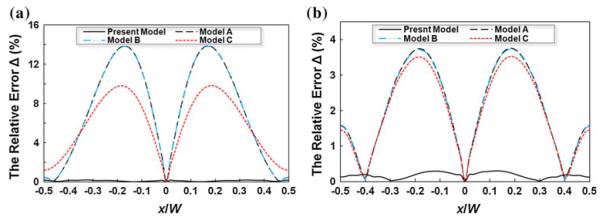
It should be pointed out that as the aspect ratio γ increases, the “butterfly effect” and the heterogeneous transport rate phenomenon will diminish and the accuracy of the Models A–C will gradually improve. Figure 9 illustrates the relative error Δ of various analytical models relative to the CFD-ACE+ simulation at the half-depth (y/H = 0) and for two aspect ratios, γ = 1 (Fig. 9a) and γ = 5 (Fig. 9b). Figure 9a shows that for low γ = 1 the Models A–C deviate significantly from the numerical data and the present model, leading to a maximum error of up to 14%. As the aspect ratio γ increases to 5, the errors of the other analytical models scale down with the maximum value around 3.5% (Fig. 9b), which is still appreciable in contrast to the present analytical model with <0.5% error in both cases.
Fig. 9.
Relative error Δ between the numerical results and the analytical solutions at the half-depth (y/H = 0) and : a the aspect ratio γ = 1; b the aspect ratio γ = 5
4.2.2 Parametric analysis
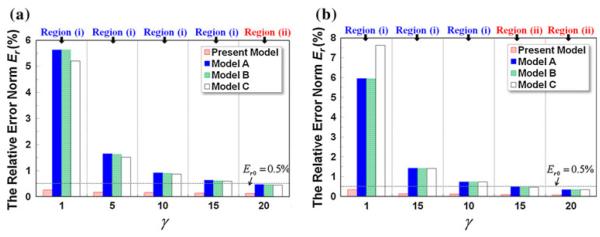
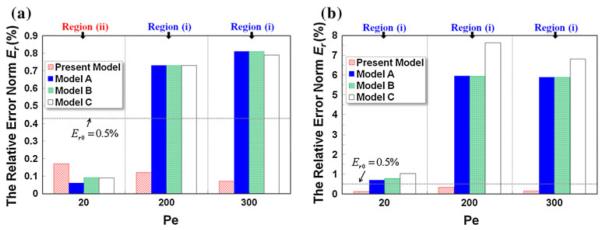
Equation 5 indicates that the analytical solution for the analyte concentration profile mainly depends on three dimensionless parameters: Péclet number Pe, aspect ratio γ, and length-to-width ratio l. In this section, parametric analysis of the analytical models is carried out in broad space of Pe, γ, and l to quantitatively evaluate their applicability and accuracy. Given the number of the parameters, the analysis is pursued in two categories. In the first category (Fig. 10), γ and l are varied in a wide range (γ = 1, 5, 10, 15, 20 and l = 5, 10) with Pe held constant (Pe = 200), which correspond to the star-shaped data points and both parabolic curves in the phase diagram in Fig. 2. In the second category (Fig. 11), the Pe and γ are changed in a range of Pe = 20, 200, 300 and γ = 1, 10 with l fixed at 10, which are denoted by the circle and the bold parabolic curve in the phase diagram. In both analysis, the concentration profiles at (at the outlet of the main diffusion channel) are extracted for comparison.
Fig. 10.
Comparison of Er at of various analytical models in a wide range of aspect ratios γ: a length-to-width ratio l = 5; b length-to-width ratio l = 10
Fig. 11.
Comparison of Er at of various analytical models with different Péclet numbers Pe: a aspect ratio γ = 10; b aspect ratio γ = 1
Under the first category (Fig. 10), it can be seen that the relative error norm (Er) of the present analytical model is less than the threshold value Er0 = 0.5% in all the cases, signifying its excellent applicability and accuracy in a broad parameter space of γ and l (subject to l ⪢ 1). The aspect ratio exerts the strongest influence on the accuracy of the other three analytical models (Models A–C): (1) for low γ, their Er all exceed 5%. As γ increases, their accuracy improves appreciably, indicated by the decrease in Er to ~1.5% (γ = 5) and further to ~0.8% (γ = 10). However, given Er0 = 0.5% the accuracy of the three models are inadequate for γ = 1–10 (i.e., the three star-shaped data points on the left in Region (i) of the phase diagram. (2) The length-to-width ratio l (i.e., the parabolic curves in Fig. 2) dictates the boundary between Region (i) and Region (ii), and hence impacts the validity of the underlying assumptions of the other three analytical models at the medium-to-large values of γ. For example, the change from l = 5 to l = 10 (i.e., the translation of the dashed parabolic curve to the solid one) converts the point of γ = 15 (the fourth star-shaped point from the left) from Region (i) into Region (ii) and renders the model assumption valid for enhanced accuracy. This is confirmed by the data entry of γ = 15 in Fig. 10a and b, where Er drops below Er0 = 0.5% when l increases from 5 to 10. (3) For sufficiently large aspect ratios (i.e., γ = 20), the model assumption is always valid regardless of the length-to-width ratio l (given Pe = 200 in the case study), thereby the model accuracy of Models A–C is adequate.
Under the second category (Fig. 11), we compare the relative error norm (Er) of different analytical models at various Péclet numbers (Pe = 20, 200, 300) and aspect ratios (γ = 1, 10). Again the present analytical model outperforms the others and achieves a salient Er<Er0 in all the cases. The accuracy of the other three models (Models A–C) is dictated by both aspect ratio γ and Péclet number: (1) for the large aspect ratio γ = 10 (Fig. 11a), Models A–C exhibit excellent agreement with the numerical data at Pe = 20, while translation to high Péclet numbers (Pe = 200 and Pe = 300) crosses over the parabolic curves defining the criterion for neglecting the depth-wise diffusion (see Fig. 2), leading to larger Er exceeding the cut-off Er0 = 0.5%. For low aspect ratio γ = 1 (Fig. 11b), the error is markedly escalated and surpasses Er0 at all Pe, and Er is the worst at high Pe where the effect of non-uniform transport rate along the depth (i.e., “butterfly effect”) is the most dominant. At low Pe, the analyte diffuses faster across the channel and its concentration profile is much more uniform than that at high Pe, and hence, the error is diluted.
Finally, it should be pointed out that Er0 = 0.5% used in this article is only for unambiguous definition. Depending on the requirements on model accuracy, more coarse or rigorous criterion can be adopted, which manifested in the phase diagram in Fig. 2 corresponds to shrinking or enlarging the Region (i), respectively.
5 Conclusions
This article presented an analytical model for cross-stream diffusion in microchannels with arbitrary aspect ratios, and a phase diagram study to investigate its unique, heterogeneous transport behavior. The Fourier series solution to the three-dimensional steady-state convection–diffusion equation with minimal, realistic assumptions was obtained by the method of double integral transformation and appropriate eigensystem calculation. A phase diagram representing various transport regimes governed by the three dimensionless parameters (i.e., Péclet number, aspect ratio, and length-to-width ratio) was thoroughly studied. The boundaries of the regions within the phase diagram were derived from the dimensional analysis of the original convection–diffusion equation. The present analytical model was then compared against existing analytical models in terms of assumptions and applicability using the phase diagram. It convincingly demonstrates that the present model accommodating microchannels with arbitrary aspect ratios covers much broader transport regimes and more practical microfluidic applications.
The present analytical model was extensively validated against experimental data extracted from the literature in terms of the concentration profiles, diffusion scaling law, and mixing efficiency. Meanwhile, it was also quantitatively compared against high-fidelity numerical analysis (CFD-ACE+) and other analytical models in very broad parameter space to examine the non-uniform, depth-wise transport behavior as well as accuracy and applicability of the analytical models. Key scientific findings and insights obtained from the study include:
To the best of our knowledge, the present effort represents the first analytical model applicable to microchannels with arbitrary aspect ratios for capturing the non-uniform transport rate (i.e., the “butterfly effect”). The present model also for the first time accurately predicts the position-dependent scaling-law of diffusion (1/3-power at the channel wall and 1/2-power at the half-depth plane) using an analytical, closed-form solution.
- The parametric analysis in the phase diagram indicates that the present model is adequate in almost all the regions of practical interest except for Region (iii) (see below). The accuracy of the other analytical models (Models A–C) built on the assumption of large aspect ratio and uniform depth-wise concentration is susceptible to the aspect ratio γ, Péclet number Pe, and length-to-depth ratio l.
- Given a fixed Pe, Models A–C exhibits poor accuracy for low γ (e.g., 1–5 in this study) regardless of l. The length-to-width ratio l plays an important role when γ falls in the medium-to-large value range (e.g., 10–15 in this study), where the variation in l can impact the validity of the model assumption for neglecting depth-wise diffusion. Large γ markedly enhances accuracy for Models A–C.
- With a constant length-to-width ratio l, likewise prior Models A–C are inapplicable to low γ in all Péclet range. For γ at the medium-to-large value range (e.g., γ = 10 in Fig. 2), the model applicability strongly depends on the Péclet number. A high Pe still can invalidate the assumption of neglecting depth-wise diffusion and lead to large model errors.
The only major assumptions used in the present model are the long channel length (i.e., l ⪢ 1) to minimize the flow entry effects and reasonable Péclet number (Pe ⪢ 1/l) to neglect axial diffusion. The former is also adopted by prior analytical models and is valid for almost all cross-stream diffusion microchannels. Through analysis above, it is also found that the extremely low Péclet number is indeed unrepresentative in the targeted application areas (e.g., mixing, concentration gradient generation, and assay under hydrodynamic flow). It should be pointed out that the double integral method can be further extended (involving more significant derivation effort) to include axial diffusion into the analytical solution.
Acknowledgments
This research is sponsored by NIH/NHGRI under grant number 5R44HG004290-03.
Appendix
By substituting the expression of , we have
| (25) |
The above equation involves four kinds of integrations in terms of and , shown as:
| (26) |
| (27) |
| (28) |
| (29) |
Footnotes
In Beard’s paper (2001a), the expression of effective diffusivity is incorrect. See detailed discussion in Dorfman and Brenner (2001) and response by Beard (2001b).
In Lam’s paper (2005), the expression form of λ1,2 is incorrect.
It should be pointed out the analytical solution in Lam et al. (2005) is erroneous, which overestimates the contribution from the Taylor dispersion by more than 3%. By rectifying their solution, the Taylor dispersion is marginal (much less than 1%) in the species transport, which agrees with our dimensional analysis herein.
References
- Akpa BS, et al. Study of miscible and immiscible flows in a microchannel using magnetic resonance imaging. Anal Chem. 2007;79(16):6128–6134. doi: 10.1021/ac070364a. [DOI] [PubMed] [Google Scholar]
- Aurouz PA, et al. Micro total analysis systems. 2. Analytical standard operations and applications. Anal Chem. 2002;74:2637–2652. doi: 10.1021/ac020239t. [DOI] [PubMed] [Google Scholar]
- Ayodele SG, Varnik F, Raabe D. Effect of aspect ratio on transverse diffusive broadening: a lattice Boltzmann study. Phys Rev E. 2009;80(1):016304. doi: 10.1103/PhysRevE.80.016304. [DOI] [PubMed] [Google Scholar]
- Beard DA. Taylor dispersion of a solute in a microfluidic channel. J Appl Phys. 2001a;89(8):4667–4669. [Google Scholar]
- Beard DA. Response to “Comment on ‘Taylor dispersion of a solute in a microfluidic channel’ [J. Appl. Phys. 90, 6553 (2001)]”. J Appl Phys. 2001b;90(12):6555–6556. [Google Scholar]
- Bissacco A, Yang MH, Soatto S. Fast human pose estimation using appearance and motion via multi-dimensional boosting regression. IEEE computer society conference on computer vision and pattern recognition.2007. [Google Scholar]
- Chen JM, Horng TL, Tan WY. Analysis and measurements of mixing in pressure-driven microchannel flow. Microfluid Nanofluid. 2006;2(6):455–469. [Google Scholar]
- de Almeida GL, Pimentel LCG, Cotta RM. Integral transform solutions for atmospheric pollutant dispersion. Environ Model Assess. 2008;13(1):53–65. [Google Scholar]
- Dertinger SKW, et al. Generation of gradients having complex shapes using microfluidic networks. Anal Chem. 2001;73(6):1240–1246. [Google Scholar]
- Dorfman KD, Brenner H. Comment on “Taylor dispersion of a solute in a microfluidic channel” [J. Appl. Phys. 89, 4667 (2001)] J Appl Phys. 2001;90(12):6553–6554. [Google Scholar]
- Erickson D, Li DQ. Influence of surface heterogeneity on electrokinetically driven microfluidic mixing. Langmuir. 2002;18(5):1883–1892. [Google Scholar]
- Hatch A, Garcia E, Yager P. Diffusion-based analysis of molecular interactions in microfluidic devices. Proc IEEE. 2004;92(1):126–139. [Google Scholar]
- Holden MA, et al. Generating fixed concentration arrays in a microfluidic device. Sens Actuators B. 2003;92(1–2):199–207. [Google Scholar]
- Ismagilov RF, et al. Experimental and theoretical scaling laws for transverse diffusive broadening in two-phase laminar flows in microchannels. Appl Phys Lett. 2000;76(17):2376–2378. [Google Scholar]
- Jeon NL, et al. Generation of solution and surface gradients using microfluidic systems. Langmuir. 2000;16(22):8311–8316. [Google Scholar]
- Kamholz AE, Yager P. Theoretical analysis of molecular diffusion in pressure-driven laminar flow in microfluidic channels. Biophys J. 2001;80(1):155–160. doi: 10.1016/S0006-3495(01)76003-1. [DOI] [PMC free article] [PubMed] [Google Scholar]
- Kamholz AE, Yager P. Molecular diffusive scaling laws in pressure-driven microfluidic channels: deviation from one-dimensional Einstein approximations. Sens Actuators B. 2002;82(1):117–121. [Google Scholar]
- Kamholz AE, et al. Quantitative analysis of molecular interaction in a microfluidic channel: the T-sensor. Anal Chem. 1999;71(23):5340–5347. doi: 10.1021/ac990504j. [DOI] [PubMed] [Google Scholar]
- Keenan TM, Folch A. Biomolecular gradients in cell culture systems. Lab Chip. 2008;8(1):34–57. doi: 10.1039/b711887b. [DOI] [PMC free article] [PubMed] [Google Scholar]
- Lam YC, Chen X, Yang C. Depthwise averaging approach to cross-stream mixing in a pressure-driven microchannel flow. Microfluid Nanofluid. 2005;1(3):218–226. [Google Scholar]
- Moreira DM, et al. Near-source atmospheric pollutant dispersion using the new GILTT method. Atmos Environ. 2005;39(34):6289–6294. [Google Scholar]
- Rewienski M, White J. A trajectory piecewise-linear approach to model order reduction and fast simulation of nonlinear circuits and micromachined devices. IEEE Trans Comput Aided Des Integr Circuits Syst. 2003;22(2):155–170. [Google Scholar]
- Reyes DR, et al. Micro total analysis systems. 1. Introduction, theory, and technology. Anal Chem. 2002;74:2623–2636. doi: 10.1021/ac0202435. [DOI] [PubMed] [Google Scholar]
- Salmon JB, Ajdari A. Transverse transport of solutes between co-flowing pressure-driven streams for microfluidic studies of diffusion/reaction processes. J Appl Phys. 2007;101(7):074902. [Google Scholar]
- Stroock AD, McGraw GJ. Investigation of the staggered herringbone mixer with a simple analytical model. Philos Trans R Soc Lond A. 2004;362(1818):971–986. doi: 10.1098/rsta.2003.1357. [DOI] [PubMed] [Google Scholar]
- Sullivan SP, et al. Simulation of miscible diffusive mixing in microchannels. Sens Actuators B. 2007;123(2):1142–1152. [Google Scholar]
- Wang Y, Mukherjee T, Lin Q. Systematic modeling of microfluidic concentration gradient generators. J Micromech Microeng. 2006;16(10):2128–2137. [Google Scholar]
- Wang Y, et al. System-level modeling and simulation of biochemical assays in lab-on-a-chip devices. Microfluid Nanofluid. 2007;3(3):307–322. [Google Scholar]
- Whitesides GM. The origins and the future of microfluidics. Nature. 2006;442(7101):368–373. doi: 10.1038/nature05058. [DOI] [PubMed] [Google Scholar]
- Wortmann S, et al. A new analytical approach to simulate the pollutant dispersion in the PBL. Atmos Environ. 2005;39(12):2171–2178. [Google Scholar]
- Wu ZG, Nguyen NT, Huang XY. Nonlinear diffusive mixing in microchannels: theory and experiments. J Micromech Microeng. 2004;14(4):604–611. [Google Scholar]


