

Abstract
Perdeuteration, selective deuteration, and stereo array isotope labeling (SAIL) are valuable strategies for NMR studies of larger proteins and membrane proteins. To minimize scrambling of the label, it is best to use cell-free methods to prepare selectively labeled proteins. However, when proteins are prepared from deuterated amino acids by cell-free translation in H2O, exchange reactions can lead to contamination of 2H sites by 1H from the solvent. Examination of a sample of SAIL-chlorella ubiquitin prepared by Escherichia coli cell-free synthesis revealed that exchange had occurred at several residues (mainly at Gly, Ala, Asp, Asn, Glu, and Gln). We present results from a study aimed at identifying the exchanging sites and level of exchange and at testing a strategy for minimizing 1H contamination during wheat germ cell-free translation of proteins produced from deuterated amino acids by adding known inhibitors of transaminases (1 mM aminooxyacetic acid) and glutamate synthetase (0.1 mM L-methionine sulfoximine). By using a wheat germ cell-free expression system, we produced [U-2H,15N]-chlorella ubiquitin without and with added inhibitors, and [U-15N]-chlorella ubiquitin as a reference to determine the extent of deuterium incorporation. We also prepared a sample of [U-13C,15N]-chlorella ubiquitin, for use in assigning the sites of exchange. The added inhibitors did not reduce the protein yield and were successful in blocking hydrogen exchange at Cα sites with the exception of Gly. We discovered, in addition, that partial exchange occurred with or without the inhibitors at certain side-chain methyl and methylene groups: Ala-Hβ, Asn-Hβ, Asp-Hβ, Gln-Hγ, Glu-Hγ, and Lys-Hε. The side-chain labeling pattern, in particular the mixed chiral labeling resulting from partial exchange at certain sites, should be of interest in studies of large proteins, protein complexes, and membrane proteins.
Keywords: Cell-free translation, chlorella ubiquitin, SAIL, perdeuterated protein, proton back exchange, transamination, transaminase inhibitor
Introduction
Perdeuteration, selective deuteration, and stereo array isotope labeling (SAIL) are powerful strategies used in studying the structure and dynamics of large proteins, membrane proteins and protein-protein complexes by NMR spectroscopy (Kainosho and Güntert 2009, Tugarinov et al. 2006). SAIL amino acids are synthesized to contain an optimal labeling pattern that minimizes spin diffusion and allows for stereospecific assignment of prochiral groups (Kainosho et al. 2006). The incorporation of a full set of SAIL amino acids or other selectively labeled amino acids requires that proteins be prepared by cell-free synthesis so as to minimize scrambling of the label (Klammt et al. 2007). However, it has been noted that deuterated amino acids introduced into proteins by E. coli cell-free synthesis can undergo exchange with 1H from the solvent during the reaction so as to introduce 1H at Cα and Cβ positions (Etezady-Esfarjani et al. 2007).
We report here evidence for such exchange reactions at backbone and side chain positions with SAIL amino acids incorporated into chlorella ubiquitin prepared by E. coli cell-free synthesis and undertook to determine which amino acids and which positions were affected. We then observed a similar exchange pattern in a sample of perdeuterated chlorella ubiquitin prepared in a wheat germ cell-free protein production system. In the same system, we also found that most, but not all, of these exchange reactions could be inhibited by the addition of inhibitors of transaminases (1 mM aminooxyacetic acid) and glutamine synthetase (0.1 mM L-methionine sulfoximine).
Experimental section
Materials
[15N]-, [U-13C,15N]-, [U-2H,15N]-labeled mixtures of 20 amino acid were obtained from Cambridge Isotope Laboratories . Wheat germ extract was purchased from CellFree Sciences. Aminooxyacetic acid and L-methionine sulfoximine were purchased from Sigma-Aldrich. The SAIL amino acids were from SAIL Technologies, Inc.; the deuterium labeling pattern was that published (Kainosho et al. 2006) with the following differences: Ser 3S, Gly 2S, Pro 5R and His 3R.
Cell-free protein preparation
SAIL-chlorella ubiquitin was prepared by E. coli cell-free synthesis with S30 extract from E. coli BL-21 (DE3) as described previously (Ikeya et al. 2009). The cell-free transcription/translation reaction was carried out at 37 °C over a period of 7 h. For wheat germ cell-free protein production, the open reading frame coding for the protein was inserted into a pEU vector that codes for an N-terminal His6 fusion with a TEV protease cleavage site. Samples of chlorella ubiquitin were produced by wheat germ cell-free translation at the Center for Eukaryotic Structural Genomics (CESG) by methods described previously (Makino et al. 2010, Vinarov et al. 2006). Cell-free synthesis was carried out in a Proteimist100 (CellFree Sciences) as six 4-ml reactions each in the presence of a mixture of 20 labeled amino acids at 0.1% (w/v). Cell-free translations were carried out at 26 °C over a period of 18 h. Reactions were carried out in the presence of inhibitors added to the cell-free reaction mixture (1 mM aminoxyacetate and 0.1 mM L-methionine sulfoximine) and appropriately labeled mixtures of amino acids to prepare samples with three labeling patterns: [U-15N]-, [U-2H,15N]-, and [U-15N,13C]-chlorella ubiquitin. A second sample of [U-2H,15N]-chlorella ubiquitin was prepared in the absence of inhibitors. Each labeled protein was isolated by Ni-NTA affinity chromatography, and the tag was cleaved by His-tagged TEV protease. Next subtractive Ni-NTA affinity chromatography was used to remove the uncleaved protein, the cleaved tag, and the TEV protease. Finally, the chlorella ubiquitin sample was purified size exclusion chromatography and concentrated for NMR analysis.
NMR spectroscopy
All NMR spectra were recorded at the National Magnetic Resonance Facility at Madison (NMRFAM) on 800 and 600 MHz Varian VNMRS spectrometers each equipped with a triple-resonance cryogenic probe. The temperature of each sample was regulated at 25 °C. Sequence-specific assignments were determined for SAIL-chlorella ubiquitin and for [U-13C,15N]-chlorella ubiquitin. A series of 2D and 3D heteronuclear NMR spectra were collected from samples of 1.1 mM [U-13C,15N]-chlorella-ubiquitin dissolved in NMR buffer containing 10 mM phosphate, 0.04% NaN3, 90% H2O and 10% D2O at pH 6.6. Raw NMR data were processed with NMRPipe (Delaglio et al. 1995) and analyzed using the programs XEASY (Bartels et al. 1995) and SPARKY (T. D. Goddard and D. G. Kneller, SPARKY 3, University of California, San Francisco). 2D 1H-15N HSQC and 3D HNCO data sets were used to identify the number of spin systems, and these identifications plus 3D HNCACB and 3D CBCA(CO)NH data sets were used as input to the PINE server (Bahrami et al. 2009) to determine sequence specific backbone resonance assignments. Backbone resonance assignments were confirmed on the basis of 15N-resolved 1H-1H NOESY data. 2D 1H-13C HSQC, 3D HBHA(CO)NH, 3D HC(CO)NH, 3D C(CO)NH experiments were used to assign the side chain and 1Hα and 1Hβ resonances. A series of 2D 1H-15N HSQC, 2D 1H-13C HSQC (natural abundance), 3D 15N resolved 1H-1H NOESY experiments were recorded with identical parameters and measurement times for samples containing 0.8 mM [U-15N] protein and 0.7mM [U-2H,15N] protein produced with and without the inhibitors. Proton back exchange sites were identified and quantified through analysis of 2D 1H-13C-HSQC spectra acquired at natural abundance 13C.
Results and discussion
Proton back exchange in SAIL ubiquitin
Standard triple resonance experiments were used in determining sequence-specific backbone and side chain assignments for the sample of SAIL-chlorella-ubiquitin prepared by E. coli cell-free expression. The 2D 1H-13C-HSQC spectrum of SAIL-chlorella-ubiquitin prepared by E. coli cell-free synthesis showed evidence for proton back exchange at several sites: Hα of Gly; Hβ of Ala, Asn, and Asp; and, to a lesser extent, Hγ of Glu and Gln residues. Instead of the expected single 1Hα peak from prochiral 2H labeled Gly, each Gly residue yielded four cross peaks: a major peak from the original 13Cα–(Hα2,Dα3), a minor peak from a species resulting from internal exchange 13Cα–(Dα2,Hα3), and a doublet from 13Cα–(Hα2,Hα3) (Figure 1B). The 13Cα chemical shifts of the first two species were very similar, but that of the third was shifted by 0.3 ppm because of the deuterium isotope effect. Similarly, three signals were observed for the β-methylene groups of Asn and Asp residues. One resonance corresponds to the chiral 13Cβ1–(Hβ2,Dβ3) group from the SAIL labeling, while the other two peaks at a common 13C position result from the non-degenerate proton signals of the 13Cβ1–(Hβ2,Hβ3) group (Figure 1A). In addition, the Ala residues showed evidence of D→H exchange resulting in three distinct signals with slightly different proton and carbon frequencies and different percent occupancy for the three protons of the Ala β-methyl. One signal corresponds to the chiral CD2H SAIL labeled species, while the other two arise from the CH2D and CH3 groups. (Figure 1C). The relative levels of protonated species were calculated for back-exchanged groups with isolated peaks that could be reliably integrated (Table 1). Notably, more than 50% of the D in the β-positions of Asp and Asn showed exchange to H, resulting in the appearance of three peaks of similar intensity (Figure 1A). Such observations might not have been reported for previous SAIL labeled proteins, because, given the larger size of the proteins being studied, the additional peaks were either not seen due to line broadening or were overlapped by peaks from other groups.
Figure 1.


Expansions of the 2D 1H,13C-HSQC spectrum of SAIL chlorella ubiquitin prepared by E. coli cell-free protein synthesis. (A) 13Cβ-1Hβ region for Asp and Asn residues. The peak corresponding to the original 13Cβ–(Hβ2,Dβ3) group is indicated by a dashed red circle and labeled with an asterisk. Back exchange gave rise to two peaks corresponding to the non-degenerate CH2 protons that are circled in blue and connected by arrows. (B) Gly 13Cα-1Hα region. Four peaks were observed for each Gly residue: a major peak from the original 13Cα–(Hα2,Dα3) indicated by a dashed red circle and an asterisk, a minor peak from a species resulting from internal exchange 13Cα–(Dα2,Hα3) indicated by a red circle and an asterisk, and a doublet from 13Cα–(Hα2,Hα3) indicated by blue circles connected by arrows. (C) Alanine methyl region peaks showing signals from the original –CHD2 (dashed red circle) species and–CH2D (red circle) and –CH3 species (blue circle) resulting from exchange. The inset in each panel indicates the species that are observed for each group. The circles surrounding each group in the inset match the circles around the peaks. The species not observed for Asn/Asp, 13Cβ–(Dβ2,Hβ3), is grayed out.
Table 1.
Relative populations of protonated species in SAIL ubiquitin.a
| Methylene groups | CHD | CH2 | CDH | ||
|---|---|---|---|---|---|
| Asp |
|
D21/D32
D39/D52 D58 |
45% ±3 |
55% ±3 |
|
|
| |||||
| Asn |
|
N25/N60 | 47% ±1 |
53% ±1 |
|
|
| |||||
| Gln |
|
Q40/Q49 | 91% ±1 |
9% ±1 |
|
|
| |||||
| Glu |
|
E34/E64 | 76% | 9% | 15% |
|
| |||||
| Gly |
|
G76/G10 | 74% ±4 |
19% ±5 |
7% ±1 |
| Methyl groups | CHD2 | CH2D | CH3 | ||
|
| |||||
| Ala |
|
A28/A46
A57 |
81% ±1 |
10% ±1 |
9% ±1 |
Data are shown only for groups exhibiting significant exchange that could be easily integrated. The β-methylene groups of Asp and Asn show more than 50% D→H back-exchange, resulting in the appearance of three distinct 2D 1H,13C-HSQC peaks with similar intensity for each methylene group (Figure 1A). The column highlighted in green gives the relative protonation at the SAIL prochiral position. Volumes were measured with SPARKY software by fitting the shape of the peak to a Gaussian model.
Proton back exchange in perdeuterated ubiquitin
To better understand the mechanism of proton back exchange observed in SAIL ubiquitin and to evaluate strategies for the preparation of perdeuterated proteins by wheat germ cell-free translation, we prepared a sample of ubiquitin by wheat germ cell-free translation with [U-2H,15N]-labeled amino acids. Significant back exchange was observed at the α-positions of Gly, Ala, Asp, Glu, and Gln residues as shown in the 13Cα-1Hα region expansion of a 2D 1H-13C-HSQC spectrum in Figures 2A and B. Proton back exchange was also observed at the β-positions of Ala, Asp, and Asn residues (Figures 2C and 2D). In addition, proton back exchange was observed at the γ-positions of Glu, Gln (Figure 2E), and the ε-positions of Lys residues (Figure 2D).
Figure 2.


Expansions of the 2D 1H,13C-HSQC spectrum of [U-2H, 15N] chlorella ubiquitin prepared by wheat germ cell-free protein expression. (A) 13Cα-Hα region for all residues but Gly. Peaks from the residue types showing the most extensive exchange (Ala, Asp, and Gln) are circled in blue. (B) 13Cα-Hα region for Gly residues. Peaks resulting from back exchange are circled (red for one methylene proton and blue for two methylene protons); arrows connect peaks from non-degenerate CH2 protons; asterisks indicate peaks resulting from CHD or CDH groups. Dashed red circles identify signals matching the prochiral SAIL labeling pattern. Signals from residues with degenerate 1Hα chemical shifts are labeled ‘Cα-Qα’. (C) Ala methyl region showing D→H exchange mostly to –CH3 species (circled in blue). (D) 13Cβ-1Hβ region of Asp and Asn residues and 13Cε-1Hε region of Lys residues. Peaks resulting from back exchange are circled (red for one methylene proton and blue for two methylene protons); arrows connect peaks from non-degenerate CH2 protons. Dashed red circles identify signals matching the prochiral SAIL labeling pattern. Degenerate signals are labeled ‘Cε-Qε’. (E) 13Cγ-1Hγ region of Glu and Gln residues. Peaks resulting from back exchange are circled (red for one methylene proton and blue for two methylene protons); arrows connect peaks from non-degenerate CH2 protons. Dashed red circles identify signals matching the prochiral SAIL labeling pattern. Degenerate signals are labeled ‘Cγ-Qγ’.
Presumably exchange at α-positions is catalyzed by transaminases (Oshima and Tamiya 1961, Su et al. 2011). To test this hypothesis, we prepared [U-2H, 15N]-chlorella ubiquitin in the presence of known inhibitors of transaminases (1 mM aminoxyacetate) and glutamate synthetase (0.1 mM L-methionine sulfoximine) during the translation reaction. The inhibitor concentrations used were those previously shown to inhibit transaminases (Morita et al. 2004). Expansions of 2D 1H-13C-HSQC spectrum show significant reduction in D→H back exchange at the α-positions of all residues (Figure 3A) except for Gly (Figure 3B). In addition, the inhibitors blocked back exchange at the β-positions of Ala (Figure 3C). On the other hand, exchange at the β-positions of Asp and Asn, the γ-positions of Glu and Gln, and the ε-positions of Lys remained comparable to that observed for ubiquitin prepared in the absence of the inhibitors (Figure 3D,E).
Figure 3.


Expansions of the 2D 1H,13C-HSQC spectrum of [U-2H, 15N] chlorella ubiquitin prepared by wheat germ cell-free protein expression in presence the inhibitors. Labeling is as in Figure 2. (A) 13Cα-1Hα region for all residues but Gly. (B) 13Cα-1Hα region for Gly residues. (C) Ala methyl region. (D) 13Cβ-1Hβ region of Asp and Asn residues and 13Cε-1Hε region of Lys residues. (E) 13Cγ-1Hγ region of Glu and Gln residues. To allow comparison of peak intensities, all the spectra were plotted using parameters identical to those used for Figure 2.
The percentage of back-exchange for deuterated ubiquitin prepared by wheat germ cell-free synthesis in the absence and in the presence of the inhibitors was estimated for those groups with isolated peaks by integration with SPARKY (T. D. Goddard and D. G. Kneller, SPARKY 3, University of California, San Francisco). To determine the amount of the fully deuterated species present for each group (not visible in NMR spectra), the intensity of the peaks observed was compared with that of the corresponding peaks from an identical spectrum recorded on a fully protonated sample of [U-15N] ubiqutin. To account for differences in sample and experimental conditions, the peak volumes were normalized on the basis of 2D 1H,15N-HSQC spectra acquired back-to-back for all samples on the same spectrometer using identical parameters. The results (Figure 4A,B) clearly show that the most significant back-exchange occurs at the α-positions of Asp, Glu, Gln, Ala, and Gly, at the β-positions of Ala, Asp, and Asn, and, to a lesser extent, at the γ-positions of Glu and Gln and the ε-positions of Lys residues. Furthermore, the inhibitors effectively reduced the amount of back-exchange at the α-positions of all amino acids except for Gly and at the β-positions of only Ala. Back-exchange at all other positions was not significantly affected by the presence of the inhibitors.
Figure 4.


Extent (fraction) of D→H back exchange at different residue types of chlorella ubiquitin that occurred during the wheat germ cell-free translation reaction in H2O with a mixture of [U-2H, 15N]-labeled amino acids in the absence (red) and presence (blue) of the inhibitors. Values at individual residues are depicted by dots and averages by bars. (A) Exchange at backbone α-positions. (B) Exchange at side chain positions as indicated. The fraction of back-exchange is calculated such that the sum of all protonated and deuterated species adds up to 1. The contribution from deuterated species (invisible in the spectra) was estimated by comparing the volume of each peak in the 2D 1H,13C-HSQC spectrum of [U-2H, 15N]-ubiquitin with the volume of the corresponding peak in the 2D 1H,13C-HSQC spectrum of a fully protonated sample of [U-15N]-ubiquitin. The volumes of the 2D 1H,13C-HSQC peaks from the different ubiquitin samples were normalized based on 2D 1H,15N-HSQC spectra acquired for all ubiquitin samples back-to-back on the same spectrometer using the same acquisition parameters and processed identically. Table 2 contains a more detailed analysis of the distribution of the various protonated species.
Finally, for methylene groups that undergo back-exchange, we further investigated the percent population of the various protonated species observed (CH2, CHD and CDH). In particular, we wanted to determine whether preferential exchange occurs at either of the prochiral positions. The results (Table 2) show that, although typically one position does exchange more than the other, the difference is significant only at the β-positions of Asn and to a lesser extent at the β-positions of Asp. Exchange effects appear to be similar in prokaryotic (E. coli) and eukaryotic (wheat germ) cell-free translation reactions, in that the prochiral positions that exhibited the highest back exchange in wheat germ synthesis were the same found to have exchanged in SAIL ubiquitin produced by E. coli cell-free synthesis: both resulted in the appearance of roughly equal peaks from single and double D→H exchange at β-positions (Table 1). We also observed that addition of the inhibitors did not affect the level of exchange at methylene sites (Table 2).
Table 2.
Relative populations of protonated species in perdeuterated ubiquitin prepared in the absence and in the presence (second row, percent values shown in blue) of the inhibitors.a
| CH2 | CHD | CDH | CDH CHDb |
|||
|---|---|---|---|---|---|---|
| Asp |
|
D32/D39 | 38% ±2 |
28% ±3 |
35% ±1 |
|
| 41% ±1 |
25% ±1 |
33% ±1 |
||||
|
| ||||||
| Asn |
|
N25/N60 | 16% ±3 |
24% ±2 |
60% ±2 |
|
| 15% ±2 |
27% ±2 |
58% ±2 |
||||
|
| ||||||
| Gln |
|
Q62 | 18% |
37 % |
45% |
|
| 20% | 39% | 41% | ||||
|
| ||||||
| Glu |
|
E34/E64 | 25% ±8 |
35 % ±7 |
47% ±7 |
|
| 19% ±4 |
39% ±5 |
47% ±5 |
||||
|
| ||||||
| Gly |
|
G10/G76 | 40% ±5 |
27% ±2 |
33% ±3 |
|
| 33% ±7 |
35% ±4 |
32% ±3 |
||||
|
| ||||||
| Lys |
|
K6/K11
K63 |
77% ±1 |
23% ±1 |
||
| 75% ±6 |
25% ±6 |
|||||
Data are shown only for groups exhibiting significant exchange with isolated peaks that could be easily integrated. The values were calculated such that all protonated species summed to 100%, i.e. the fully deuterated species is not taken into account. To see the fraction of protonated vs. deuterated species refer to Figure 4. The column highlighted in green gives the percent of protonation at the prochiral position that is protonated in SAIL-ubiquitin.
The chemical shifts of the methylene protons are degenerate.
Alanine β-proton in transamination
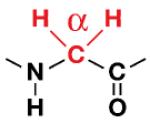
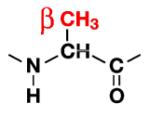
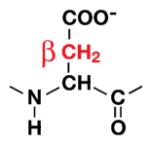
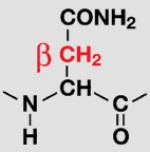
A mechanism for the transamination reaction has been proposed that explains proton exchange at the α- and β-positions of Ala (Scheme 1) (Oshima and Tamiya 1961). During step I of the reaction, a Schiff base is formed between the amino acid and pyridoxal phosphate; subsequently a proton is lost from the β-carbon, and a hyperconjugated double-bond system is formed in the intermediate shown in step II. According to this scheme, a proton can then be incorporated from the aqueous solution at either the α- or β-position. This mechanism offers an explanation for the comparable levels of proton back-exchange that we observed at the α- and β-position of Ala residues (Figure 4A,B). Furthermore, this mechanism also accounts for the decreased back-exchange we found when ubiquitin was prepared in the presence of the inhibitors, because blocking the transamination reaction would reduce proton back-exchange (Figure 3C).
Scheme 1.

Proposed transamination reaction mechanism leading to exchange at the Hα and Hβ positions of alanine.
Conclusions
We have used ubiquitin as a model for evaluating strategies for the preparation of a perdeuterated protein by incorporating 2H-labeled amino acids with wheat germ cell-free translation. We found that in the absence of inhibitors, proton back exchange occurred at many sites, leading to signals from backbone α-protons and several side chain β-, γ-, and ε- protons. The addition of inhibitors to the wheat germ cell-free reaction blocked proton back exchange at the α-positions of all residues with the exception of Gly and at the methyl protons of Ala residues. However, partial back exchange continued to occur at several side chain sites. The patterns of exchange appear to be similar in the ubiquitin samples prepared by prokaryotic (E. coli) and eukaryotic (wheat germ) cell-free methods. We have not evaluated these inhibitors with E. coli cell-free protein production, but expect that they will be effective given the mechanistic conservation of the transamination reactions. We note that it may be advantageous to take advantage of these exchange reactions for the purpose of preparing perdeuterated proteins with selective protonation for NMR investigations of larger proteins, membrane proteins, protein-protein complexes, and protein-RNA complexes. While these studies were underway, it was reported that pretreatment with sodium borohydride of S30 E. coli extracts used for cell-free protein production can minimize proton exchange into the Hα positions of deuterated amino acids (Su et al. 2011). Sodium borohydride inhibits PLP-dependent enzymes; however, as shown here, selective inhibition of these enzymes did not prevent exchange at the Hα positions of Gly or various Hβ positions.
Acknowledgements
We thank Cambridge Isotope Laboratories for supplying the labeled amino acids used in this study. This work was supported by NIH grants U54 GM074901, which funds the Center for Eukaryotic Structural Genomics (CESG), and P41 RR02301, which funds the National Magnetic Resonance Facility at Madison. The authors thank the many other CESG staff members who assisted in preparing the protein samples.
References
- Bahrami A, Assadi AH, Markley JL, Eghbalnia HR. Probabilistic interaction network of evidence algorithm and its application to complete labeling of peak lists from protein NMR spectroscopy. PLoS Comput Biol. 2009;5:e1000307. doi: 10.1371/journal.pcbi.1000307. [DOI] [PMC free article] [PubMed] [Google Scholar]
- Bartels C, Xia TH, Billeter M, Güntert P, Wüthrich K. The program XEASY for computer-supported NMR spectral-analysis of biological macromolecules. J Biomol NMR. 1995;5:1–10. doi: 10.1007/BF00417486. [DOI] [PubMed] [Google Scholar]
- Delaglio F, Grzesiek S, Vuister GW, Zhu G, Pfeifer J, Bax A. NMRPIPE - A multidimensional spectral processing system based on UNIX pipes. J Biomol NMR. 1995;6:277–293. doi: 10.1007/BF00197809. [DOI] [PubMed] [Google Scholar]
- Etezady-Esfarjani T, Hiller S, Villalba C, Wüthrich K. Cell-free protein synthesis of perdeuterated proteins for NMR studies. J Biomol NMR. 2007;39:229–238. doi: 10.1007/s10858-007-9188-0. [DOI] [PubMed] [Google Scholar]
- Ikeya T, Takeda M, Yoshida H, Terauchi T, Jee JG, Kainosho M, Güntert P. Automated NMR structure determination of stereo-array isotope labeled ubiquitin from minimal sets of spectra using the SAIL-FLYA system. J Biomol NMR. 2009;44:261–272. doi: 10.1007/s10858-009-9339-6. [DOI] [PubMed] [Google Scholar]
- Kainosho M, Güntert P. SAIL--stereo-array isotope labeling. Q Rev Biophys. 2009;42:247–300. doi: 10.1017/S0033583510000016. [DOI] [PubMed] [Google Scholar]
- Kainosho M, Torizawa T, Iwashita Y, Terauchi T, Ono A Mei, Güntert P. Optimal isotope labelling for NMR protein structure determinations. Nature. 2006;440:52–57. doi: 10.1038/nature04525. [DOI] [PubMed] [Google Scholar]
- Klammt C, Schwarz D, Dötsch V, Bernhard F. Cell-free production of integral membrane proteins on a preparative scale. Methods Mol Biol. 2007;375:57–78. doi: 10.1007/978-1-59745-388-2_3. [DOI] [PubMed] [Google Scholar]
- Makino S, Goren MA, Fox BG, Markley JL. Cell-free protein synthesis technology in NMR high-throughput structure determination. Methods Mol Biol. 2010;607:127–147. doi: 10.1007/978-1-60327-331-2_12. [DOI] [PubMed] [Google Scholar]
- Morita EH, Shimizu M, Ogasawara T, Endo Y, Tanaka R, Kohno T. A novel way of amino acid-specific assignment in 1H-15N HSQC spectra with a wheat germ cell-free protein synthesis system. J Biomol NMR. 2004;30:37–45. doi: 10.1023/B:JNMR.0000042956.65678.b8. [DOI] [PubMed] [Google Scholar]
- Oshima T, Tamiya N. Mechanism of transaminase action. The Biochem Journal. 1961;78:116–119. doi: 10.1042/bj0780116. [DOI] [PMC free article] [PubMed] [Google Scholar]
- Su X-C, Loh C-T, Qi R, Otting G. Suppression of isotope scrambling in cell-free protein synthesis by broadband inhibition of PLP enymes for selective 15N-labelling and production of perdeuterated proteins in H2O. J Biomol NMR. 2011;50:35–42. doi: 10.1007/s10858-011-9477-5. [DOI] [PubMed] [Google Scholar]
- Tugarinov V, Kanelis V, Kay LE. Isotope labeling strategies for the study of high-molecular-weight proteins by solution NMR spectroscopy. Nature protocols. 2006;1:749–754. doi: 10.1038/nprot.2006.101. [DOI] [PubMed] [Google Scholar]
- Vinarov DA, Newman CL Loushin, Markley JL. Wheat germ cell-free platform for eukaryotic protein production. FEBS Journal. 2006;273:4160–4169. doi: 10.1111/j.1742-4658.2006.05434.x. [DOI] [PubMed] [Google Scholar]