

Abstract
As more evidence is presented suggesting that the phase, as well as the magnitude, of functional MRI (fMRI) time series may contain important information and that there are theoretical drawbacks to modeling functional response in the magnitude alone, removing noise in the phase is becoming more important. Previous studies have shown that retrospective correction of noise from physiologic sources can remove significant phase variance and that dynamic main magnetic field correction and regression of estimated motion parameters also remove significant phase fluctuations. In this work, we investigate the performance of physiologic noise regression in a framework along with correction for dynamic main field fluctuations and motion regression. Our findings suggest that including physiologic regressors provides some benefit in terms of reduction in phase noise power, but it is small compared to the benefit of dynamic field corrections and use of estimated motion parameters as nuisance regressors. Additionally, we show that the use of all three techniques reduces phase variance substantially, removes undesirable spatial phase correlations and improves detection of the functional response in magnitude and phase.
Keywords: fMRI, physiologic noise, magnetic field correction, complex-valued
1. Introduction
The functional magnetic resonance imaging (fMRI) signal is corrupted not only by random thermal noise, but by systematic noise associated bulk motion of the head as well as noise associated with heart beat and respiration. The signal not of interest due to motion is usually dealt with by estimating the motion occurring throughout the acquisition and using the estimations to register each acquired volume to a common reference using tools such as the AFNI plugin 3dvolreg (Cox, 1996). Reduction of physiologic noise, on the other hand, is often accomplished by applying RETROICOR (Glover et al., 2000) using the information from physiologic recordings of the subject’s heart rate and respiration during the scan. These corrections are both typically done for the magnitude of the signal only, due to the fact that phase is typically discarded when performing statistical analysis of the blood oxygenation level dependent (BOLD) fMRI to detect active brain areas (Ogawa et al., 1990).
It is becoming more and more likely that it may be beneficial to consider including the phase in analysis of fMRI data. First, the BOLD phase response may be non-negligible in brain areas containing uniformly oriented vasculature (typically macrovasculature) (Hoogenraad et al., 1998;Menon, 2002; Nencka and Rowe, 2007) and results have been reported that complex-valued analysis can suppress activation from these areas (Rowe and Nencka, 2006; Nencka and Rowe, 2007). A phase response may additionally be associated with BOLD activity in areas of microvasculature (Zhao et al., 2007). Whether the phase response in these two cases can be distinguished has yet to be shown, however it may present an opportunity to use the phase to probe the vascular structure at the site of activation. Second, it has been suggested that the response in the fMRI signal directly associated with neuronal action potentials may be manifested to some degree in the phase (Bandettini et al., 2005; Bodurka et al., 1999; Bodurka and Bandettini, 2002; Heller et al., 2007; Petridou et al., 2006). Whether or not this response can be detected in vivo is still not clear, but it seems most likely to be found in the complex-valued signal. Finally, statistical analysis of only the magnitude of the fMRI signal has inherent drawbacks. For one, only half the data is used which reduces statistical detection power. Noise in the magnitude is also not normally distributed, an assumption generally made in least-squares regression used to detect activation, at high signal-to-noise ratio (SNR). This is typically not a problem inside the brain given the scan parameters most commonly used, but can be an issue where B0 field inhomogeneity causes signal dropout or in experiments with atypically high resolution or short repetition times where SNR is reduced. Recent work has also shown that non-negativity and edge effects may be problematic when performing magnitude-only BOLD fMRI analysis (Chen and Calhoun, 2011).
The apparent advantages of complex-valued statistical analysis of fMRI data begs the question as to why it is so uncommon in practice. Previous work by Nencka and Rowe (2007); Hahn et al. (2009, 2011) have demonstrated the difficulty of complex-valued signal modeling, suggesting that unexpectedly large noise in the phase (given complementary noise in the magnitude) is the culprit. If the complex-valued signal is corrupted by thermal noise alone and SNR is high, the phase noise and magnitude SNR should be inversely related. Recent investigations into the noise characteristics of the phase signal have indeed shown that temporal variation in the phase is typically much larger than expected for a given magnitude SNR (Hagberg et al., 2008; Petridou et al., 2009). If this additional phase variance is not accounted for, including phase in the statistical model greatly reduces detection power.
It is reasonable to assume that the sources of variance in the phase are the same as those in the magnitude, i.e. motion and physiologic phenomena such as respiration and heart rate, with the case being that these effects manifest much more strongly in the phase than the magnitude. This assumption, at least with respect to physiologic phenomena (specifically respiration), appears to have been corroborated by Petridou et al. (2009), who showed that performing physiologic RETROICOR regression on the phase signal reduced phase variance by 7%-90% while similarly reducing magnitude variance by and average of 1%-2%. In white matter, the ratio of phase to magnitude SNR approached the theoretical value, but did not quite do so in grey matter. Hahn et al. (2011) demonstrated a method for improving complex-valued time series characteristics with regard to residual normality and temporal autocorrelation, as well as vastly improving the utility of complex-valued activation detection. That method involved using a dynamic magnetic field mapping technique, referred to as temporal off-resonance alignment of single-echo time series (TOAST), to correct for the undesirable phase variance, in addition to incorporating a compensation for bulk motion using motion estimates as models for nuisance signal in the regression analysis.
It is the goal of this work to both compare the performance of removing physiologic sources of noise from the phase using physiologic RETRICOR regressors with TOAST and motion compensation, and to incorporate complex-valued physiologic RETROICOR regressors into the method used in Hahn et al. (2011), such that TOAST is applied to remove spatially correlated noise of arbitrary sources and motion and physiologic noise sources are modeled as nuisance signal in the regression analysis used to detect activation. The performance of TOAST, motion regression and physiologic noise regression will be evaluated by investigating the phase variance, the spectral phase signal characteristics, spatial phase correlation structure and activation maps when applying different combinations of correction techniques.
2. Materials and Methods
2.1. Data Acquisition
Two fMRI data sets were acquired with a single human subject in a single scan session using a GE Signa LX 3T scanner (General Electric, Milwaukee, WI) using the stock quadrature head receiver coil, and functional images were collected with a single-shot echo planar imaging (EPI) pulse sequence (9 slices, 96 × 96 matrix, 2.5mm × 2.5mm × 2.5mm voxels, 42.8ms TE, 1 s TR, 45° flip angle, 125 kHz readout bandwidth, 0.768ms echo spacing, 510 repetitions). During both acquisitions, the echo time was increased in 2.5ms increments from repetition 11-15 and this was repeated again for repetitions 16-20. This provided information to compute a static magnetic field offset map using the method described in Reber et al. (1998). The first of the two scans was acquired with the subject at rest, with eyes open fixated on a single point of their choice. This is similar to the type of data acquired for functional connectivity MRI (fcMRI) (Biswal et al., 1995), and thus does not include any signal fluctuations related to any explicit stimulus. During the second scan, the subject was asked to perform a simple unilateral finger tapping task, with a block design of 16 epochs of 15 s on, 15 s off, beginning at repetition 31 (repetitions 1-30 were all off). The subject was queued when to tap and when to rest visually, where the screen was black during rest and the word “tap” was displayed when the subject was to perform the finger tapping task.
The subjects respiration and heart rate were monitored during both acquisitions using a bellows belt and pulse oximeter. The pulse oximeter was placed on the hand opposite that used for finger tapping to avoid inducing artifacts in the heart rate signal.
2.2. Data Processing and Analysis
All acquired image data were reconstructed offline from raw GE p-files. Data processing required for image reconstruction and correction of magnetic field dynamics was done with a custom program written in C and designed in-house. The process flow for every correction method involved image generation from k-space by inverse Fourier transform, Nyquist ghost removal and correction for global, zero-order, off-resonance using three navigator echos (Nencka et al., 2008) and estimation of the static magnetic field offset from repetitions 10-20 with varying echo times was performed using the method of Reber et al. (1998). To summarize these processes, the ghosting, caused by alternating shifts in the readout lines of k-space acquired in opposite directions, is corrected using the Fourier shift theorem to shift each readout line of k-space by the amount calculated from navigator echoes. The zero-order off-resonance is corrected by removing the accumulated phase due to the off-resonance, again measured from the navigator echoes, from each readout line of k-space. The phase removed from each line is dependent on the off-resonance value and the time between the acquisition of the readout line and the application of the RF excitation pulse. Calculation of the static magnetic field offset involves fitting a line to the relationship between the phase in each voxel and echo time. The slope of that line represents the static off-resonance and is computed voxel-wise. When TOAST was used, the dynamic field was found and combined with the static field map as described in (Hahn et al., 2009). Other dynamic magnetic field mapping techniques than TOAST have been proposed, such as that described by Roopchansingh et al. (2003). The basis for the choice to use TOAST opposed to another technique here is based on the discussion of the advantages and drawbacks of both TOAST and other dynamic field mapping techniques by Hahn et al. (2009).
Before applying field maps in the correction, the raw maps (both static alone or the combination of static and dynamic as needed) were processed to reduce noise, while maintaining low spatial frequency information and eliminating high spatial frequency field fluctuations potentially related to desirable activity, with the goal of minimizing estimation artifacts at the image boundaries. This was accomplished by using a locally weighted least squared regression (Cleveland and Devlin, 1988). The first step in this process was to censor voxels to be used in the fitting procedure. A binary mask of voxels above 7% of the maximum voxel magnitude was generated, representing voxels within the brain. Voxels well outside the brain were selected by dilating the original mask by 10 voxels and then inverting it. These voxels had the value of the estimated field (originally only noise) set to zero. This caused the fit of the raw estimated field to fall to zero outside the brain. The voxels not contained within either of these two masks were censored and not used in the fitting procedure.
The next step involved moving voxel by voxel over the entire image and fitting a weighted two-dimensional polynomial using the 20% of all non-censored voxels which are closest (by Euclidean distance) to the current voxel. After selecting the closest 20% of voxels, a tri-cube weight function is used to weight each point according to its distance from the current point. The weight for the jth point, wj, is found using
| (1) |
where dj is the Euclidean distance between the current voxel and the jth voxel and dmax is the maximum Euclidean distance between the current voxel and a voxel within the closest 20% of non-censored voxels. The two-dimensional polynomial coefficients were fit using weighted least-squares according to
| (2) |
| (3) |
The jth row of X is xj, and dx,j and dy,j are the distance from the current voxel in the x-direction and y-direction of the jth voxel, respectively. W is a diagonal matrix, the jth diagonal element of which is wj from Equation 1. P is a 5-element vector containing the polynomial coefficients.
Once the coefficients for the fit were computed at a specific point, the value of the processed estimated field at that point was calculated. It should be noted that the estimated value of the voxel of interest is simply the first element of P, because the distance from itself is clearly zero in each direction (i.e. designed to be located at position x = y = 0).
Once this processing has been carried out, the field maps were applied using the one-dimensional (phase-encoding direction) Simulated Phase Rewinding (SPHERE) (Kadah and Hu, 1997) correction method to remove their effects from the original images.
As a final processing step, the angular mean (Rowe et al., 2007) of each voxel time series following the dynamic field correction was subtracted out to prevent phase wrapping within the imaged object. No voxels inside the object drifted more than 2π radians over the length of the experiment, especially after being corrected for the field dynamics, and zeroing the mean was sufficient in all cases to prevent wraparound in voxels within the head.
The complex-valued generalized likelihood ratio detection model used is that described in detail by Rowe (2005b). In short, the model allows separate design matrices for the magnitude and phase as well as separate contrast matrices to perform arbitrary general linear tests of the significance of various linear combinations of regressors. In this work, magnitude and phase design matrices were identical (but resulted in different estimated magnitude and phase coefficients). They included a constant and linear trend in each case, and included regressors to compensate for motion, physiologic RETROICOR regressors, or both as appropriate. Motion regressors were computed using the AFNI plugin 3dvolreg (Cox, 1996) which yields 6 separate waveforms (3 for translational, 3 for rotational motion). If TOAST is also being used, motion was estimated after applying TOAST. Physiologic RETROICOR regressors were computed from the respiration and heart beat waveforms as described by Glover et al. (2000), resulting in 8 waveforms (4 for respiration, 4 for heart rate). Modeling of the data set including finger tapping included one additional reference function in the design matrices corresponding to the task stimulus. The stimulus reference function was modeled here by a function that is simply −1 during task off periods and 1 during task on periods, shifted by 4 s to account for hemodynamic delay. The shifted boxcar was chosen as opposed to a more elaborate reference curve, for example the boxcar convolved with a gamma function, for the sake of simplicity. The relative accuracy of a boxcar and an alternative model function is not well known with respect to the phase response, and will likely vary with location.
The frequecy spectra as well as the spatial correlations of the residual phase time series following the regression were investigated and are presented in the results to follow. Additionally, activation maps showing results of tests of the significance of the stimulus reference function in both magnitude and phase are presented.
3. Results
Characteristics of the distribution of the phase variance, magnitude variance, and ratio of phase standard deviation to the inverse temporal magnitude SNR (tSNR) in all voxels within the brain over all 9 slices in the resting state data set (n = 14579) are shown following various corrections in Figure 1. These boxplots show the minimum, maximum, median, 1st and 3rd quartiles where outliers are removed if they are greater than the value of quartile 3 plus 5 times the interquartile range. The phase variance plots in Figure 1a show that TOAST reduces the variance by a much larger amount than either motion or physiologic regression alone, however, the use of all three provides minimum phase variance of the corrections applied. The ratio of phase standard deviation to inverse magnitude tSNR plots in Figure 1b again show that without TOAST, this ratio does not approach the theoretical value of 1. However, applying either TOAST alone or TOAST with physiologic regression results in a distribution of ratios with a median near 0.965 and 3rd quartile near 1.01. This indicates that nearly 75% of voxels have lower than theoretical ratios in these cases (ideally we would expect that number to be close to 50%). When motion regression is added, the median rises to around 1.02 (slightly lower with TOAST and physiologic regression), indicating that the distribution is centered right around the theoretical value. The reason the ratio rises with motion regression can be seen from Figure 1c, which shows boxplots of magnitude variance distribution. TOAST does not change the magnitude variance distribution much (although the minimum 25th and 75th percentiles and the minimum median are obtained with TOAST, motion and physiologic regression), however, the motion regression significantly reduces magnitude variance and thus magnitude tSNR. It is apparent that in the absence of TOAST, both motion and physiologic regression reduce the phase variance more than they reduce magnitude variance. However, when TOAST is applied first, motion regression does the opposite and physiologic regression seems to reduce both magnitude and phase in equal proportions.
Figure 1.
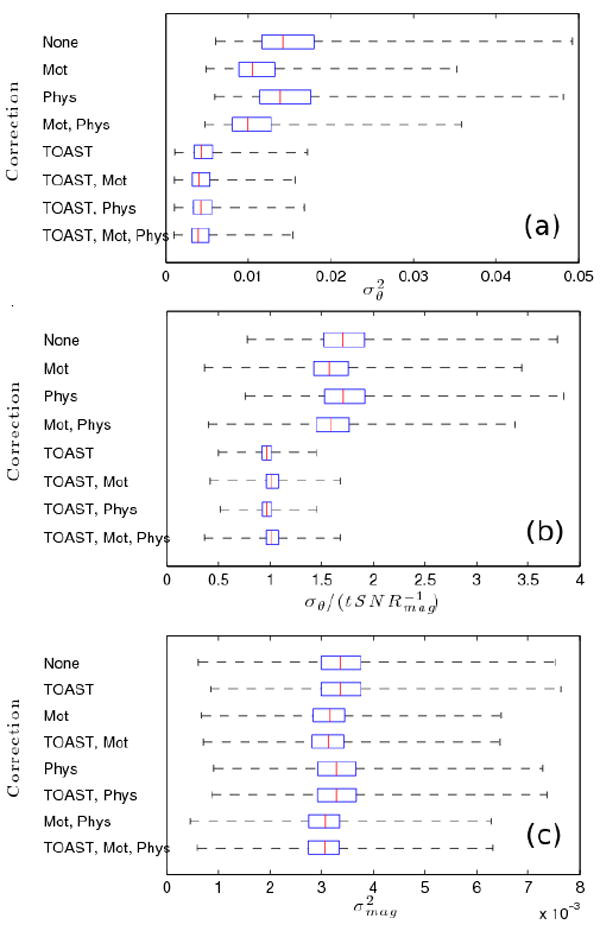
Boxplots of distribution characteristics of the phase variance, , (a), the ratio of phase standard deviation to inverse magnitude temporal SNR, , (b) and the magnitude variance, , (c) in all voxels within the brain over all 9 slices in the resting state data set following various corrections. For each correction, the median value is shown as a red line and the blue box is bounded on the left by the 25th percentile and on the right by the 75th percentile (i.e. 1st and 3rd quartiles). The black dotted lines show the minimum value on the left and the maximum on the right, after removing outliers. Values are considered outliers if they lie more than 5 times the interquartile range (width of blue box) above the 75th percentile.
To supplement the results presented in Figure 1, Table 1 provides the distribution parameters (min, max, median, 1st and 3rd quartiles) of the magnitude tSNR following different correction combinations. This data further supports what is shown in Figure 1c, in that TOAST does not significantly increase tSNR, but the nuisance regression does. It also shows quite clearly how, when TOAST is not used, the combination of motion and RETROICOR regression appear to perform better than would be expected given the performance of each individually.
Table 1.
Distribution parameters of magnitude tSNR over all voxels inside the brain from the resting state data set following different correction combinations
| Corrections | Min | 1st Quartile | Median | 3rd Quartile | Max |
|---|---|---|---|---|---|
| None | 4.42 | 12.97 | 14.67 | 16.44 | 28.20 |
| TOAST | 3.95 | 13.00 | 14.71 | 16.48 | 29.79 |
| Mot. | 4.82 | 13.63 | 15.49 | 17.56 | 29.36 |
| TOAST, Mot. | 3.82 | 14.11 | 16.04 | 18.11 | 32.34 |
| Phys. | 4.32 | 13.14 | 14.86 | 16.63 | 29.02 |
| TOAST, Phys. | 3.88 | 13.19 | 14.90 | 16.70 | 28.58 |
| Mot., Phys. | 5.11 | 14.21 | 16.14 | 18.25 | 32.14 |
| TOAST, Mot., Phys. | 4.01 | 14.24 | 16.20 | 18.28 | 35.11 |
The square root of the power spectra (magnitude of Fourier spectra) of the phase in voxels within all 9 slices of the brain in the resting state data set (n = 14579) were compared to determine how well TOAST, motion regression and physiologic regression removed noise both individually and when used together. The square root power was used because pairwise differences in the square root of the power are normally distributed, whereas differences in power are not. This allows the significance of the mean difference in power at each frequency following different correction methods to be computed with a pairwise t-test. However, for simplicity the use of the term power going forward will refer to the square root power unless specifically noted otherwise.
The mean phase power spectrum is shown before applying any corrections in Figure 2a. It shows an elevation in the very low frequencies as well as a hump around 0.1 Hz. An important point should be made here considering this spectrum. The reconstruction process included a zero-order main field off-resonance correction as part of the method described in Nencka et al. (2008). This effectively removes a large amount of the constant (over space) frequency off-set, and thus the associated phase accumulated, at each time point over the acquisition. This alone immensely reduces the power in the phase near the respiration frequency especially, which is between about 0.05-0.1 Hz. If this zero-order correction is not made, the peak in the average power is many times larger than shown in Figure 2a. However, the zero-order off-resonance drifted over the course of the scan so severely that if left uncorrected, the images at the end of the acquisition appear shifted by nearly 6 voxels compared to those at the beginning. The cause of this off-resonance drift is most likely gradual heating. The resting-state data set was acquired first, followed by the data set with the functional task and this severe drift was only present in the former, suggesting that a thermal equilibrium was reached by the end of the first scan. The zero-order correction was not strictly necessary for analysis of the functional data set but was applied anyway for the sake of consistency. The zero-order correction almost completely fixes this. The important point here is that not only will further correction have less impact than it otherwise might have, but this may have also affected the temporal phase characteristics enough so that the physiologic regressors (specifically with respect to respiration) may no longer fit as well over the whole brain. This should be kept in mind when interpreting the results to follow.
Figure 2.
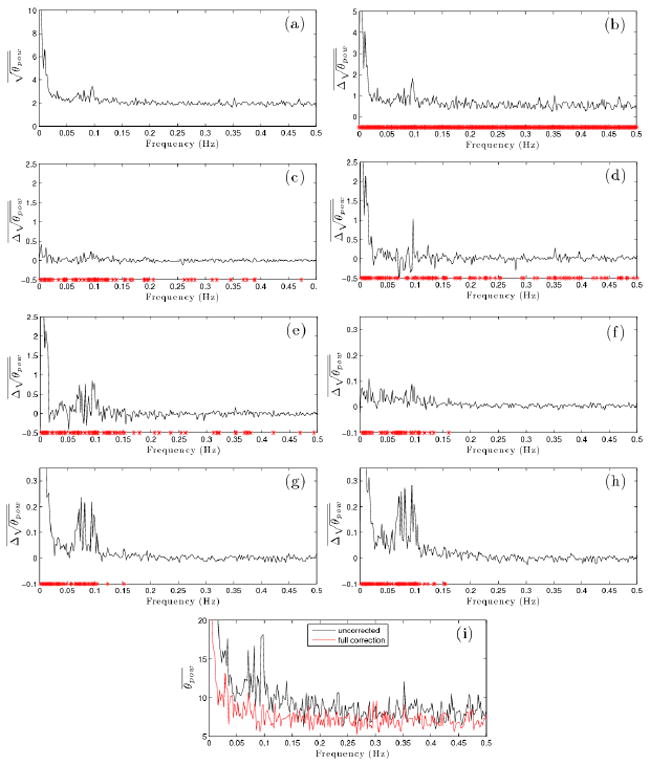
Voxels used for these plots were all those inside the brain in all slices from the resting state data set (n = 14579). The mean voxel square root of the phase power spectrum, , (i.e. the Fourier spectrum magnitude) with no correction is shown in (a). In (b)-(e), the mean of the pairwise voxel difference in square root phase power, , between the uncorrected data and data corrected with TOAST only (b), physiologic correction only (c), motion regression only(d) and both motion and physiologic regression (e) is shown. In (f)-(h), the mean of the pairwise voxel difference in square root phase power, , between the data corrected with TOAST only and the data corrected with TOAST and physiologic regression (f), TOAST and motion regression (g) and TOAST, motion and physiologic regression (h) is shown. Red stars indicate frequencies where the mean pairwise difference is significantly greater than zero at p < .05 threshold, Bonferroni corrected for multiple comparisons. The mean voxel phase power, , with no corrections as well as after correction with TOAST, motion and physiologic regression is shown in (i).
The plots in Figures 2b-h show mean pairwise differenced between the uncorrected signal and the signal following various combinations of applied corrections. Additionally, red stars are shown below frequencies at which the uncorrected phase power is greater than the corrected phase power by pairwise t-test at Bonferroni corrected p < .05 (uncorrected p < 2.96 × 10⁻⁵). It should be noted that the sample size here is very large (n = 14579), so it requires very little positive mean difference to reach the extreme level of significance used here. While it is still a useful statistic, more qualitative comparison between correction combinations is important.
The most apparent result shown in Figures 2b-e, which depict the pairwise difference between the power in the uncorrected signal and the signal corrected with either TOAST (Fig. 2b), physiologic waveforms (Fig. 2c), motion (Fig. 2d) or both motion and physiologic waveforms (Fig. 2e), is that TOAST clearly performs far better than any of the others on their own (note the difference in scale in Figure 2b and Figures 2c-e). It is also interesting to note that using physiologic regressors alone makes little impact (mean difference < 0.5 everywhere), although it does significantly reduce power at a wide range of frequencies (although, mostly clustered at lower frequency). Motion regression alone does much better at very low frequency, removes a peak near 0.1 Hz, and also significantly reduced power at a range of frequencies. However, it clearly increases the power at many frequencies as well, notably around 0.025 Hz, between 0.075 Hz and 0.1 Hz, and at a few other frequencies near 0.15 Hz and 0.28 Hz. Interestingly, including the physiologic waveforms with motion does much better than might be expected from the results of physiologic regression alone. The power in the physiologically related frequencies (heart rate is aliased into the low frequencies near the respiration frequency) is reduced as well as very low frequency power. There are still, however, clearly multiple frequencies where mean phase power increases a substantial amount.
The fact that TOAST reduces power so much more than any of the other methods motivates Figures 2f-h, which show pairwise differences between phase signal power after correction with only TOAST and the phase power after correction with physiologic waveforms (Fig. 2f), motion (Fig. 2g) and both motion and physiologic waveforms (Fig. 2h) in addition to TOAST. This allows the relatively small, but non-negligible, effect of the regressions to be seen clearly. Similarly to the results without TOAST, the motion regression alone seems to be slightly more beneficial than physiologic regression alone. The motion regression reduces power significantly at very low frequencies as well as in the 0.05 Hz to 0.1 Hz range, while physiologic regression reduces power over a similar frequency range but to a lesser degree. In this case the combination of motion and physiologic regression performs about as one would expect. In fact, although not shown here, the mean difference between motion alone and both motion and physiologic regression (all with TOAST) yields something very similar to the difference between no regression and just physiologic regression (again with TOAST in both cases) (Fig. 2f). These plots also show that when applied in conjunction with TOAST, all of the regressions result almost exclusively in decreases in power, and in the few cases where mean power difference is negative, it is negligible. This is in stark contrast to what is seen without TOAST. Additionally, the frequencies which are significantly reduced by the regressions when applied with TOAST are all below 0.16 Hz. When applied without TOAST, significant power reduction was achieved over the range of frequencies. Finally, the regressions clearly have a reduced impact following TOAST (noting the scale on Figures 2f-h compared to Figures 2c-e). This is not unexpected, since it is likely TOAST removes much of the signal power that the regressions were removing in the absence of TOAST. What is being removed by regression in this case is likely spatially localized. TOAST does not remove this by design since desirable signal activity is expected to have similar spatial characteristics. In all, it is clear that the best results (in terms of mean phase signal power spectrum) are achieved using TOAST, motion and physiologic regression in tandem.
Figure 2i shows the mean phase power spectrum (not the square root in this case) in the fully corrected signal (TOAST and full regression) plotted in red. The original uncorrected phase power (again not the square root as in Figure 2a) is shown as well for reference. The improvement is clear, but phase power in frequencies below about 0.075 Hz clearly remains elevated (on average) relative to higher frequency (> 0.1 Hz) components. It is entirely possible that this low frequency power is associated with the low-frequency fluctuations used for fcMRI analysis. Further investigation beyond the scope of this paper would be interesting to attempt to verify the identity of the source of the phase fluctuations at these frequencies.
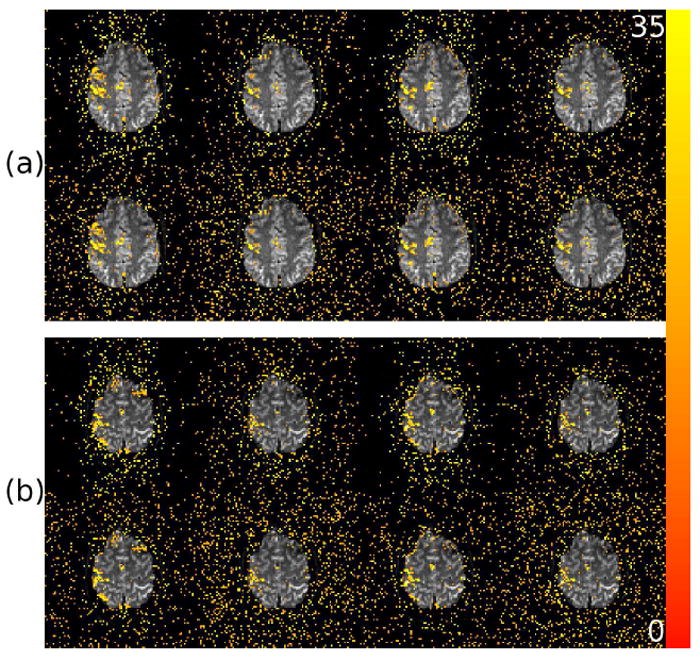
Further investigation of the effect of complex-valued physiologic regression applied with and without TOAST is shown in Figure 3. The significance of the regression coefficients corresponding to the 8 physiologic RETROICOR waveforms was tested in both the magnitude and phase. The significance of each coefficient was tested individually in magnitude and phase and the test statistic resulting from the complex-valued regression was thus Chi-square distributed with 16 degrees of freedom. Figure 3a shows the result of the test in all slices from the resting state data set without TOAST and Figure 3b shows the same but with TOAST. The significance of the physiologic regressors appears increased with TOAST in certain slices but the opposite appears true in others. The physiologic regression appears to removemore phase power without TOAST than with TOAST (see Figures 2c and 2f), so one might expect much greater significance when not using TOAST. However, TOAST itself removes a large amount of phase variance so that a similar proportion of variance is removed by physiologic regression in that case as when TOAST is not used. The most important thing to notice is that the spatial distribution of significant voxels is different to some degree when TOAST is used opposed to when it is not. Without TOAST, there are some slices that clearly show patterns where significant voxels are grouped closely over a large area in space, which suggests that physiologic noise is present on large spatial scales. This is clearest in the anterior brain in the top slice (most inferior) and the global nature of the significant voxels in the seventh slice from the top in Figure 3a, although there are other locations in other slices as well. When TOAST is applied, the active voxels are much more spatially distributed, i.e. there are no large clusters of significant voxels, indicating that TOAST removed physiologic noise over large spatial scales but that residual physiologic noise is present on much smaller scales. It is worth noting when interpreting these results that the significance may be related to reduction in the variance of the phase, magnitude or both.
Figure 3.
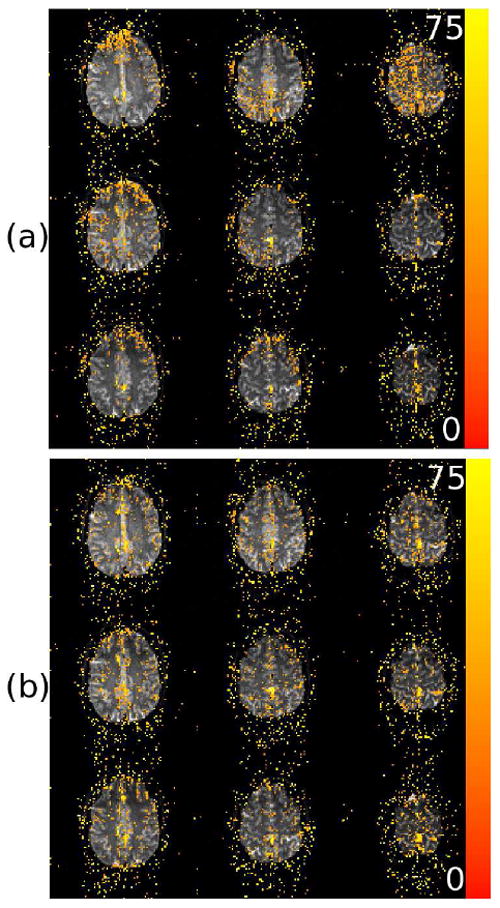
Maps of the χ2 (16 degrees-of-freedom) statistics associated with tests of the significance of the 8 physiologic RETROICOR regressors in the magnitude-and-or-phase without TOAST (a) and with TOAST (b). All nine slices from inferior to superior (top to bottom, left to right) are shown from the resting state data set. Active voxels are shown above a threshold of p < .01 (unadjusted). Color saturates at a χ2 of 75, corresponding to p < 1.3 × 10⁻⁹.
To determine exactly how the physiologic regressors are fit, maps of the regression coefficients for the 8 physiologic RETROICOR phase regressors are shown in Figure 4 for a single slice in the resting state data set. The fit of the regressors without TOAST are shown in Figure 4a and the fit following TOAST is shown in Figure 4b. It is clear that without TOAST, spatially global patterns are apparent, while following TOAST the pattern of non-zero coefficients is much more spatially localized (no large scale patterns are apparent). This corroborates the assumption stated earlier and the results in Figure 3 that following TOAST, physiologic regression is removing signal that exists on small spatial scales.
Figure 4.
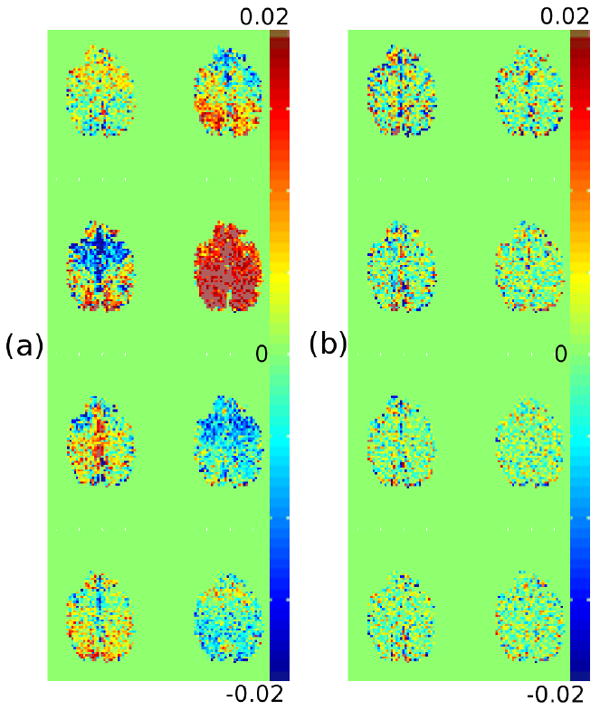
Maps of the coefficients fit to each of the 8 physiologic RETROICOR regressors in the phase in a single slice of the uncorrected data (a) and the data corrected with TOAST (b) in the resting state data set.
A final analysis of the performance of the corrections is shown in Figure 5. A random voxel (indicated by the dark red voxel at the center of the black square in Figure 5c) from within the brain was chosen from a single slice in the resting state data set. The phase residual of this voxel was then correlated with the phase residuals of every other voxel in the slice. This was done for the uncorrected signal (Figure 5a), the signal corrected with only motion and physiologic regression (Figure 5b), and the signal fully corrected with TOAST, motion and physiologic regression (Figure 5c). The global correlations are extreme in the uncorrected signal and are somewhat reduced after performing just motion and physiologic regression, but significant spatial correlations remain. The fully corrected signal, however, provides a much more desirable spatial correlation structure, further indicating that application of all corrections is ideal.
Figure 5.
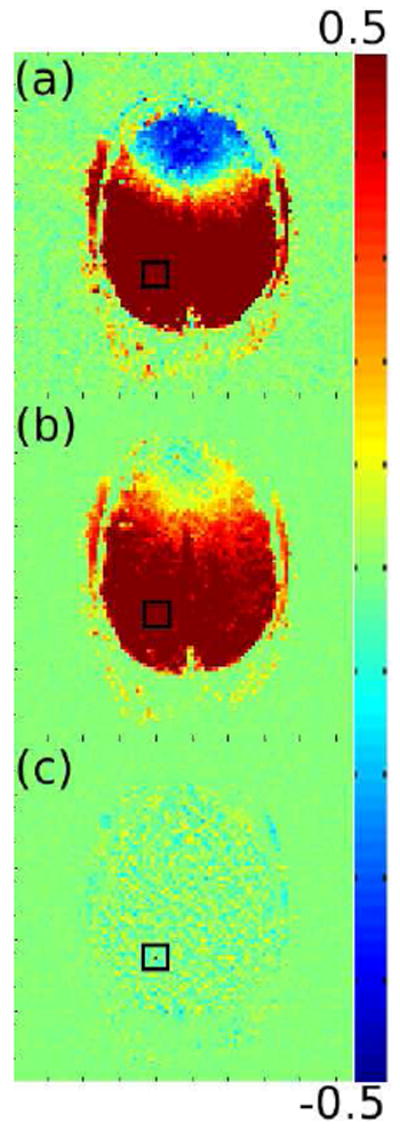
Maps of the correlation coefficients between the phase residuals in a randomly chosen voxel in the brain (at the center of the black square in a-c) and all other voxels in a single slice in the resting state data set with no correction (a), motion and physiologic regression (b), and TOAST, motion and physiologic regression (c). The red voxel in (c) is the randomly chosen voxel.
Activations related to the finger-tapping task in the functional data set are shown for two different slices in Figure 6 following different combinations of applied corrections. Figure 6a shows detected activity in the magnitude and phase in one of the more inferior axial slices and Figure 6b shows the same for a more superior slice. Along the top row of both Figure 6a and 6b, from left to right, are shown results of no correction, motion regression only, TOAST only, and TOAST and motion correction. The bottom row of both Figure 6a and 6b show results following the same corrections as shown in the row above, with the addition of physiologic regression. Analysis similar to this has already been presented by Hahn et al. (2011) for TOAST and motion regression, so this analysis will concern only the effect of physiologic regression on detected activation patters. First, though, it is worth taking notice of the fact that in the uncorrected data, significant activity is detected, where it was shown in Hahn et al. (2011) that activations were nearly completely absent in uncorrected data. The difference here is the zero-order off-resonance correction was made, which acts as a crude dynamic field correction. This removes a lot of phase variance and makes activity apparent (although not shown, uncorrected activation patterns for this data set when the zero-order correction is not applied almost entirely disappear). However, the uncorrected results here still appear to contain significant artifactual activations, showing that the zero-order correction is not sufficient. In terms of the performance and benefit of the physiologic regression, almost no difference in the activation patterns are evident when adding physiologic regression to the correction. This is not terribly surprising given the spectral analysis previously shown. As previously mentioned, it is likely that physiologic regression would have more of an effect when the zero-order off-resonance is not applied.
Figure 6.
Maps of the χ2 (2 degrees-of-freedom) statistics associated with tests of the significance of the finger-tapping stimulus reference function in the magnitude-and-or-phase. Two of the nine slices in the finger-tapping data set are shown, with a more inferior slice in (a) and a more superior slice in (b). Along the top row of both (a) and (b) from left to right are shown results of no correction, motion regression only, TOAST only, and TOAST and motion correction. The bottom row of both (a) and (b) show results following the same corrections as shown in the row above, with the addition of physiologic regression. Active voxels are shown above a threshold of p < 5×10⁻⁴ (unadjusted). Color saturates at a χ2 of 35, corresponding to p < 2.5 × 10⁻⁸.
4. Discussion
Work by Hahn et al. (2011) has previously demonstrated the efficacy of TOAST, a dynamic field correction technique, and the use of motion regression in complex-valued time series with respect to time series characteristics and complex-valued statistical modeling. Here, this methodology was implemented with the addition of physiologic regression using RETROICOR regressors in complex-valued fMRI. Generally, the RETROICOR correction is made independently, prior to detection of activation. In our case, however, we implement the RETROICOR regressors directly into the complex-valued linear model. This is a more appropriate technique as all modeled waveforms, including both those of nuisance and those of functional relevance, are simultaneously fit to the data. Just as the previously mentioned work showed that the best results were obtained by applying both TOAST and motion regression, these results show that adding physiologic regression as well provides even better noise reduction. However, the addition of physiologic regression does seem to add much in and of itself.
The relatively small reduction in phase variance obtained with physiologic regression here seems much smaller than reported in previous work by Petridou et al. (2009). In fact, although the ratio of the phase standard deviation to the inverse magnitude tSNR was reduced to near the theoretical ratio of 1 over all voxels within the brain when applying TOAST with motion and physiologic regression, whether or not physiologic regression is included negligibly changes this ratio. We suspect the major reason for this is the inclusion of the zero-order off-resonance correction applied as part of the reconstruction in this work, which was not applied by Petridou et al. (2009). As previously discussed, this does much of the work of removing phase variance due to respiration in particular, due to its manifestation over large, even global, spatial scales. This is precisely what Petridou et al. (2009) reported and they found that much of the reduction from phase RETROICOR was in respiratory frequencies. Thus, following zero-order off-resonance correction, less phase variation is left for physiologic regression to remove. Additionally, the zero-order correction might change the temporal characteristics of the phase noise such that the fit of the RETROICOR regressors is suboptimal. Finally, the previous work was also performed at 7T, which likely results in higher phase noise in and of itself compared to this work at 3T.
It is also interesting to note that motion regression, especially after TOAST has been applied, performs quite a bit better than physiologic regression. One reason this might be is that spatially global fluctuations in off-resonance produce the effect of bulk motion. The motion estimates pick this up and are thus best suited to remove the phase associated with this apparent motion. If the zero-order correction alters the temporal characteristics of the respiration effects, the motion estimates would pick this up, but the physiologic regressors would fail to do so. It is somewhat puzzling, however, that the combination of physiologic and motion regressors with TOAST performs much better than expected from the performance of motion or physiologic regressors alone without TOAST. This does, however, demonstrate the benefit of regressing motion and physiologic regressors simultaneously. If RETROICOR were to be applied independently first, the combined benefit shown here would likely not be obtained.
Other models of physiologic processes besides RETROICOR, specifically respiration per volume time (RVT) described by Birn et al. (2006), may also be useful to include in noise regression. It is unlikely that including other physiologic regressors would make much difference when applied with TOAST, motion and physiologic RETROICOR corrections as done here, however. These corrections reduce the average power in the phase signal to nearly the level of high frequency power, which is likely representative of the thermal noise floor. If TOAST is not used, it is more likely that additional models of physiologic noise would provide a significant benefit.
Motion correction has been applied here only by including estimates of bulk motion as nuisance regressors in the linear model. Motion is often corrected through registration of each volume in the time series to a reference volume using the motion estimates. This is not done here because registration of complex-valued volumes is not as straightforward as registration of magnitude data alone (Hahn and Rowe, 2010). While the magnitude can be used to estimate the bulk motion (as is done in this work to generate the nuisance motion regressors), the one of the main issues arises from erroneous interpolation effects. It is straightforward to interpolate a point in a scalar-valued volume, but less so in a vector-valued volume. For example, a point interpolated between values with equal magnitudes but different phases will have a lower magnitude than the surrounding points, or in other words the interpolated point will experience a “dephasing”. Interpolating the magnitude alone in the same case yields a point with identical magnitude (as desired). An additional problem arises from inhomogeneity in the phase of the B1 pulse, which does not experience a bulk shift with the head but would be corrected as if it did by typical image registration. There are other issues as well, but these are likely the most serious. A potentially workable solution, presented by Hahn and Rowe (2010), could have been utilized, but was not for two main reasons. First, a complex-valued image registration technique ought to be very well characterized, optimized, and verified, taking all potential sources of error into account. The authors judged this task worthy of significant effort beyond the scope of this work, but once accomplished it is likely that such a technique will provide further reduction in phase noise. As such, it is an important topic for future research. Second, nuisance regression is straightforward, easy to implement and clearly provides some benefit, all while minimizing the risk of the correction actually inducing errors.
It is worthwhile to note that, due to the fact that a relatively short TR of 1 s was used for data acquisition, another potential source of signal variance could arise from disturbances in the steady state free procession (SSFP) caused by the temporal variations in B0 (Zhao et al., 2000). This would most likely be expected to occur in cerebrospinal fluid (CSF), which has a relatively long T2. However, this is unlikely to be a significant source of noise for two reasons: 1) the T2 of CSF is still shorter than 1s (T2 > TR is required to establish SSFP), and 2) a crusher gradient was used and this crusher is most effective in CSF where diffusion is high. If noise from this effect were indeed present, it may or may not be reduced by these corrections. Phase noise of this type should be removed by TOAST, unless it manifests locally over space. In that case, the nuisance regression should reduce it if the B0 fluctuations (with which the SSFP disturbance is correlated) are correlated with bulk motion, heart-beat or respiration, which is likely. Additionally, the nuisance regression should reduce magnitude noise of this type under these conditions. It is not expected that TOAST would decrease this magnitude noise, however.
The data for this analysis was acquired using a single-channel quadrature head coil, but the same techniques can be applied to data acquired using multichannel receiver coil arrays if necessary. This can be accomplished in a manner almost identical to that described by Robinson and Jovicich (2011). One possibility would be to construct single composite phase images (using methods described by Robinson and Jovicich (2011), for example), to which TOAST would be applied in identical fashion to single-channel data. Alternatively, TOAST could be applied to each receiver channel independently, after which a composite image would be constructed. Robinson and Jovicich (2011) report that the latter is more effective for static B0 correction, but this may not apply to TOAST correction as well. Further investigation is required to determine the optimal application of TOAST to multi-channel image data and to evaluate its effectiveness (of which these results might not be representative). In any case, applying these corrections to multi-channel data is not significantly more complicated than their application to single-channel images.
In all, previous literature and these results strongly suggest that TOAST is the crucial component for reducing phase noise in complex-valued fMRI data. However, the TOAST correction alone is suboptimal and further sources of noise, especially those which manifest over small spatial scales, remain and can be reduced significantly with regression of motion and physiologic regression.
5. Conclusion
Through analysis of the phase residual fMRI time series following complex-valued regression, it has been shown that a significant reduction in phase power and spatial correlations of the phase signal can be achieved by applying TOAST, and including regressors for motion and physiologic processes in the linear model used to compute functional activations. Functional activity detected when applying all these corrections appears to have fewer artifactual activations compared to uncorrected results. Regarding complex-valued physiologic regression specifically, we showed that in our case, only slight benefit is obtained by their inclusion in the linear model. This is most likely a result of having applied a zero-order off-resonance correction during reconstruction and if the zero-order correction is not applied, it is expected that physiologic regression would provide relatively higher performance. It was additionally shown that it may be better to include physiologic noise corrections in the linear model rather than applying them independently as is commonly done with RETROICOR. In all, it appears that the full correction presented here may reduce noise related phase variance to a level which may yield feasible complex-valued analysis of fMRI data in the future.
Acknowledgments
This work was supported in part by NIH EB000215 and EB007232.
Footnotes
Publisher's Disclaimer: This is a PDF file of an unedited manuscript that has been accepted for publication. As a service to our customers we are providing this early version of the manuscript. The manuscript will undergo copyediting, typesetting, and review of the resulting proof before it is published in its final citable form. Please note that during the production process errors may be discovered which could affect the content, and all legal disclaimers that apply to the journal pertain.
References
- Bandettini PA, Jesmanowicz A, Wong EC, Hyde JS. Processing strategies for time-course data sets in functional MRI of the human brain. Magn Reson Med. 1993;30(2):161–73. doi: 10.1002/mrm.1910300204. [DOI] [PubMed] [Google Scholar]
- Bandettini PA, Petridou N, Bodurka J. Direct detection of neuronal activity with MRI: fantasy, possibility, or reality? Appl Magn Reson. 2005;29(1):65–88. [Google Scholar]
- Birn RM, Diamond JB, Smith MA, Bandettini PA. Separating respiratory-variation-related fluctuations from neuronal-activity-related fluctuations in fMRI. NeuroImage. 2006;31(4):1536–48. doi: 10.1016/j.neuroimage.2006.02.048. [DOI] [PubMed] [Google Scholar]
- Biswal B, Yetkin FZ, Haughton VM, Hyde JS. Functional connectivity in the motor cortex of resting human brain using echo- planar MRI. Magn Reson Med. 1995;34(4):537–541. doi: 10.1002/mrm.1910340409. [DOI] [PubMed] [Google Scholar]
- Bodurka J, Jesmanowicz A, Hyde JS, Xu H, Estkowski L, Li S-J. Current-induced magnetic resonance phase imaging. J Magn Reson. 1999;137(1):265–71. doi: 10.1006/jmre.1998.1680. [DOI] [PubMed] [Google Scholar]
- Bodurka J, Bandettini PA. Toward direct mapping of neuronal activity: MRI detection of ultraweak, transient magnetic field changes. Magn Reson Med. 2002;47(6):1052–8. doi: 10.1002/mrm.10159. [DOI] [PubMed] [Google Scholar]
- Chen Z, Calhoun VD. Two pitfalls of BOLD fMRI magnitude-based neuroimage analysis: non-negativity and edge effect. J Neurosci Methods. 2011 doi: 10.1016/j.jneumeth.2011.05.018. [DOI] [PMC free article] [PubMed] [Google Scholar]
- Cleveland WS, Devlin SJ. Locally-weighted regression: an approach to regression analysis by local fitting. Journal of the American Statistical Association. 1988;83:596–610. [Google Scholar]
- Cox RW. Software for analysis and visualization of functional magnetic resonance neuroimages. Computers and Biomedical Research. 1996;29:162–73. doi: 10.1006/cbmr.1996.0014. [DOI] [PubMed] [Google Scholar]
- Glover GH, Li TQ, Ress D. Image-based method for retrospective correction of physiological motion effects in fMRI: Retroicor. Magn Reson Med. 2000;44(1):162–7. doi: 10.1002/1522-2594(200007)44:1<162::aid-mrm23>3.0.co;2-e. [DOI] [PubMed] [Google Scholar]
- Hagberg GE, Bianciardi M, Brainovich V, Cassarà AM, Maraviglia B. The effect of physiological noise in phase functional magnetic resonance imaging: from blood oxygen level-dependent effects to direct detection of neuronal currents. Magn Reson Imaging. 2008;26(7):1026–40. doi: 10.1016/j.mri.2008.01.010. [DOI] [PubMed] [Google Scholar]
- Hahn AD, Nencka AS, Rowe DB. Improving robustness and reliability of phase-sensitive fMRI analysis using temporal off-resonance alignment of single-echo timeseries (TOAST) NeuroImage. 2009;44(3):742–52. doi: 10.1016/j.neuroimage.2008.10.001. [DOI] [PMC free article] [PubMed] [Google Scholar]
- Hahn AD, Rowe DB. Methodology for robust motion correction of complex-valued fMRI time series. Proc Int Soc Magn Reson Med. 2010;18:3051. [Google Scholar]
- Hahn AD, Nencka AS, Rowe DB. Enhancing the utility of complex-valued functional magnetic resonance imaging detection of neurobiological processes through postacquisition estimation and correction of dynamic B0 errors and motion. Hum Brain Mapp. 2011 doi: 10.1002/hbm.21217. 32:00. [DOI] [PMC free article] [PubMed] [Google Scholar]
- Heller L, Barrowes B, George J. Modeling direct effects of neural current on MRI. Hum Brain Mapp. 2007;30:1–12. doi: 10.1002/hbm.20484. [DOI] [PMC free article] [PubMed] [Google Scholar]
- Hoogenraad FG, Reichenbach JR, Haacke EM, Lai S, Kuppusamy K, Sprenger M. In vivo measurement of changes in venous blood-oxygenation with high resolution functional mri at 0.95 tesla by measuring changes in susceptibility and velocity. Magn Reson Med. 1998;39(1):97–107. doi: 10.1002/mrm.1910390116. [DOI] [PubMed] [Google Scholar]
- Kadah YM, Hu X. Simulated phase evolution rewinding (sphere): a technique for reducing b0 inhomogeneity effects in mr images. Magn Reson Med. 1997;38(4):615–27. doi: 10.1002/mrm.1910380416. [DOI] [PubMed] [Google Scholar]
- Menon RS. Postacquisition suppression of large-vessel bold signals in high-resolution fMRI. Magn Reson Med. 2002;47(1):1–9. doi: 10.1002/mrm.10041. [DOI] [PubMed] [Google Scholar]
- Nencka AS, Rowe DB. Reducing the unwanted draining vein bold contribution in fMRI with statistical post-processing methods. NeuroImage. 2007;37(1):177–88. doi: 10.1016/j.neuroimage.2007.03.075. [DOI] [PubMed] [Google Scholar]
- Nencka AS, Hahn AD, Rowe DB. The use of three navigator echoes in Cartesian EPI reconstruction reduces Nyquist ghosting. Proc Intl Soc Magn Reson Med. 2008;16:3032. [Google Scholar]
- Ogawa S, Lee TM, Kay AR, Tank DW. Brain magnetic resonance imaging with contrast dependent on blood oxygenation. Proc Natl Acad Sci USA. 1990;87(24):9868–72. doi: 10.1073/pnas.87.24.9868. [DOI] [PMC free article] [PubMed] [Google Scholar]
- Petridou N, Plenz D, Silva AC, Loew M, Bodurka J, Bandettini PA. Direct magnetic resonance detection of neuronal electrical activity. Proc Natl Acad Sci USA. 2006;103(43):16015–20. doi: 10.1073/pnas.0603219103. [DOI] [PMC free article] [PubMed] [Google Scholar]
- Petridou N, Schafer A, Gowland PA, Bowtell R. Phase vs. magnitude information in functional magnetic resonance imaging time series: toward understanding the noise. Magn Reson Imaging. 2009;27(8):1046–57. doi: 10.1016/j.mri.2009.02.006. [DOI] [PubMed] [Google Scholar]
- Reber PJ, Wong EC, Buxton RB, Frank LR. Correction of off resonance-related distortion in echo-planar imaging using EPI-based field maps. Magn Reson Med. 1998;39(2):328–30. doi: 10.1002/mrm.1910390223. [DOI] [PubMed] [Google Scholar]
- Robinson S, Jovicich J. B(0) mapping with multi-channel RF coils at high field. Magn Reson Med. 2011 doi: 10.1002/mrm.22879. [DOI] [PubMed] [Google Scholar]
- Roopchansingh V, Cox RW, Jesmanowicz A, Ward BD, Hyde JS. Single-shot magnetic field mapping embedded in echo-planar time-course imaging. Magn Reson Med. 2003;50:839–843. doi: 10.1002/mrm.10587. [DOI] [PubMed] [Google Scholar]
- Rowe DB. Modeling both the magnitude and phase of complex-valued fMRI data. NeuroImage. 2005b;25(4):1310–24. doi: 10.1016/j.neuroimage.2005.01.034. [DOI] [PubMed] [Google Scholar]
- Rowe DB, Meller CP, Hoffmann RG. Characterizing phase-only fMRI data with an angular regression model. J Neurosci Methods. 2007;161(2):331–41. doi: 10.1016/j.jneumeth.2006.10.024. [DOI] [PMC free article] [PubMed] [Google Scholar]
- Rowe DB, Nencka AS. Complex activation suppresses venous BOLD in GE-EPI fMRI data. Proc Soc Magn Reson Med. 2006;14:2834. [Google Scholar]
- Zhao F, Jin T, Wang P, Hu X, Kim S-G. Sources of phase changes in bold and cbv-weighted fMRI. Magn Reson Med. 2007;57(3):520–7. doi: 10.1002/mrm.21159. [DOI] [PubMed] [Google Scholar]
- Zhao X, Bodurka J, Jesmanowicz A, Li SJ. B(0)-fluctuation-induced temporal variation in EPI image series due to the disturbance of steady-state free precession. Magn Reson Med. 2000;44(5):758–65. doi: 10.1002/1522-2594(200011)44:5<758::aid-mrm14>3.0.co;2-g. [DOI] [PubMed] [Google Scholar]