

Abstract
Recorded electric potentials and magnetic fields due to cortical electrical activity have spatial spread even if their underlying brain sources are focal. Consequently, as a result of source cancellation, loss in signal amplitude and reduction in the effective signal-to-noise ratio can be expected when distributed sources are active simultaneously. Here we investigate the cancellation effects of EEG and MEG through the use of an anatomically correct forward model based on structural MRI acquired from 7 healthy adults. A boundary element model (BEM) with four compartments (brain, cerebrospinal fluid, skull and scalp) and highly accurate cortical meshes (~300,000 vertices) were generated. Distributed source activations were simulated using contiguous patches of active dipoles. To investigate cancellation effects in both EEG and MEG, quantitative indices were defined (source enhancement, cortical orientation disparity) and computed for varying values of the patch radius as well as for automatically parcellated gyri and sulci. Results were calculated for each cortical location, averaged over all subjects using a probabilistic atlas, and quantitatively compared between MEG and EEG. As expected, MEG sensors were found to be maximally sensitive to signals due to sources tangential to the scalp, and minimally sensitive to radial sources. Compared to EEG, however, MEG was found to be much more sensitive to signals generated antero-medially, notably in the anterior cingulate gyrus. Given that sources of activation cancel each other according to the orientation disparity of the cortex, this study provides useful methods and results for quantifying the effect of source orientation disparity upon source cancellation.
Keywords: electroencephalography, magnetoencephalography, cancellation, neuroimaging, modeling
Introduction
Electroencephalography (EEG) and magnetoencephalography (MEG) are neuroimaging modalities that allow one to investigate cortical activity at millisecond resolution, which is not currently available to functional magnetic resonance imaging (fMRI) (Dale, 2001). An important difference between MEG and EEG is the different dependence of their sensitivities upon cortical source orientation. Whereas EEG can detect sources of all orientations (Cuffin, 1990), MEG is primarily sensitive to sources that are oriented tangentially with respect to the scalp (Hamalainen et al., 1993). Previous studies (Haueisen et al., 1995; Melcher and Cohen, 1988) have quantified this preferential sensitivity and found that the relative magnitude of the MEG signal generated by a radial and by a tangential source at the same location can differ by a factor of ~6 for human cortex, whereas EEG, on the other hand, is far less sensitive to source orientation. Lütkenhöner (1998) quantified the separability of two dipoles by systematically varying their relative depths and orientations, and suggested conditions under which sources that are closely positioned may be resolvable. Leahy et al. (1998) investigated how source location and orientation affect localization accuracy in the context of a forward model derived from a human skull phantom constructed with brain, skull and scalp layers to conclude that source orientation is not a significant factor limiting localization accuracy. Another excellent study by Hillebrand and Barnes (Hillebrand, 2002) quantified the dependence of source detection probability by MEG upon source orientation and depth, concluding that the latter is the main factor that compromises the sensitivity of MEG to activity in the adult human cortex.
Although important, these studies did not thoroughly address cancellation effects between sources that are simultaneously active. Im et al. (2003) suggested assessment criteria to compare localization of contiguous patches of activation using spherical head models and cortically distributed sources, but the effect of cancellation between sources was not investigated. Because the spatial patterns of EEG and MEG signals generated by source currents in different parts of the brain can overlap extensively (Halgren, 2008), simultaneous activation of sources can lead to reduced resolution in inverse estimates as a consequence of signal cancellation at the sensors due to superposition of fields. In MEG, cancellation can easily occur when sources of opposite orientation are active at the same time. Because cancellation of both MEG and EEG can be substantial even for a small number of simultaneously active sources, the effective signal-to-noise ratio (SNR) per source is likely to be reduced for simultaneously active sources (Lin, 2001). Consequently, this must be taken into account when evaluating the resolving capabilities of M/EEG localization methods, whereas in techniques such as functional magnetic resonance imaging (fMRI) the signal observed at each voxel does not suffer from source cancellation effects. The basic element for modeling current activation in the brain is the current dipole, which summarizes the effect of microscopic currents within a volume of several cubic millimeters. At spatial scales of 1 cm or above, the gyrification of the cerebral cortex adds a geometric factor which influences both cancellation of sources as well as spatial coherence patterns (Freeman et al., 2003). Quantification of the degree and extent of cancellation is therefore a necessary and important element for the consideration of orientation disparity and stimulus-evoked signal change.
In this paper, we examine the source cancellation profiles of EEG and MEG in the context of an anatomically correct model of the human head using a boundary element model (BEM) with four tissue types (brain, cerebrospinal fluid (CSF), skull and scalp). For each of 7 adult human subjects, the brain was modeled using a mesh of ~300,000 dipoles, and spatially extended cortical activations were represented using contiguous patches of current dipoles. To quantify cancellation effects at each location on the cortical surface, we define indices to describe source enhancement and source orientation disparity at each cortical location. These metrics are investigated for varying radii of the activation patch and provide useful insight into how cancellation effects can affect EEG and MEG recordings.
Materials and Methods
Calculations were performed based on the configuration of 306 MEG and 60 EEG sensors of the Elekta Neuromag® MEG scanner at the University of California, San Diego, which is located in a magnetically shielded room (IMEDCO, Hägendorf, Germany). The superconducting quantum interference device (SQUID) sensors of the Neuromag scanner are arranged as triplets at 102 locations which contain one magnetometer (MAG) and two orthogonally positioned planar gradiometers (GRAD1 and GRAD2). Calculations involved seven healthy human subjects (4 males, 3 females, ages 20–35). EEG sensors were positioned using the standard 10–20 system (Jasper, 1974) and scalp electrode locations on the head of each subject were recorded using a 3D digitizer (Polhemus FastTrack®, Colchester, VT). The spatial position of the head with respect to the MEG scanner was determined using four head position index (HPI) coils. T1-weighted MR volumes were acquired from each subject at 1.5 T using the MP-RAGE sequence (Mugler, 1990).
Segmentation was performed using FreeSurfer (Dale et al., 1999) and the cortical surface had approximately 150,000 vertices per hemisphere, which is accurate enough to capture the anatomy of cortical regions with large curvature. Registration of EEG sensors to each corresponding cortical surface was performed by (1) recording the locations of the nasion, right and left PA using the digitizer and (2) identifying these locations on the subject’s anatomical images to create a rigid registration matrix between EEG and MRI coordinate systems. In addition to the locations of the 60 EEG electrodes and the 4 HPI coils, additional digitized points were included to improve the accuracy of the registration. To avoid bias due to significantly different distances between MEG sensors and scalp, the head was assumed to be optimally positioned in the MEG scanner to simulate an ideal scenario where the distance from each sensor to the scalp is as comparable as possible from sensor to sensor (average distance: 2.89 ± 0.79 cm, mean ± standard deviation).
For EEG, a four-shell, realistically shaped BEM model was used, which consisted of the tessellated surfaces of the inner skull, CSF, outer skull and scalp as generated from MR volume segmentations using the Neuroelectromagnetic Forward Modeling Toolbox (Akalin-Acar, 2004, 2010). For MEG, only one shell was used (as extracted using the NFT) because it is known to have excellent accuracy for forward calculations (Hamalainen et al., 1993; Meijs et al., 1987; Stok et al., 1986). The conductivity ratios 1:6:0.0125:1 were assumed for brain to CSF, CSF to skull, and skull to scalp, respectively. For both EEG and MEG, the linear collocation method (Mosher, 1999) and isolated skull approach (Meijs, 1989) were used to generate the forward matrix A, which is an array of dimensions N × M, where M is the number of sensors and N is the number of sources. For each source j, the column aj of A specifies the projection of source j onto the sensors. Because M/EEG signals are primarily due to electric currents produced by the spatially-aligned apical dendrites of neocortical pyramidal cells (Murakami, 2003, 2002), dipole orientation was assumed to be perpendicular to the cortical surface.
Let aij be the element of the forward matrix associated with sensor i and source j, and δj be the portion of the cortical surface surrounding source j, i.e. the set of points on the surface for which the closest dipole is source j. The effect of cortical source cancellation upon signals recorded at the sensors was quantified by comparing the length of the signal vector generated by n simultaneous sources
| (1) |
to the sum of the signal vector lengths for the same sources when active individually
| (2) |
The enhancement index IE was defined as
| (3) |
Conceptually, IE quantifies at once both source enhancement and source cancellation, as follows. If the signals due to the n simultaneous sources vanishes at the sensor, then IE = 0, which corresponds to lack of enhancement (full source cancellation). If no overlap exists between the signal patterns of individual sources, then IE = 1 (full source enhancement, i.e. no cancellation).
In this context, enhancement is to be understood as referring to the amplification of the signal due to a certain source within the patch by other sources within that patch. The source enhancement index is straightforwardly related to the source cancellation index of Ahlfors et al. (Ahlfors et al., 2010a; Ahlfors et al., 2010b) through the simple relationship
| (4) |
To avoid redundancy, the enhancement index is generally used throughout this paper. In addition to the enhancement index, the orientation disparity index IO was also computed. This measure allows the cancellation profile to be related to the local cortical curvature:
| (5) |
The denominator in the above formula is the total area of the patch, whereas nj is the normal vector with respect to the surface at the location of the vertex indexed by j. If all dipoles within a patch have the same orientation, then IO = 0. If, however, they are oriented in such a way that their sum amounts to 0, then IO = 1. This is the case in a closed surface configuration, where the net dipole moment cancels out. It should be noted that the orientation disparity index is independent of measurement modality (EEG or MEG) and that it depends, rather, upon the local curvature profile of the cortex.
Enhancement and orientation disparity indices were computed for patches of activation centered at each of the ~300,000 vertices of the cortical mesh. Patch radius was computed along the cortical surface using Dijkstra’s algorithm (Dijkstra, 1959) and varied in increments of 1 mm from 0 mm (a single active dipole) to 25 mm. Source strengths were assumed to be equal for all activated dipoles. The calculation of all enhancement and orientation disparity indices for all 7 subjects, cortical locations (~300,000 vertices), patch radius values (0–25 mm), and for both MEG and EEG was approximately 8 hours on a Beowulf cluster with 12 nodes (3.2 GHz clock rate, 4 GB RAM/node). Indices were computed for each subject and cortical averaging across subjects was accomplished using an average folding atlas generated over a large number of subjects as a function of the unit sphere (Dale et al., 1999; Fischl et al., 1999a; Fischl et al., 1999b). Each individual was non-rigidly morphed to the atlas by aligning sulcal-gyral patterns while minimizing shear and areal distortion. Parcellation of gyri and sulci was performed automatically in FreeSurfer using probabilistic labeling on the statistical atlas (Fischl, 2004). In addition, the average value of each index was computed over all vertices and subjects, and then plotted on the cortical surface of the statistical atlas.
The mean and standard deviation of the enhancement index were computed for each cortical parcellation as well as for both EEG and MEG. To investigate whether, for each parcellation, these means differed significantly between EEG and MEG, a two-tailed Welch’s t-test was performed, where the null hypothesis was that the EEG and MEG means were independent random samples from normal distributions with equal means and unknown variances, against the alternative that the means were not equal. Because the variances were not assumed to be equal, this is an example of the Behrens-Fisher problem (Anderson and Bancroft, 1952; Hogg, 2001) and the test statistic under the null hypothesis has an approximate Student’s t distribution with a number of degrees of freedom given by the Welch-Satterthwaite approximation.
To assess the preferential sensitivities of each recording modality to signals generated within various parcellations, the percentage difference in the average enhancement index over each parcellation was computed using the formula
| (6) |
This measure illustrates, on average, the extent to which activity generated within a certain cortical region is preferentially recorded by MEG compared to EEG. The mean standard error of ΔIE over subjects was also computed.
Results
Figure 1 shows the average enhancement profiles of EEG (A) and MEG (B) over subjects for cortical patches with a radius of 1 cm for the left hemisphere (profiles of the right hemisphere are omitted as they are very similar). Because only cortical sources are shown, the medial wall is excluded (shown in white). A thresholded version of Figure 1 is displayed in Figure 2, where values that belong only to either the first or tenth decile (lowest 10% or highest 10%) of the appropriate distribution are shown. In the case of EEG, regions with visibly large enhancement (low cancellation) include the anterior portion of the insula, as well as the banks of the central and postcentral sulci, orbital sulci, parahippocampal gyrus, medial occipito-temporal sulcus and polar plane of the superior temporal gyrus. In the case of MEG, there is a very distinct pattern of activity enhancement for cortical sources located on sulcal banks or cancellation for sources located on gyral crowns. This is because, as expected, MEG sensors are maximally sensitive to signals due to sources tangential to the scalp, and minimally sensitive to radial sources (Hamalainen et al., 1993).
Figure 1.

(A) Cortical maps of the enhancement index IE for patches with a radius of 1 cm, averaged over all subjects and displayed in anatomic atlas space. The first and second rows of images show EEG and MEG enhancement profiles, respectively. In both cases, only the left hemisphere is shown because the results for the right hemisphere are very similar. As shown from left to right within each row of images, the views are: lateral, medial, posterior, anterior, ventral (top) and dorsal (bottom). The cut surfaces of the diencephalon and corpus callosum are excluded (shown in white). The color scale varies from the lowest to the highest value of IE over the cortex. (B) As in (A), for the orientation uniformity index IU = 1 − IO, where IO is the disparity index.
Figure 2.

As in Figure 1, where values that belong only to either the first or tenth decile (lowest 10% or highest 10%) of the appropriate distribution are shown.
A visible difference between MEG and EEG enhancement profiles is that MEG is relatively more sensitive to signals generated antero-medially. As Figures 1 and 2 illustrate, signals due to sources within the pericallosal sulcus, anterior and middle cingulate gyri and sulci, as well as on the medial portion of the superior frontal gyrus are greatly enhanced at the sensors. This is because the medial part of the superior frontal gyrus is particularly wide and flat (Destrieux et al., 2010), which implies that a large proportion of cortical sources within that structure are tangential with respect to the scalp, resulting in maximal signal enhancement for MEG. Both qualitatively and quantitatively, the profiles for gradiometer MEG in Figures 1(A) and 2 (A) were found to be extremely similar to those for magnetometer MEG, as previously quantified by Ahlfors et al (Ahlfors et al., 2010b). For this reason, only results for gradiometer MEG are presented here, and a figure illustrating the enhancement profile of magnetometer MEG is included as supplementary material to demonstrate the resemblance. The enhancement profile visualized in Figures 1(A) and 2 (A) serve as input to all other quantitative analyses in this paper, and consequently the similarity between gradiometer and magnetometer MEG results also applies to all other results as well.
Plots of the cortical uniformity profile (Figures 1(B), 2 (B)) allow one to relate signal enhancement patterns to the local uniformity of the cortical surface. As illustrated by comparing Figure 1 (A) to 1 (B) and Figure 2 (A) to 2 (B), the high uniformity of flat structures such as deep, sulcal banks (e.g. central, postcentral sulci) and of flat gyri (e.g. the medial aspect of the superior frontal gyrus) corresponds to areas of large signal enhancement in both EEG and MEG. If the local curvature of the cortex is low, dipoles are more likely to point in the same direction and the uniformity index is consequently high. Thus, the vector sum of dipoles is large and, as Equations (1) – (4) suggest, the EEG enhancement index is also large. If, furthermore, these dipoles are also tangential with respect to the scalp, they are also highly detectable using MEG, which implies that the MEG enhancement index is high as well.
The enhancement index IE of the cortex measures the extent to which the signal generated by an activation patch is enhanced at the sensors. Simultaneously, it also describes the extent of source cancellation. Figure 3 explores the dependence of this effect upon patch radius R by investigating the probability density function (PDF) of the index computed over all cortical dipoles. For clarity, the PDF is normalized by the largest probability value. At R = 0 mm, the patch consists of one dipole, which implies that α = β in Equation 3 and that cancellation is minimal. As patch size increases from 0 to ~10 mm, the mode of the distribution (brightest in Figure 1(A–B) for any given R) increases as well for both EEG (by 0.053 mm−1) and MEG (by 0.063 mm−1). At R ≈ 10 mm, however, the rate of change decreases (EEG: 0.013 mm−1; MEG: 0.014 mm−1), presumably because the spatial scale of cortical folding becomes comparable to the patch radius at around that value. The similarity between Figures 3 (A) and 3 (C) confirms that sources of cortical activation cancel each other out according to the orientation disparity of the cortex. The similarity between Figures 3(B) and (C) is not as striking, presumably because the dependence of MEG cancellation (Figure 3(B)) upon the disparity profile is additionally confounded by the preferential sensitivity of MEG sensors to source components that are tangential to the scalp. Possibly also due to this preferential sensitivity (and therefore to the greater spread of sensitivity values across some given activation patch), index values have greater spread in MEG than in EEG for most values of R.
Figure 3.
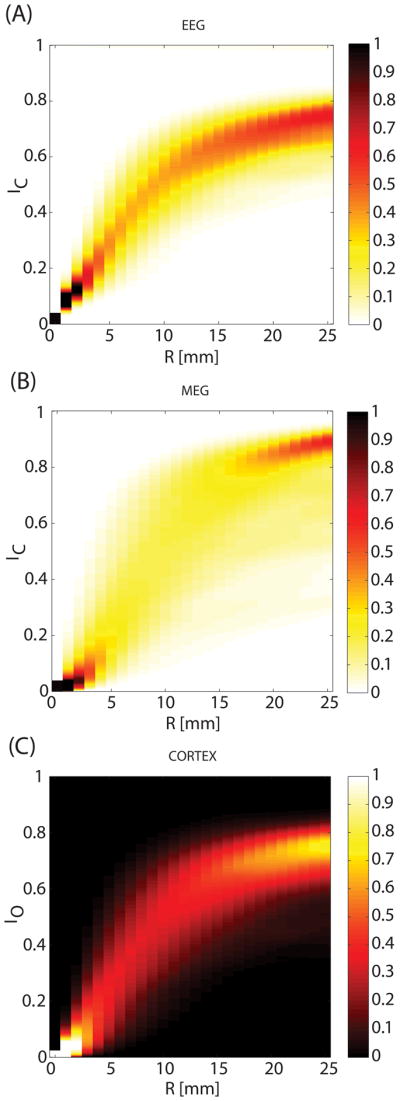
Dependence of the cancellation index IC upon patch radius R. The cancellation index IC measures the extent to which the signal generated by an activation patch is cancelled at the sensors. (A) The Probability Density Function (PDF) of the IC for EEG computed over all cortical dipoles as a function of R, normalized by the largest probability value (i.e. the mode of the distribution; in other words, PDF(IC)/max{PDF(IC)} is depicted). At R = 0 mm, the patch consists of one dipole and cancellation is minimal, implying that IC = 0. As patch radius increases from 0 to about 1 cm, the mode of the cancellation index distribution increases linearly (see text for details). (B) As in (A), for MEG. (C) As in (A), for the source disparity index IO.
Figure 4 displays bar plots of the average enhancement index for each cortical parcellation. This figure is important because it summarizes the results of the study by providing a practical reference for EEG and MEG researchers in their attempt to understand and compare the relative usefulness of using either EEG or MEG recordings for experiments that target specific areas of the brain. Error bars in Figure 4 indicate standard deviations over subjects. Significance of differences between means is indicated by asterisks next to each parcellation, where one, two and three asterisks correspond, respectively, to alpha values of 0.1, 0.01, and 0.001. Largest enhancement is exhibited by the paracentral, pericallosal and suborbital sulci, all of which are structures with dipoles that are tangential with respect to the scalp as well as uniformly oriented. At the other extreme are the frontomarginal gyrus, transverse frontopolar gyri and sulci, and the middle temporal gyrus, all of which have dipoles with radial orientations with respect to the scalp.
Figure 4.


(A) Bar plots of the average enhancement index for each cortical parcellation, ordered in decreasing order from the highest to the lowest enhancement index for MEG. Values for both EEG (yellow) and MEG (red) are shown. Error bars indicate standard deviations over subjects. Standard deviations for MEG are consistently higher than for EEG, presumably due to the larger dependence of enhancement upon source orientation. Significance of differences between means is indicated by asterisks next to each parcellation, where one, two and three asterisks correspond, respectively, to alpha values of 0.1, 0.01, and 0.001. (B) As in (A), continued.
Whereas Figure 4 illustrates the wide range (0.27 to 0.83) of enhancement indices across cortical regions, it does not allow one to appreciate the preferential MEG enhancement of various sources compared to EEG. Results illustrating this latter type of analysis are shown in Figure 5. There, the difference in enhancement index (ΔIE) between MEG and EEG is plotted as a percentage of the MEG enhancement index, using the formula in Equation 6. Error bars in the figure indicate the standard error of the mean (SEM) for ΔIE. In other words, Figure 5 allows the reader to appreciate the preferential sensitivity of EEG over MEG (or vice versa) to specific cortical regions, and the information being provided is thus important due to its ability to indicate which modality is preferable for investigating cortical responses that are localized in specific regions. For any parcellated region, a large positive value in Figure 4 indicates that MEG is, on average, relatively superior to EEG in measuring signals due to patches of cortical activation in that region. Thus, for example, the average MEG enhancement index is over 25% higher than that of EEG for the suborbital, pericallosal and cingulate sulci, as well as for the cingulate gyrus, which is expected given that all these structures have sources tangential to the scalp. By contrast, sources located in many other structures are relatively enhanced in EEG compared to MEG. These include the short insular gyri (enhanced in EEG by 69% compared to MEG), the frontomarginal gyrus (65%), and the transverse frontopolar gyri and sulci (60%). Given that EEG is typically superior to MEG in the ability to measure signals from deep sources (Hamalainen et al., 1993) and that the short insular gyri are located deep within the cortex, these results are sensible. On the other hand, the frontomarginal and frontopolar gyri and sulci are adjacent superficial structures (Destrieux et al., 2010), whose greater enhancement by EEG is due to the mostly radial orientation of their sources with respect to the scalp.
Figure 5.

Difference in enhancement index between MEG and EEG plotted as a percentage of the MEG enhancement index, using Equation 6. Error bars indicate standard errors of the mean. For each parcellation, a positive value indicates that MEG is relatively more sensitive than EEG to signals generated by patches of cortical activation in that region. A negative value indicates that EEG is relatively more sensitive than MEG in this region.
Discussion
Because many patterns of spontaneous or event-related cortical activation are spatially widespread (Halgren, 2004), a realistic quantitative appreciation of source cancellation effects in the human cortex is important. Many top-down neuronal mechanisms of information processing involve the rapid spread of electrical activity across the cortex, which implies that source cancellation can have a significant effect upon noninvasively recorded measures of brain activity. When electrical activity is elicited simultaneously on opposite walls of a sulcus, cortical dipoles of opposite orientations are activated and MEG cancellation of signal is consequently prominent. Similarly, activity due to sources oriented radially with respect to the scalp is largely invisible in MEG as is activity due to sources located deep within the cortex. By contrast, superficial sulcal sources that are tangential to the scalp are expected to exhibit low cancellation, provided that only one bank of the sulcus is active. The effects of these phenomena upon cancellation in MEG are particularly well captured in Figure 2. There, for cortical sources located on sulcal banks, distinct patterns of activity enhancement can be seen, such as for cortical strips located on the central and postcentral sulci. By contrast, patterns of large cancellation (low enhancement) are visible for sources located on gyral crowns (superior and middle temporal gyri, superior frontal gyrus, central and precentral gyri, etc.). These patterns are due to the fact that, as one would expect, MEG sensors are most sensitive to signals due to sources tangential to the scalp, and minimally sensitive to radial sources. It is also for this reason that Figure 2 obviates the relatively higher sensitivity of MEG to signals due to antero-medial dipoles. For such sources (pericallosal sulcus, anterior and middle cingulate gyri and sulci, medial superior frontal gyrus), a large number of dipoles are tangential with respect to the scalp, the consequence of which being signal enhancement in MEG.
The information provided in Figures 4 and 5 is particularly important because these figures reveal the relative enhancement of sources located in each parcellated region of the cortex. For example, Figure 4(A) indicates that, on average, signals originating in the paracentral sulcus, pericallosal sulcus and suborbital sulcus are those which are most enhanced in MEG, and also preferentially enhanced compared EEG. Because these regions have been suggested as landmarks for body representation (paracentral sulcus, (Chainay et al., 2004)), schizophrenia-related working memory dysfunction (pericallosal sulcus, (Szendi et al., 2006)), and abnormal functioning associated with bipolar disorder (suborbital sulcus, (Lopez-Larson et al., 2002)), Figure 4 suggests that researchers investigating these topics should consider the use of MEG due to the low average source cancellation properties of the above regions. By contrast, investigations targeting the frontomarginal gyrus (perception of biological motion, (Santi et al., 2003)), transverse frontopolar gyri and sulci (auditory selective attention, (Pugh et al., 1996)), or middle temporal gyrus (distance contemplation, face recognition and semantic function, see (Muller et al., 1997) and references therein) should consider the large cancellation effects that can occur within these regions. Evaluations similar to these can also be made for all other regions by taking into account the information provided in Figures 4 and 5. In conclusion, these figures can be important to researchers who are interested in appraising the capabilities of either EEG or MEG for their studies of choice.
Cancellation effects are important when M/EEG results are compared or combined with fMRI at mesoscopic or macroscopic scales. At the microscopic scale, cancellation effects cannot be quantified using either M/EEG or fMRI due to the insufficient spatial resolution of these techniques, and electrocorticography (ECoG) must be employed instead to assess source cancellation effects. In the case of ECoG, the local field potential is typically treated as strictly local, although (1) local mixing processes that generate LFPs exist and (2) electrodes can record far field potentials due to strong sources. Although it is typically desirable for ECoG forward models to account for these phenomena (Lachaux et al., 2003), most models have not done so (Zhang et al., 2008), and furthermore many have not accounted for the effects of the scalp, skull, CSF and implanted ECoG strips (Pascualmarqui et al., 1994; Towle et al., 2003). Two other potentially significant effects (Zhang et al., 2008) which are unaccounted for in many ECoG forward modeling studies are (1) current leakage out of the brain (which occurs as a consequence of removing the scalp and skull at ECoG strip locations) and (2) disruption of CSF layer continuity at ECoG electrode recording sites. The ECoG forward model of Zhang et al. (2008) was among the first to include the scalp, skull, CSF, brain and implanted ECoG base pads explicitly by means of a finite element method model. These authors found that forward ECoG models have notable limitations in accounting for the effects of sources located far from strip coverage areas. Aside from the potential importance of the considerations described above, it is typically impractical to apply ECoG strips to many—if not most—brain regions. Consequently, given all of the above as well as the nature of the forward modeling methodology used in this study, investigating cancellation effects via cortical mapping across the full cortex (as done in the present study) may not be the most useful or appealing method for addressing the issue of ECoG forward modeling. Aside from its current inability to address the modified anatomy of intracranial recordings, our BEM model is tailored to the mesoscopic scale, and consequently does not describe in detail cancellation effects at the cellular or cortical column level. At the mesoscopic scale, as explored in the present study, cancellation effects quantified using simulations of activation patches indicate that the local folding geometry of the cortex dictates, to a very large extent, the amount of source cancellation. Finally, at the macroscopic scale, cancellation effects have been found to be very large for both EEG and MEG, to the effect that the cancellation index is very close to unity when a large number of randomly distributed sources are simultaneously active (Ahlfors et al., 2010b).
The results of this study are based on M/EEG forward modeling and are thus independent of any inverse source estimation method. Although the number and relative positioning of sensors with respect to the head does affect the computed values of cancellation indices, this effect is probably small because the relative positioning and orientation of sources with respect to each other remains unchanged. The most important difference in how signals are cancelled differently in EEG and MEG is a consequence of the fact that MEG is preferentially sensitive to source orientation (Cuffin, 1990; Grynszpan and Geselowitz, 1973; Hamalainen et al., 1993). Thus, whereas MEG signals are largely cancelled if they are due to simultaneously active sources positioned on opposite banks of a sulcus, EEG signals may not be cancelled in this scenario. For example, signals due to dipoles that are simultaneously active in the primary visual cortex on opposite banks of the calcarine fissure are likely to cancel out in MEG. In the case of magnetic recordings, interplay exists between (1) the cancellation of signals generated by sources that are simultaneously active on opposite banks of a sulcus and (2) the rapid decrease in MEG signal amplitude as sensor-to-source separation increases. In the case of lateral and dorsal cortex, MEG records primarily from superficial regions whose sulcal sources cancel out when simultaneously active, whereas active radial sources on gyral crowns are silent in this modality. Collectively, these effects lead to an MEG cancellation profile that is different from that of EEG for lateral and dorsal brain regions. For dipoles that are lateral, dorsal, anterior or posterior, sulcal sources are typically tangential with respect to the scalp (enhanced in MEG), but gyral sources are mostly radial (un-recordable using MEG). The opposite is true for sources located medially or ventrally, where gyral sources are enhanced by MEG and sulcal sources are silenced. Collectively, these results confirm the existing view that combining MEG with EEG may provide better and more detailed information about underlying sources than using only one of these measurement modalities (de Jongh et al., 2005; Goldenholz et al., 2009; Hillebrand, 2002), as confirmed both by experimental (Sharon et al., 2007) and theoretical (Molins et al., 2008) results.
Differences in sensitivity between MEG and EEG have been explored by Ahlfors et al (2010a) using a methodological approach which is comparable to ours. These authors mapped the dependency of MEG and EEG signal magnitude on the orientation of a current dipole in a dense grid of source locations in the human cortex using an anatomically realistic BEM model with three compartments (brain, skull and scalp). Four important differences between their study and ours are that (1) the CSF layer was omitted, (2) cortical mesh resolution was significantly lower (~5,000 vertices vs. ~300,000 vertices in our case), (3) the present study investigates cancellation effects systematically, i.e. for all cortical locations as well as for patch radii ranging from 0 to 25 mm, and (4) our study includes 7 subjects and takes into account inter-subject variability in cancellation patterns via averaging to a statistical atlas. The effect of CSF upon lead fields is likely to be small in the case of MEG because the conductivity profile of the head has negligible effect upon the MEG forward matrix (Hamalainen et al., 1993). Consequently, the effect of CSF upon cancellation patterns is also likely to be quite limited for MEG. In the case of EEG, however, the presence of CSF (with its high conductivity compared to that of other layers) results in broader lead fields, and thus is required for the realistic calculation of source enhancement profiles. A CSF-exclusive model underestimates the fraction of the cortex from which an EEG sensor can record, and therefore also the number of sources which cancel each other. Consequently, the probable effect of CSF exclusion is an underestimation of cancellation effects, but the extent to which this is the case warrants further investigation.
Based on a singular value decomposition (SVD) of the MEG forward matrix, Ahlfors et al. computed a metric to describe the sensitivity of MEG to source orientation, using an approach analogous to that of several other studies (Haueisen et al., 1995) which compared the ‘suppression ratio’ of radial to tangential dipoles in MEG. As we did, Ahlfors et al. found that MEG was relatively insensitive to superficial gyral sources located on the lateral surface of temporal, parietal and occipital cortices, and sensitive to orbitofrontal regions, to sulci on lateral frontal regions, and to sources located medially. Although inverse modeling is beyond the scope of this paper, it is appropriate to note the thorough study of Hillebrand and Barnes (2002), who quantified the detectability of sources in MEG as well as source dependence upon orientation and depth. The authors found that thin strips (~2 mm wide) of poor MEG resolvability exist on gyral crests, although these strips account for a relatively small proportion of the cortical area. Additionally, the strips were found adjacent to cortical areas with nominal tangential component yet high resolvability due to their proximity to the sensor array. Because only one cortical dipole was assumed to be active in their study, interactions between sources resulting in cancellation or enhancement were not taken into account. However, an important focus of the study by Hillebrand and Barnes was the quantification of source depth as the main factor affecting source resolvability. In this respect, these authors computed the confidence volumes of source localization, which were found to increase with source depth. From the standpoint of the present study, it should be noted that the effect of cancellation between deep sources in MEG can be a decrease in the effective SNR of the signal due to such sources, although source orientation is a decisive factor regarding the extent to which this is the case.
The intimate relationship between source cancellation and SNR is partially revealed by comparison of the present results to those of Hillebrand and Barnes (2002) and to those of Goldenholz et al. (2009). The former investigated the expected SNR’s of the two techniques, while the latter studied the SNR profiles of EEG and MEG using patch modeling as well as methodologies similar to those applied here. Goldenholz et al. found that the SNR of deep sources is typically larger in EEG than in MEG, and that the opposite is the case for superficial sources. For MEG, comparably low SNR was found for gyral crowns, sulcal troughs on lateral surfaces, interhemispheric cortex and parts of ventral cortex that were associated with source orientation that was normal with respect to the scalp. Medial surfaces and gyral crowns were found to exhibit higher SNR in EEG, while most lateral areas had higher SNR in MEG. Thus, the results of Goldenholz et al. (on SNR) can be combined with ours (on source enhancement) and with those of Hillebrand and Barnes to produce a more informative picture of the recording abilities of MEG and EEG. Interestingly, the results of Goldenholz et al. indicate that the total area with higher SNR in MEG compared to EEG decreases as patch area increases. In contrast, our findings show that the difference in average cancellation between MEG and EEG increases with patch radius (Figure 2), which suggests that an increase in activation patch size is associated with both higher SNR as well as higher enhancement in MEG compared to EEG. Confirmation of this intriguing hypothesis by future work may emphasize the preferential usefulness of MEG over EEG for the study of activations that involve large areas of the cortex. Consequently, further study of the interplay between SNR and source enhancement profiles could provide important insight into the recording abilities of MEG and EEG, as well as into their suitability for various studies of brain function.
The findings of this paper are also relevant in the context of improving existing inverse localization algorithms. For example, an inverse method using combined M/EEG recordings could include SNR information by weighing each sensor on the basis of its SNR and cancellation profiles. Such a method could, in principle, improve localization accuracy by relying more heavily on sensors that are more sensitive to sources with high SNR and low cancellation. Moreover, combined knowledge of SNR and cancellation profiles may allow localization methods to include statistically rigorous bias in the inverse solution based on the SNR and source cancellation properties of each cortical location. Such methods would thus be able to measure the reliability of localization results based not only on traditional measures of error, but also on the information contained in the cancellation profile of the cortex. Moreover, because SNR and cancellation are both critically affected by the locations of MEG sensors relative to the head (Marinkovic et al., 2004), this study argues in favor of targeting the cortical areas that of interest in a particular experiment by appropriately positioning of the head under the Dewar vessel so as to (1) minimize the cancellation of the cortical sources being studied and (2) maximize their SNR. Moreover, our results provide the M/EEG investigator with detailed information on the preferential enhancement of various cortical regions by either MEG or EEG, which allows one to make a more informed decision regarding the optimal recording modality to be employed for the measurement of brain activity in a given experiment.
In this study, the cancellation profile of MEG was investigated in the context of the Elekta Neuromag® MEG scanner, which has 204 planar gradiometers and 102 magnetometers. As already mentioned in the Results section and illustrated in the Supplementary Figure, the cancellation profile of planar gradiometers was found to be extremely similar, both qualitatively and quantitatively, to that of the magnetometer array, at least from the standpoint of the MEG hardware configuration used throughout our study. For this reason, as already explained, our analysis in the Results and Discussion sections did not treat these sensor types separately. Nevertheless, it is useful to acknowledge one limitation of our study which is related to hardware configuration, namely that our investigation does not discuss the cancellation profile of MEG as pertaining to other hardware systems that are in current use. In the case of MEG arrays which (1) are equipped with either planar gradiometers or magnetometers and which (2) have a different number of such sensors or other spatial configurations, it is reasonable to expect that their cancellation profiles would be comparable to ours provided that the orientations of their sensors with respect to the scalp are similar to those of the Elekta Neuromag® system. It is possible, however, that the hardware configuration of the MEG device that is of interest to a particular investigator might include some other type of sensors, of which a wide variety exist: vector magnetometers, axial gradiometers, second-order or even third-order gradiometers, etc. (Seki and Kandori, 2007; Uzunbajakau et al., 2005). The latter two categories of sensors can include a wide variety of coil arrangements, and consequently many types of MEG systems are used in neuroimaging (Clarke and Braginski, 2004). The task of modeling the cancellation profiles of many of these systems often requires detailed familiarity with their hardware design specifications, including not only relative sensor positioning but also physical coil parameters (baseline, diameter, etc.), which can vary greatly across systems. Additionally, quite often, such hardware specifications are not made public by their manufacturers. For all these reasons, the modeling of cancellation profiles for these types of sensors and systems was not attempted, although our framework can be applied to modeling studies involving any sensor configuration. In conclusion, it is fair to acknowledge that the relevance of our study is limited to some extent by the fact that only two types of MEG sensors are modeled in our study, namely planar gradiometers and magnetometers. Nevertheless, because these two types of sensors are possibly among those that are most commonly used in the MEG community, it remains the case that the results of our study are relevant to a significant proportion of neuroimaging researchers who use MEG.
Conclusions
In conclusion, as expected, a substantial amount of source cancellation can occur in both EEG and MEG. This effect can be important when M/EEG data are related to hemodynamic measures of cortical activity, as well as when observed differences between MEG and EEG in terms of focal vs. widespread activity need to be reconciled. By means of computing quantitative indices everywhere on the cortical surface, we have confirmed that the cancellation of extended sources of activation is largely dependent upon the orientation disparity of the cortex, as summarized in previous studies (Ahlfors et al., 2010a; Ahlfors et al., 2010b). These results are independent of any source localization methods and can be significant when explaining quantitative and qualitative differences in experimental M/EEG data. Consequently, this study provides useful methods and results for quantifying the effects of source orientation disparity upon source cancellation.
Supplementary Material
Supplementary Figure 1. As in Figure 1(A), for the enhancement profiles of MEG magnetometers and gradiometers.
Highlights.
MEG signals generated antero-medially (notably in the anterior cingulate gyrus) are subjected to less source cancellation than in EEG
comparison of EEG and MEG cancellation profiles indicate preferential sensitivity of each technique to distinct sets of cortical regions
this study provides methods for quantifying source orientation effects upon source cancellation
Acknowledgments
Funding was provided by the National Institutes of Health (grants R01-EB 09282 and R01-NS 18741 to E.H.), and by the National Alliance for Medical Image Computing, under NIH Roadmap Initiative grant 2U54EB005149 (sub-award to J.D.V.H.). We gratefully acknowledge Timothy T. Brown, Anders M. Dale, Ksenija Marinkovic and Carrie R. McDonald for their guidance and insightful comments, as well as Nima Dehghani, Donald J. Hagler, Matthew K. Leonard, and Jason S. Sherfey for their technical assistance.
Abbreviations
- BEM
boundary element model
- CSF
cerebrospinal fluid
- ECoG
electrocorticography
- EEG
electroencephalography
- fMRI
functional MRI
- GRAD
gradiometer
- HPI
head position index
- MAG
magnetometer
- MP-RAGE
magnetization-prepared 180 degrees radio-frequency pulses and rapid gradient-echo
- MEG
magnetoencephalography
- MRI
magnetic resonance imaging
- NFT
Neuroelectromagnetic Forward Modeling Toolbox
probability density function
- SEM
standard error of the mean
- SNR
signal-to-noise ratio
- SQUID
superconducting quantum interference device
- SVD
singular value decomposition
Footnotes
Disclosure statement
None of the authors has a conflict of interest to disclose.
Publisher's Disclaimer: This is a PDF file of an unedited manuscript that has been accepted for publication. As a service to our customers we are providing this early version of the manuscript. The manuscript will undergo copyediting, typesetting, and review of the resulting proof before it is published in its final citable form. Please note that during the production process errors may be discovered which could affect the content, and all legal disclaimers that apply to the journal pertain.
References
- Ahlfors SP, Han J, Belliveau JW, Hamalainen MS. Sensitivity of MEG and EEG to source orientation. Brain Topogr. 2010a;23:227–232. doi: 10.1007/s10548-010-0154-x. [DOI] [PMC free article] [PubMed] [Google Scholar]
- Ahlfors SP, Han J, Lin FH, Witzel T, Belliveau JW, Hamalainen MS, Halgren E. Cancellation of EEG and MEG signals generated by extended and distributed sources. Hum Brain Mapp. 2010b;31:140–149. doi: 10.1002/hbm.20851. [DOI] [PMC free article] [PubMed] [Google Scholar]
- Akalin-Acar Z, Gencer NG. An advanced boundary element method (BEM) implementation for the forward problem of electromagnetic source imaging. Physics in Medicine and Biology. 2004;49:5011–5028. doi: 10.1088/0031-9155/49/21/012. [DOI] [PubMed] [Google Scholar]
- Akalin-Acar Z, Makeig S. Neuroelectromagnetic forward head modeling toolbox. Journal of Neuroscience Methods. 2010;190:258–270. doi: 10.1016/j.jneumeth.2010.04.031. [DOI] [PMC free article] [PubMed] [Google Scholar]
- Anderson RL, Bancroft TA. Statistical theory in research. McGraw-Hill; York, PA: 1952. [Google Scholar]
- Chainay H, Krainik A, Tanguy ML, Gerardin E, Le Bihan D, Lehericy S. Foot, face and hand representation in the human supplementary motor area. Neuroreport. 2004;15:765–769. doi: 10.1097/00001756-200404090-00005. [DOI] [PubMed] [Google Scholar]
- Clarke J, Braginski AI. The SQUID Handbook: Fundamentals and technology of SQUIDS and SQUID systems. Wiley-VCH; 2004. [Google Scholar]
- Cuffin BN. Effects of head shape on EEG’s and MEG’s. IEEE Transactions on Biomedical Engineering. 1990;37:44–52. doi: 10.1109/10.43614. [DOI] [PubMed] [Google Scholar]
- Dale AM, Fischl B, Sereno MI. Cortical surface-based analysis - I. Segmentation and surface reconstruction. NeuroImage. 1999;9:179–194. doi: 10.1006/nimg.1998.0395. [DOI] [PubMed] [Google Scholar]
- Dale AM, Halgren E. Spatiotemporal mapping of brain activity by integration of multiple imaging modalities. Current Opinion in Neurobiology. 2001;11:202–208. doi: 10.1016/s0959-4388(00)00197-5. [DOI] [PubMed] [Google Scholar]
- de Jongh A, de Munck JC, Goncalves SI, Ossenblok P. Differences in MEG/EEG epileptic spike yields explained by regional differences in signal-to-noise ratios. Journal of Clinical Neurophysiology. 2005;22:153–158. doi: 10.1097/01.wnp.0000158947.68733.51. [DOI] [PubMed] [Google Scholar]
- Destrieux C, Fischl B, Dale A, Halgren E. Automatic parcellation of human cortical gyri and sulci using standard anatomical nomenclature. NeuroImage. 2010;53:1–15. doi: 10.1016/j.neuroimage.2010.06.010. [DOI] [PMC free article] [PubMed] [Google Scholar]
- Dijkstra E. A note on two problems in connexion with graphs. Numerische Mathematik. 1959;1:269–271. [Google Scholar]
- Fischl B, et al. Automatically parcellating the human cerebral cortex. Cerebral Cortex. 2004;14:11–22. doi: 10.1093/cercor/bhg087. [DOI] [PubMed] [Google Scholar]
- Fischl B, Sereno MI, Dale AM. Cortical surface-based analysis - II: Inflation, flattening, and a surface-based coordinate system. NeuroImage. 1999a;9:195–207. doi: 10.1006/nimg.1998.0396. [DOI] [PubMed] [Google Scholar]
- Fischl B, Sereno MI, Tootell RBH, Dale AM. High-resolution intersubject averaging and a coordinate system for the cortical surface. Human Brain Mapping. 1999b;8:272–284. doi: 10.1002/(SICI)1097-0193(1999)8:4<272::AID-HBM10>3.0.CO;2-4. [DOI] [PMC free article] [PubMed] [Google Scholar]
- Freeman WJ, Holmes MD, Burke BC, Vanhatalo S. Spatial spectra of scalp EEG and EMG from awake humans. Clinical Neurophysiology. 2003;114:1053–1068. doi: 10.1016/s1388-2457(03)00045-2. [DOI] [PubMed] [Google Scholar]
- Goldenholz DM, Ahlfors SP, Hamalainen MS, Sharon D, Ishitobi M, Vaina LM, Stufflebeam SM. Mapping the Signal-To-Noise-Ratios of Cortical Sources in Magnetoencephalography and Electroencephalography. Human Brain Mapping. 2009;30:1077–1086. doi: 10.1002/hbm.20571. [DOI] [PMC free article] [PubMed] [Google Scholar]
- Grynszpan F, Geselowitz DB. Model Studies of Magnetocardiogram. Biophysical Journal. 1973;13:911–925. doi: 10.1016/S0006-3495(73)86034-5. [DOI] [PMC free article] [PubMed] [Google Scholar]
- Halgren E. How can intracranial recordings assist MEG source localization? Neurol Clin Neurophysiol. 2004;2004:86. [PubMed] [Google Scholar]
- Halgren E. Considerations in source estimation of the P3. In: Ikeda A, Inoue Y, editors. Event-related potentials in patients with epilepsy: from current state to future prospects. John Libbey Eurotext; Eshery, Surrey, UK: 2008. pp. 71–88. [Google Scholar]
- Hamalainen M, Hari R, Ilmoniemi RJ, Knuutila J, Lounasmaa OV. Magnetoencephalography - Theory, Instrumentation, and Applications to Noninvasive Studies of the Working Human Brain. Reviews of Modern Physics. 1993;65:413–497. [Google Scholar]
- Haueisen J, Ramon C, Czapski P, Eiselt M. On the Influence of Volume Currents and Extended Sources on Neuromagnetic Fields - a Simulation Study. Annals of Biomedical Engineering. 1995;23:728–739. doi: 10.1007/BF02584472. [DOI] [PubMed] [Google Scholar]
- Hillebrand A, Barnes GR. A quantitative assessment of the sensitivity of whole-head MEG to activity in the adult human cortex. NeuroImage. 2002;16:638–650. doi: 10.1006/nimg.2002.1102. [DOI] [PubMed] [Google Scholar]
- Hogg R, Tanis EA. Probability and statistical inference. Prentice Hall; Upper Saddle River, NJ: 2001. [Google Scholar]
- Im CH, An KO, Jung HK, Kwon H, Lee YH. Assessment criteria for MEG/EEG cortical patch tests. Physics in Medicine and Biology. 2003;48:2561–2573. doi: 10.1088/0031-9155/48/15/320. [DOI] [PubMed] [Google Scholar]
- Jasper HH. Handbook of Electroencephalography and Clinical Neurophysiology. Elsevier; Amsterdam: 1974. The 10–20 electrode system of the International Federation. [PubMed] [Google Scholar]
- Lachaux JP, Rudrauf D, Kahane P. Intracranial EEG and human brain mapping. Journal of Physiology-Paris. 2003;97:613–628. doi: 10.1016/j.jphysparis.2004.01.018. [DOI] [PubMed] [Google Scholar]
- Leahy RM, Mosher JC, Spencer ME, Huang MX, Lewine JD. A study of dipole localization accuracy for MEG and EEC using a human skull phantom. Electroencephalography and Clinical Neurophysiology. 1998;107:159–173. doi: 10.1016/s0013-4694(98)00057-1. [DOI] [PubMed] [Google Scholar]
- Lin FH, Ahlfors SP, Witzel T, Dale AM, Fischl BR, Liu AK, Belliveau JW, Halgren E. Cancellation of MEG and EEG signals with distributed source activation on realistic cortical surface. NeuroImage. 2001;13:S186. [Google Scholar]
- Lopez-Larson MP, DelBello MP, Zimmerman ME, Schwiers ML, Strakowski SM. Regional prefrontal gray and white matter abnormalities in bipolar disorder. Biological Psychiatry. 2002;52:93–100. doi: 10.1016/s0006-3223(02)01350-1. [DOI] [PubMed] [Google Scholar]
- Lutkenhoner B. Dipole separability in a neuromagnetic source analysis. IEEE Transactions on Biomedical Engineering. 1998;45:572–581. doi: 10.1109/10.668747. [DOI] [PubMed] [Google Scholar]
- Marinkovic K, Cox B, Reid K, Halgren E. Head position in the MEG helmet affects the sensitivity to anterior sources. Neurol Clin Neurophysiol. 2004;2004:30. [PMC free article] [PubMed] [Google Scholar]
- Meijs J, Weier O, Peters MJ, van Oosterom A. On the numerical accuracy of the boundary element method. IEEE Transactions on Biomedical Engineering. 1989;36:1038–1049. doi: 10.1109/10.40805. [DOI] [PubMed] [Google Scholar]
- Meijs JWH, Bosch FGC, Peters MJ, Dasilva FHL. On the Magnetic-Field Distribution Generated by a Dipolar Current Source Situated in a Realistically Shaped Compartment Model of the Head. Electroencephalography and Clinical Neurophysiology. 1987;66:286–298. doi: 10.1016/0013-4694(87)90078-2. [DOI] [PubMed] [Google Scholar]
- Melcher JR, Cohen D. Dependence of the Meg on Dipole Orientation in the Rabbit Head. Electroencephalography and Clinical Neurophysiology. 1988;70:460–472. doi: 10.1016/0013-4694(88)90024-7. [DOI] [PubMed] [Google Scholar]
- Molins A, Stufflebeam SM, Brown EN, Hamalainen MS. Quantification of the benefit from integrating MEG and EEG data in minimum l(2)-norm estimation. NeuroImage. 2008;42:1069–1077. doi: 10.1016/j.neuroimage.2008.05.064. [DOI] [PubMed] [Google Scholar]
- Mosher JC, Leahy RM, Lewis PS. EEG and MEG: forward solutions for inverse problems. IEEE Transactions on Biomedical Engineering. 1999;46:1069–1077. doi: 10.1109/10.748978. [DOI] [PubMed] [Google Scholar]
- Mugler JP, Brookeman JR. Three-dimensional magnetization-prepared rapid gradient-echo imaging (3D MP RAGE) Magnetic Resonance in Medicine. 1990;15:152–157. doi: 10.1002/mrm.1910150117. [DOI] [PubMed] [Google Scholar]
- Muller RA, Rothermel RD, Behen ME, Muzik O, Mangner TJ, Chugani HT. Receptive and expressive language activations for sentences: a PET study. Neuroreport. 1997;8:3767–3770. doi: 10.1097/00001756-199712010-00022. [DOI] [PubMed] [Google Scholar]
- Murakami S, Hirose A, Okada YC. Contribution of ionic currents to magnetoencephalography (MEG) and electroencephalography (EEG) signals generated by guinea-pig CA3 slices. Journal of Physiology. 2003;553:975–985. doi: 10.1113/jphysiol.2003.051144. [DOI] [PMC free article] [PubMed] [Google Scholar]
- Murakami S, Zhang T, Hirose A, Okada YC. Physiological origins of evoked magnetic fields and extra-cellular field potentials produced by guinea-pig CA3 hippocampal slices. Journal of Physiology. 2002;544:237–251. doi: 10.1113/jphysiol.2002.027094. [DOI] [PMC free article] [PubMed] [Google Scholar]
- Pascualmarqui RD, Michel CM, Lehmann D. Low-Resolution Electromagnetic Tomography - a New Method for Localizing Electrical-Activity in the Brain. International Journal of Psychophysiology. 1994;18:49–65. doi: 10.1016/0167-8760(84)90014-x. [DOI] [PubMed] [Google Scholar]
- Pugh KR, Shaywitz BA, Fulbright RK, Byrd D, Skudlarski P, Katz L, Constable RT, Fletcher J, Lacadie C, Marchione K, Gore JC. Auditory selective attention: An fMRI investigation. NeuroImage. 1996;4:159–173. doi: 10.1006/nimg.1996.0067. [DOI] [PubMed] [Google Scholar]
- Santi A, Servos P, Vatikiotis-Bateson E, Kuratate T, Munhall K. Perceiving biological motion: Dissociating visible speech from walking. Journal of Cognitive Neuroscience. 2003;15:800–809. doi: 10.1162/089892903322370726. [DOI] [PubMed] [Google Scholar]
- Seki Y, Kandori A. Two-dimensional gradiometer. Japanese Journal of Applied Physics. 2007;46:3397–3401. [Google Scholar]
- Sharon D, Hamalainen MS, Tootell RBH, Halgren E, Belliveau JW. The advantage of combining MEG and EEG: Comparison to fMRI in focally stimulated visual cortex. NeuroImage. 2007;36:1225–1235. doi: 10.1016/j.neuroimage.2007.03.066. [DOI] [PMC free article] [PubMed] [Google Scholar]
- Stok CJ, Meijs JWH, Peters MJ, Rutten WLC. Model Evaluation Using Electroencephalography and Magnetoencephalography. Acta Oto-Laryngologica. 1986;102:5–10. doi: 10.3109/00016488609108878. [DOI] [PubMed] [Google Scholar]
- Szendi I, Kiss M, Racsmany M, Boda K, Cimmer C, Voros E, Kovacs ZA, Szekeres G, Galsi G, Pleh C, Csernay L, Janka Z. Correlations between clinical symptoms, working memory functions and structural brain abnormalities in men with schizophrenia. Psychiatry Research-Neuroimaging. 2006;147:47–55. doi: 10.1016/j.pscychresns.2005.05.014. [DOI] [PubMed] [Google Scholar]
- Towle VL, Khorasani L, Uftring S, Pelizzari C, Erickson RK, Spire JP, Hoffmann K, Chu D, Scherg M. Noninvasive identification of human central sulcus: a comparison of gyral morphology, functional MRI, dipole localization, and direct cortical mapping. NeuroImage. 2003;19:684–697. doi: 10.1016/s1053-8119(03)00147-2. [DOI] [PubMed] [Google Scholar]
- Uzunbajakau SA, Rijpma AP, ter Brake HJM, Peters MJ. Optimization of a third-order gradiometer for operation in unshielded environments. Ieee Transactions on Applied Superconductivity. 2005;15:3879–3885. [Google Scholar]
- Zhang YC, van Drongelen W, Kohrman M, He B. Three-dimensional brain current source reconstruction from intra-cranial ECoG recordings. NeuroImage. 2008;42:683–695. doi: 10.1016/j.neuroimage.2008.04.263. [DOI] [PMC free article] [PubMed] [Google Scholar]
Associated Data
This section collects any data citations, data availability statements, or supplementary materials included in this article.
Supplementary Materials
Supplementary Figure 1. As in Figure 1(A), for the enhancement profiles of MEG magnetometers and gradiometers.