

Abstract
Background and Purpose
Current approaches to diffusion tensor imaging (DTI) analysis do not permit identification of individual-level changes in DTI indices. We investigated the ability of wild bootstrapping analysis to detect subject-specific changes in brain white matter (WM) before and after sports-related concussion.
Materials and Methods
A prospective cohort study was performed in 9 high school athletes engaged in hockey or football, and 6 controls. Subjects underwent DTI pre- and post-season within a 3-month interval. One athlete was diagnosed with concussion (scanned within 72 hours) and 8 suffered between 26 and 399 sub-concussive head blows. Fractional anisotropy (FA) and mean diffusivity (MD) were measured in each white matter voxel. Bootstrap samples were generated and a permuted t test used to compare voxel-wise FA/MD changes in each subject pre- vs. post-season.
Results
The percentage of WM voxels with significant (p<0.05) pre-post FA changes was highest for the concussion subject (3.2%), intermediary for those with sub-concussive head blows (mean 1.05±.15%) and lowest for controls (mean 0.28±.01%). Similarly, the percentage of WM voxels with significant MD changes was highest for the concussion subject (3.44%), intermediary for those with sub-concussive head blows (mean 1.48±.17%) and lowest for controls (mean 0.48±.05%). Significantly changed FA and MD voxels co-localized in the concussion subject to the right corona radiata and right inferior longitudinal fasciculus.
Conclusions
Wild bootstrap analysis detected significantly changed WM in a single concussed athlete. Athletes with multiple sub-concussive head blows had significant changes in a percentage of their WM that was over 3 times higher than controls. Efforts to understand the significance of these WM changes, and their relationship to head impact forces appear warranted.
Introduction
Mild traumatic brain injury (mild TBI, also known as concussion) affects over 1.7 million Americans annually.[1] Approximately 300,000 concussions per year are due to sports or recreational activities.[2] A single concussion can result in a variety of adverse sequelae such as post-concussive symptoms and cognitive dysfunction.[3] Multiple concussions have been linked to chronic traumatic encephalopathy.[4] Although axonal injury is thought to be the anatomical abnormality that underlies these problems [5], there is currently no way to detect this in vivo and thus no way to treat it.
Diffusion tensor imaging (DTI) can potentially be used to diagnose axonal injury acutely. After mild TBI, FA decreases [6, 7], although several studies have documented areas of increased fractional anisotropy (FA) during the acute and sub acute post-injury periods. [8, 9] While differing time intervals after injury and DTI methods have been cited to explain this discrepancy, the variation in injury forces and mechanisms are also likely causes. The result is marked heterogeneity in the distribution of axonal injury from subject to subject.
Inter-individual variation can be minimized by comparing the post-injury scan to the same person pre-injury, rather than to an unrelated control. Although this is not possible in most injury situations such as car accidents, athletes participating in contact sports with a high risk of concussion are uniquely suited to this purpose. However, direct comparison of a pre-injury scan to a post-injury scan in a single individual in order to identify subject-specific changes would still not be possible using the current approaches to DTI analysis.
The three most commonly-used analytical approaches, region of interest (ROI)-based analysis, tract-based spatial statistics, and the whole-brain voxel-based [10] analysis, use traditional statistics to compare average DTI values (in a ROI or in a voxel location) in the TBI group to that in control group. While they can robustly detect injuries in regions that are commonly vulnerable to concussions for most subjects, these group comparison-based approaches are not sensitive to injuries that only happen to one individual or a few individuals and therefore, are unable to detect subject-dependent injury patterns after mild TBI.
None of these techniques permits a meaningful comparison of a single voxel value in one DTI scan (e.g., in a subject post-injury) to that in another scan (e.g., in the same subject pre-injury or in an unrelated control). In other words, a standard statistical approach—which requires a comparison of two distributions of values—does not allow one to determine if a single index value in one voxel is statistically different from the value in the same voxel at a different point in time.
Wild bootstrapping (WB) is a novel statistical approach that has the potential to overcome this problem.[11, 12] Bootstrapping estimates the uncertainty of a given statistic (such as the FA value in a particular voxel) by generating a large number of samples from a small number of repeated measurements of the original data with replacements.[13] The precision level in the data can then be accurately estimated and the true distribution of the population approximated. However, conventional bootstrapping requires at least 5 measurements to achieve reliable approximation of the true distribution of the population.[14] This would necessitate 5 or more separate consecutive DTI scans for each patient, which is prohibitive in most clinical DTI acquisitions. WB takes bootstrapping a step further and exploits the fact that the diffusion tensor is derived from linear regressions along 6 or more (60 in our data) non-collinear directions.[11, 12] The residuals from these linear regressions are used to generate a large number of bootstrap samples of the diffusion tensor, without the need for multiple DTI scans. Thus an empirical distribution of the FA measurement is generated at each voxel location within the DTI dataset of each time point (Supplementary Figure A), to allow a voxel-wise statistical comparison of FA values in a particular voxel location among longitudinal DTI datasets of the same subject.
In the current study, we sought to investigate the ability of WB analysis to detect subject-specific changes in DTI indices in a cohort of high school athletes before and after sports-related concussion. A secondary objective was to investigate the relationship between sub-concussive head blows (SHBs) and subject-specific changes in white matter (WM) diffusion properties.
Methods
We performed a prospective cohort study of 10 high school athletes engaged in ice hockey (n=4) and football (n=6), and 5 controls. At the beginning of the 2006/07 sports season, all subjects underwent DTI scanning, cognitive testing, and concussion symptom checklist. Subjects were instructed in the use of a self-report diary to record the number of blows to the head during the season. Subjects were observed by the team athletic trainer during games and by coaches during practices. Subjects were reminded by the athletic trainer at the beginning and end of each game to track and record in their diaries the number of blows to the head they incur during each game and practice.
Subjects were considered to have suffered a concussion if they incurred an injury resulting in witnessed loss of consciousness lasting less than 20 minutes, transient amnesia, or confusion. Amnesia and confusion occurring during a game or practice, and thus witnessed by the athletic trainer or coach, were confirmed on the sideline by application of the Standardized Assessment of Concussion (SAC). The SAC is a brief screening instrument assessing orientation, immediate memory, concentration, and delayed recall, summing to a total score of 30 points.[15] A score of less than 25 was considered consistent with concussion.
Concussed subjects underwent repeat testing within 72 hours of injury. Subjects who did not suffer a concussion during the season underwent repeat testing within one week of the end of the sports season (three months after initial testing).
A mix of uninjured and injured subjects was used as controls. Injured control subjects had isolated minor orthopedic injuries (such as sprains) that required an x-ray but did not reveal a fracture. Initial DTI scanning and cognitive testing occurred within 24 hours of injury. Both uninjured and injured controls were excluded for prior concussion occurring within 1 month of enrollment. DTI and cognitive testing were repeated 1–3 months after initial testing.
Written informed consent was obtained from all participating subjects. This study was approved by the University’s Research Study Review Board.
Computerized Cognitive Testing
Cognitive testing was performed with ImPACT (ImPACT Applications, Inc., Pittsburgh, PA.), a computer-based test battery consisting of a concussion symptom inventory and six modules measuring neuro-cognitive function.[16] These modules are used to generate four composite scores (verbal memory, visual memory, visual motor speed, and reaction time). The concussion symptom inventory is used to generate a post-concussive symptom score. Good performance is indicated by higher scores, except for reaction time and symptoms where lower scores are better.
Diffusion Tensor Imaging
DTI was acquired with a 3T Trio scanner (Siemens, Malvern, PA) using a single-shot SE-EPI sequence with TR/TE= 8000/89 ms, isotropic voxel 2×2×2 mm3, iPAT (GRAPPA) acceleration factor =2, 60 directions of diffusion weighting with 1 average, b=700 s/mm2, one non-diffusion weighted image (b=0) with 10 averages. For whole brain coverage, the total DTI scan time was about 10 minutes.
Wild Bootstrap-Permutation Test
The basic concept behind the WB-based test frame can be outlined as follows. At each voxel, if there is no lesion at that spatial location, measured FA/MD at either the pre- or post-season acquisition should fall into the normal range of the empirical distribution of WB samples. Furthermore, by comparing distributions of FA/MD from longitudinal datasets of the same patient, a valid statistical comparison can be constructed to detect subject-specific DTI changes.
Distributions of DTI parameters, such as FA, are not necessarily Gaussian [17]. To address this issue, a permutation test [18] is applied at each voxel to conduct non-parametric comparisons between empirical distributions from the WB sampling. The permutation test can be applied to any summary statistic without any assumption about the statistical model. In the WB-permutation test frame, the permutation test was not only used to construct a more accurate statistical comparison but also used to correct multiple comparison issues based on the maximal statistics correction method [18]. A more detailed description of the WB-permutation test is included in Appendix A.
Image Processing and Data Analysis
A custom software package developed in C++ and Matlab (Mathworks, Natick, MA), as well as public domain image processing tools, were used in the post-processing and statistical analysis.
DTI images were processed in three steps: a) correction for eddy-current and susceptibility artifacts followed by 12 degrees-of-freedom affine linear registrations between two longitudinal DTI datasets using the FLIRT tool in the FSL package (FMRIB, Oxford University), b) WB sampling of DTI data followed by tensor calculation to generate bootstrap samples of FA/MD and c) voxel-wise permutation tests between bootstrap samples of FA/MD of pre- and post-season to detect significant changes of FA/MD associated with concussion. An optimized WB implementation [16] was applied for generating WB samples. Modified Matlab code based on the SnPM toolbox (www.sph.umich.edu/ni-stat/SnPM/) was used to perform the permutation test and a corrected p value of 0.01 was selected as the significant level to further reduce the false positive ratio.
Quantification of Subject-Specific Changes in FA and MD
To facilitate quantification of FA and MD changes between the two time points, three metrics were used. 1) Total FA% and total MD% changes ([post-season] – [pre-season]), defined as the percent of all WM voxels with a statistically significant change (either increased or decreased) in FA or MD. 2) The directional change ratio (FA+/FA- and MD+/MD−), defined as the ratio of the number of significantly increased voxels divided by the number of significantly decreased voxels. 3) The left/right (L/R) asymmetry ratio, which compares the total number of voxels with significant changes in either FA or MD within the left hemisphere to that in the right. The mean proportion of WM voxels with a statistically significant pre- to post-season change was compared in the controls and SHB athletes using the non-parametric Mann Whitney U-test. The proportion of WM voxels with significant interval changes in FA/MD was correlated in each subject to the number of head hits and to changes in the five cognitive domains using Pearson’s correlation coefficient.
In addition to this whole brain analysis, FA and MD changes were compared in five ROIs, where changes in DTI-derived parameters after mild TBI have been detected in previous studies: external capsule, posterior and anterior corpus callosum, posterior and anterior limb of the internal capsule.[6, 19] All ROIs were drawn using the Type II Johns Hopkins White Matter Parcellation Atlas (JHU WMPA), which contains 56 WM structures. Using DTIStudio software package (cmrm.med.jhmi.edu), a dual-contrast Large Deformation Diffeomorphic Metrix Mapping (LDDMM) method in which both the FA image and the b=0 image were used for non-linear registration simultaneously, was used to transform the JHU WMPA into individual subject’s native space. The binary masks for five ROIs were then automatically generated.
Control subjects were used to assess inter-scan repeatability. For each ROI of the 2 longitudinal DTI datasets of the same control subject, the mean value of FA and MD within the ROI was calculated as the dependent variable. To test the effect of longitudinal scan on the repeatability of the FA/MD measurement, a repeated measurement two-way ANOVA was performed. ROIs (5 levels) and scan time (2 levels) were selected as two independent variables and the significance level was set to p< 0.05.
Results
Ten athletes and 5 non-athlete control were initially recruited. One athlete quit the team during the first week of the season but agreed to continue participating in the study. This athlete was re-categorized as a sixth control (Control 6), leaving nine athletes, as shown in Table 1. Only Athlete 9 suffered a concussion. The remaining athletes recorded between 26 and 399 SHBs during the sports season. The DTI scans of Athletes 7 and 8 were not analyzable due to non-correctable image artifacts, leaving 6 athletes with multiple SHBs and DTI data.
Table 1.
Subject Characteristics
| Subject | Age | Gender | Sport | Position | Number of SHBs |
|---|---|---|---|---|---|
| Control 1 | 20 | M | None* | NA | 0 |
| Control 2 | 21 | M | None* | NA | 0 |
| Control 3 | 25 | M | None* | NA | 0 |
| Control 4 | 21 | F | None* | NA | 0 |
| Control 5 | 35 | M | None+ | NA | 0 |
| Control 6 | 16 | M | Football+ | Wing | 0 |
| Athlete 1 | 17 | M | Football | Linebacker | 26 |
| Athlete 2 | 16 | M | Hockey | Wing | 28 |
| Athlete 3 | 17 | M | Football | Running back | 148 |
| Athlete 4 | 18 | M | Hockey | Defense | 225 |
| Athlete 5 | 17 | M | Football | Wide Receiver | 243 |
| Athlete 6 | 17 | M | Football | Tackle | 289 |
| Athlete 7 | 16 | M | Hockey | Forward | 59 |
| Athlete 8 | 18 | M | Hockey | Forward | 91 |
| Athlete 9 | 17 | M | Football | Free Safety | Mild TBI/399 |
Injured control subject
Uninjured control subject NA-not applicable
The concussed athlete (Athlete 9) had the largest proportion of WM voxels with a statistically significant pre-season to post-injury change with 3.19% of his WM voxels showing significant changes in FA, and 3.44% in MD, as seen in Figure 1. These FA and MD changes co-localized to voxels in the right corona radiata and right inferior longitudinal fasciculus (Figure 2). There was marked L/R hemispheric asymmetry in the location of these changed voxels.
Figure 1.
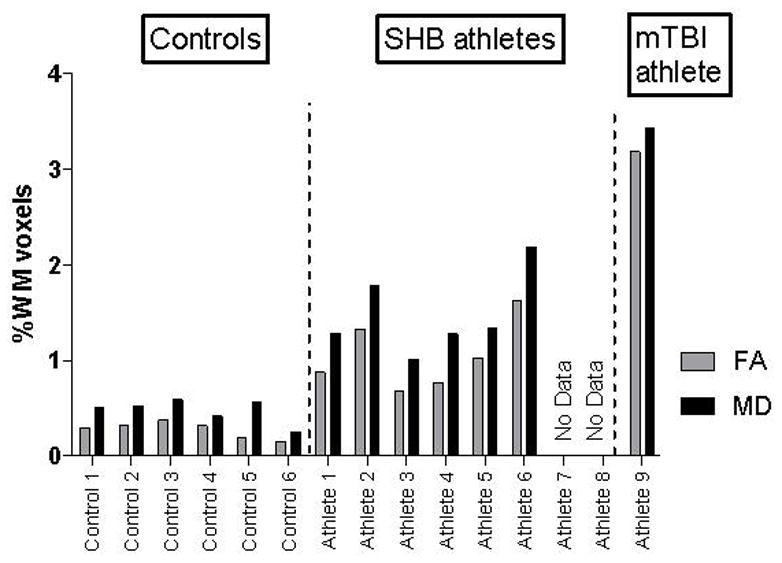
Total Change Ratios in FA and MD for Each Subject
The number of voxels with significant pre-season to post-injury/season changes in FA and MD is quantified by the percent of all WM voxels with a significant change (either increased or decreased) in FA or MD. Change defined as (post-season)-(pre-season).
Figure 2.

T-statistic Map from the WB-Permutation Test
Permutation T-statistic maps of FA (middle row) and MD (bottom row) in the mild TBI athlete (A) and control subject 5 (B) are superimposed on the FA map. Red voxels represent a significant pre-season to post-season/injury increase, while green voxels represent a decrease. The transformed JHU WMPM is also superimposed on the FA map of the corresponding individuals (top row). Deep white matter structures are clearly labeled for identification of regions with significant FA/MD changes from pre- to post-season.
Controls had a relatively small proportion of WM voxels with a statistically significant pre- to post-season change, while athletes with SHB were intermediate between the controls and the single concussed subject (Figure 1). Compared to controls, the SHB athletes had a significantly higher mean percent of white matter voxels with significant changes in FA (1.05±0.15% vs. 0.28±0.01%, p=0.002) and in MD (1.48±0.17% vs. 0.48±0.05%, p=0.002).
FA and MD changes in both directions (increased and decreased) were detected post-season compared to pre-season, as shown in Table 2. Most of these voxels experienced increases in FA and decreases in MD post-season compared to pre-season (Figure 3). The magnitude of these changes among 10 ROIs having the largest number of voxels with significantly increased FA or significantly decreased MD pre- to post-season is shown in Figure 4.
Table 2.
DTI Results from Whole Brain Analysis
| Subject | % ↑FA | % ↓FA | % ↑MD | % ↓MD | L/R asymmetry |
|---|---|---|---|---|---|
| Control 1 | 0.14 | 0.16 | 0.32 | 0.19 | 0.90 |
| Control 2 | 0.19 | 0.14 | 0.20 | 0.33 | 1.16 |
| Control 3 | 0.20 | 0.18 | 0.22 | 0.37 | 1.11 |
| Control 4 | 0.13 | 0.19 | 0.24 | 0.18 | 1.01 |
| Control 5 | 0.10 | 0.10 | 0.29 | 0.29 | 1.00 |
| Control 6 | 0.08 | 0.08 | 0.13 | 0.13 | 1.00 |
| Athlete 1 | 0.57 | 0.31 | 0.51 | 0.78 | 1.03 |
| Athlete 2 | 0.93 | 0.41 | 0.25 | 1.53 | 0.70 |
| Athlete 3 | 0.45 | 0.23 | 0.23 | 0.78 | 0.88 |
| Athlete 4 | 0.39 | 0.39 | 0.64 | 0.64 | 1.21 |
| Athlete 5 | 0.67 | 0.36 | 0.34 | 1.00 | 1.10 |
| Athlete 6 | 0.82 | 0.82 | 1.16 | 1.03 | 0.97 |
| Athlete 7 | ND | ND | ND | ND | ND |
| Athlete 8 | ND | ND | ND | ND | ND |
| Athlete 9 | 2.07 | 1.12 | 0.75 | 2.70 | 0.81 |
FA-fractional anisotropy MD-mean diffusivity L/R-left/right hemisphere ND-no data M-male F-female
Figure 3.
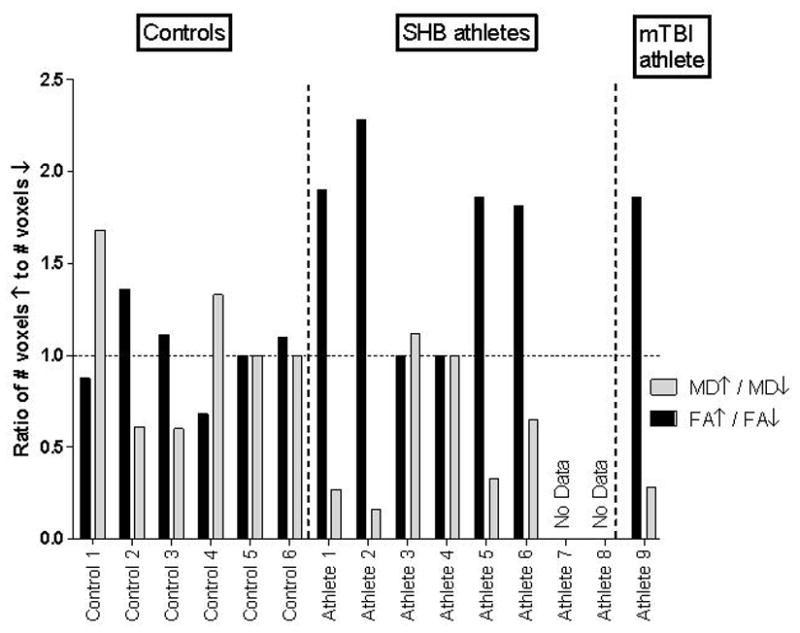
Directional Change Ratios in FA and MD for Each Subject
The direction of changes in FA and MD from pre-season to post-injury/season are quantified by the ratio the number of significantly increased voxels over the number of significantly decreased voxels (FA+/FA- and MD+/MD-). Most subjects display increases in FA and decreases in MD.
Figure 4.

Mean FA and MD values in ROIs with Significant Pre-season to Post-Injury/season Changes.
Mean FA (A) and MD values (B) are displayed from voxels within ten WM structures in which the number of voxels with significantly increased FA or significant decreased MD from pre-season to post-season were among the largest within all 56 ROIs investigated for all athlete subjects. These structures are the right posterior thalamic radiata (PTR-R), the right uncinate fasciculus (UNC-R), the bilateral sagittal stratum (SS_L/R), including the inferior longitudinal fasciculus (ILF) and the inferior fronto-occipital fasciculus (IFOF), the bilateral body of corpus callosum (BCC-L/R), the bilateral retrolenticular part of internal capsule (RLIC-L/R), the right superior corona radiata (SCC-R) and the right cingulum near hippocampus (CGH-R).
Changes in cognitive performance and post-concussive symptoms are shown in Figure 5. The decrement in cognitive performance of the single mild TBI subject over the study interval was greater than that of the controls and the SHB group (with one exception-- visual motor speed-- where he declined less than the controls, but no less than the SHB group). The SHB group had similar changes in cognitive performance as controls. However, in two domains the SHB group actually did better relative to controls.
Figure 5.

Change in Cognitive Performance Pre-season to Post-Injury/season
Changes in Pre-season to Post-Injury/season ImPACT test scores are displayed for the six controls (Control 1–6), the 8 athletes with sub-concussive head blows (Athlete 1–8), and the single mild TBI athlete (Athlete 9). Results are given in terms of mean percent change in score, where change defined as (post-season)-(pre-season). Whiskers represent the maximum and minimum value, the boundaries of the boxes are the 25th and 75th percentile value, and the line in the box is the 50th percentile (median) value.
Increases in post concussive symptom scores over the study interval correlated strongly with the proportion of WM voxels showing significant changes in FA (r=0.86, p=0.0002) and MD (r=0.80, p=0.0009). The number of self-reported head hits also correlated strongly with the proportion of WM voxels showing significant changes in FA (r=0.77, p=0.002) and MD (r=0.78, p=0.0016). Figure 6
Figure 6.

Relationship of Head Hits and Post Concussive Symptoms to Changes in DTI Indices
The number of self-reported head hits correlated strongly with the proportion of WM voxels showing significant changes in: a) FA (r=0.77, p=0.002) and b) MD (r=0.78, p=0.0016). Increases in post concussive symptom scores (post-season score – pre season score) over the study interval also correlated with the proportion of WM voxels showing significant changes in: c) FA (r=0.86, p=0.0002) and d) MD (r=0.80, p=0.0009). Negative post-pre scores indicate an improvement in post-concussive symptoms whereas positive post-pre scores indicate a worsening of symptoms. PC-post concussive.
No significant longitudinal changes of FA and MD were detected for any of the five ROIs in which DTI-derived parameters after mild TBI have been detected in previous studies (Supplementary Figure B). Thus, most of the significantly changed voxels detected on the whole brain analysis were outside of these commonly investigated ROIs. In addition, a repeated-measurement two-way analysis of variance (ANOVA) of the six control subjects revealed that the scan time did not have significant effects on repeatability of FA (F=1.455, p=0.28) and MD measurement (F=1.84, p=0.23).
Discussion
Using the WB analysis, we detected significant WM changes in the right corona radiata and right inferior longitudinal fasciculus of a single concussed athlete. Other researchers have also found WM abnormalities on DTI in these areas after mild TBI [29]. Damage in these areas could underlie this athlete’s poor cognitive performance. The inferior longitudinal fasciculus is involved in semantics of language and verbal memory [30, 31]. The concussed athlete’s performance on verbal memory was relatively poor. However his visual memory performance was even worse. Although damage to corona radiata fibers has not been implicated in decrements of visual memory, strokes involving the inferior longitudinal fasciculus have [32].
We also found significant WM changes among six athletes with multiple SHBs. WB analysis allowed us to estimate for each subject the unique spatial location and magnitude of these DTI changes, which were not detected by a group analysis. In fact, we found no significant DTI changes in the five ROIs commonly analyzed in prior studies. In the current study, most of the changes in FA and MD detected in the whole brain analysis were found to lie outside of these five ROIs, in areas such as the posterior thalamic radiata and the cingulum (Figure 4). We speculate that the location of impact may explain the unique location of injury in each subject. The observed hemispheric asymmetry in changes in FA and MD among all subjects supports this idea. This bootstrap-based analysis, thus, potentially provides unique information to better characterize the pathological changes that occur after concussion and SHBs.
Although WB is a relatively new analytical technique, we believe it detected subject-specific changes in DTI that were real, not spurious. The proportion of significantly changed voxels increased as a function of injury severity, from controls to the athletes with multiple SHBs to the single concussed athlete. Moreover, this incremental increase was strongly related to number of head hits and worsening of post concussive symptoms. Finally, in the concussed athlete voxels with changed FA and voxels with changed MD were found in similar brain locations, while in control subjects they were not. Although we were not able to correlate DTI findings with actual brain tissue histopathology, these observations support the legitimacy of our main results.
The pattern of DTI changes observed after head injury was that of proportionately more voxels with elevated FA and decreased MD. Several authors have found this same pattern of DTI changes[8, 9, 20], while others have found the reverse pattern[6, 7]. As the process of axonal injury is a dynamic one, differences in the time between injury and scanning could be one possible reason for this discrepancy. In animal studies, mean diffusion has been observed to decrease immediately after injury, and then gradually rise to normal levels over two to four days, followed by increased levels that last up to six months.[21–24, 33] The exact timing of DTI changes among humans is less clear.
The b value used during the DTI scans could be another confounding factor. The larger the b value, the greater the attenuation of the diffusion-weighted signal, and the more sensitive DTI is to slower water diffusion. At relatively low b values such the ones used in two prior studies[8, 9] as well as in the current study, the contribution of diffusion attenuation comes mainly from the extra-cellular water diffusion [25]. Axonal injury events outside the axon involve axonal swelling [5], which reduces the space between axon fibers, decreasing the magnitude of water diffusion (reducing MD) and increasing its linearity (increasing FA). These events would explain the pattern of MD and FA changes we observed. Conversely, at high b values, diffusion attenuation comes mainly from the intra-cellular space. Axonal injury events inside the axon involve disassembly and misalignments of microtubular structures [5], which might be expected to also decrease the magnitude of water diffusion but reduce, rather than increase, its linearity. Standardization of injury-scan time intervals as well as b values would help resolve some of this controversy.
The six athletes with multiple SHBs had DTI abnormalities that more closely resembled those of the concussed athlete than of the controls. Among four of these athletes (A1, A2, A5 and A6), the total and directional change ratios mirrored that of the concussed athlete. Figure 3 In addition, these changes appeared to correlate with the number of self-reported head blows. These results suggest that WM alterations occur after multiple SHBs and that the magnitude of these changes approaches that seen with frank concussion. If confirmed in larger cohorts, these results would have broad implications for the many youths and young adults who participate in contact sports such as football and hockey. While much effort has been applied toward the prevention of concussions, the need to prevent—or limit—SHBs may also need to be considered. This might represent a challenge because, unlike concussions that are clinically apparent, SHBs are not. Short of prohibiting all head contact, understanding how impact forces lead to changes in WM may best inform preventive efforts. This might be optimally accomplished through the combined use of DTI and helmet impact sensors. Such helmets have already started to shed light on the nature of impact forces encountered during football and hockey.[26] Examining the relationship between head impact forces and WM changes on DTI might enable the determination of force thresholds above which brain injury is likely to occur.
Our results raise several fundamental questions concerning the nature of SHBs. How long do the DTI changes are associated with SHBs persist? Do they normalize with rest? Do they lower the threshold for developing a clinically evident concussion? What is the relationship of these DTI changes to the risk of second impact syndrome and chronic traumatic encephalopathy? The answers to these questions will help to determine the role of DTI as a complement or replacement to cognitive testing as a guide to the timing of return to contact sports. The poor cognitive performance of the controls in visual motor speed and reaction time (Figure 5)—possibly due to pain from orthopedic injuries—underscores the limitations of cognitive testing as a measure of brain injury. Future research efforts directed at validating our results and addressing these issues seem warranted.
Several study limitations should be taken into consideration when interpreting our results. The number of included subjects (15) is relatively small. The sample size was determined by available funds, not by recruitment. Based on prior studies, we anticipated that 2–3 of the 10 athletes would suffer a concussion. [27] In our cohort, however, only one athlete suffered a concussion. Because of this small sample size our results must be considered preliminary.
Symptom validity measures were not employed as a check against athletes intentionally doing poorly on the baseline cognitive test. In schools were cognitive testing plays a key role deciding when an athlete may return to play, athletes have been known to intentionally perform poorly on baseline testing so that post-concussive decrements would not be revealed. If the athletes in our study intentionally performed poorly on the baseline but not the post season test, this could be a possible reason for improved cognitive scores after SHBs. However, at the time of this study, cognitive testing was not in use to make return to play decisions at the involved high schools, making this possibility less likely.
Image mis-registration may have also contributed to the observation that small but significant changes in FA and MD were observed in the controls. After correction of susceptibility artifacts using the field map-based method [28], linear registration was applied for spatial co-registration. However, residual spatial mismatching may have nonetheless persisted and contributed to false positive errors in the controls. The use of non-linear registration algorithms to improve spatial alignments warrants future study.
The WB-permutation test frame is sensitive to abovementioned residual spatial misalignments. Moreover, because the statistical comparison is performed at each voxel, the level of multiple comparison correction is high, which reduces the statistical power. Fortunately, this limitation serves to underestimate rather than overestimate the number of significant WM voxels changes.
Conclusion
WB analysis detected significantly changed WM in a single concussed athlete. Athletes with multiple SHB had significant changes in a percentage of their WM that was over 3 times higher than controls. If validated in larger cohorts, these results would have broad implications for the many youth and young adults who participate in contact sports such as football and hockey. Efforts to understand the significance of these WM changes, and the relationship between these changes and head impact forces appear warranted.
Supplementary Material
WB Method Schematic
FA and MD in each WM voxel.(A) are represented by the numbered grid, although in the human brain there are over 50,000 WM voxels, not 16. The value of FA in voxel 1 pre-season (x), cannot be compared to FA post-season (y) using traditional statistics.(B). After WB, each single FA value is converted into an FA distribution, which can then be compared using a permuted t-test. (C)
Mean FA and MD values in Five Commonly Analyzed ROIs
ROI-based analysis results of FA (A) and MD (B) measurements among 6 controls and 7 athletes. Mean FA/MD values in five ROIs are calculated and compared in the genu of the corpus callosum (GCC), the splenium of the corpus callosum (SCC), the anterior limb of the internal capsule (ALIC), the posterior limb of the internal capsule (PLIC) and the external capsule (EC). There are no significant group difference between controls and athletes nor significant longitudinal difference within athletes in any ROI. Error bars reflect the standard deviation of mean FA/MD of the ROI among different subjects of the same group.
Acknowledgments
Support for this study was provided by NIH grant 1R01HD051865 (Bazarian) and by a grant from the University of Rochester Health Sciences Center For Computational Innovation (Zhu).
Footnotes
These data were presented in April, 2010 at the 62nd Annual Meeting of the American Academy of Neurology in Toronto, Canada.
Publisher's Disclaimer: This is a PDF file of an unedited manuscript that has been accepted for publication. As a service to our customers we are providing this early version of the manuscript. The manuscript will undergo copyediting, typesetting, and review of the resulting proof before it is published in its final citable form. Please note that during the production process errors may be discovered which could affect the content, and all legal disclaimers that apply to the journal pertain.
Contributor Information
Jeffrey J Bazarian, Email: jeff_bazarian@urmc.rochester.edu, Associate Professor of Emergency Medicine, Neurology, Neurosurgery, Community & Preventive Medicine, University of Rochester School of Medicine, 601 Elmwood Ave, Rochester, NY 14642, Telephone: 585.463.2945, Fax: 585.473.3516.
Tong Zhu, Email: tong_zhu@urmc.rochester.edu, Research Assistant Professor of Imaging Sciences, University of Rochester School of Medicine, 601 Elmwood Ave, Rochester, NY 14642, Telephone: 585.275.5885, Fax: 585.273.1033.
Brian Blyth, Email: brian_blyth@urmc.rochester.edu, Assistant Professor of Emergency Medicine, University of Rochester School of Medicine, 601 Elmwood Ave, Rochester, NY 14642, Telephone: 585.275.0417, Fax: 585.473.3516.
Allyson Borrino, Email: allyson_borrino@urmc.rochester.edu, Sports Medicine, University of Rochester School of Medicine, 601 Elmwood Ave, Rochester, NY 14642, Telephone: 585. 358.1787, Fax: 585.340.9745.
Jianhui Zhong, Email: jianhui_zhong@urmc.rochester.edu, Professor of Imaging Science, Biomedical Engineering, and Physics, University of Rochester School of Medicine, 601 Elmwood Ave, Rochester, NY 14642, Telephone: 585. 273.4518, Fax: 585.273.1033.
References
- 1.Faul M, Wald MM, Coronado VG. Traumatic Brain Injury in the United States: Emergency Department Visits, Hospitalizations and Deaths 2002–2006. Centers for Disease Control and Prevention, National Center for Injury Prevention and Control; Atlanta, GA: 2010. [Google Scholar]
- 2.Thurman DJ, Branche CM, Sniezek JE. The epidemiology of sports-related traumatic brain injuries in the United States: recent developments. J Head Trauma Rehab. 1998;13(2):1–8. doi: 10.1097/00001199-199804000-00003. [DOI] [PubMed] [Google Scholar]
- 3.Bazarian JJ, Cernak I, Noble-Haeusslein L, Potolicchio S, Temkin N. Long-term neurologic outcomes after traumatic brain injury. J Head Trauma Rehab. 2009;24(6):439–51. doi: 10.1097/HTR.0b013e3181c15600. [DOI] [PubMed] [Google Scholar]
- 4.Omalu BI, DeKosky ST, Minster RL, Kamboh MI, Hamilton RL, Wecht CH. Chronic traumatic encephalopathy in a National Football League player. Neurosurgery. 2005;57(1):128–34. doi: 10.1227/01.neu.0000163407.92769.ed. [DOI] [PubMed] [Google Scholar]
- 5.Povlishock JT, Katz DI. Update of neuropathology and neurological recovery after traumatic brain injury. J Head Trauma Rehab. 2005;20(1):76–94. doi: 10.1097/00001199-200501000-00008. [DOI] [PubMed] [Google Scholar]
- 6.Arfanakis K, Haughton VM, Carew JD, Rogers BP, Dempsey RJ, Meyerand ME. Diffusion tensor MR imaging in diffuse axonal injury. AJNR Am J Neuroradiol. 2002;23(5):794–802. [PMC free article] [PubMed] [Google Scholar]
- 7.Inglese M, Makani S, Johnson G, Cohen BA, Silver JA, Gonen O, Grossman RI. Diffuse axonal injury in mild traumatic brain injury: a diffusion tensor imaging study. J Neurosurg. 2005;103(2):298–303. doi: 10.3171/jns.2005.103.2.0298. [DOI] [PubMed] [Google Scholar]
- 8.Bazarian JJ, Zhong J, Blyth B, Zhu T, Kavcic V, Peterson D. Diffusion tensor imaging detects clinically important axonal damage after mild traumatic brain injury: a pilot study. J Neurotrauma. 2007;24(9):1447–59. doi: 10.1089/neu.2007.0241. [DOI] [PubMed] [Google Scholar]
- 9.Wilde EA, McCauley SR, Hunter JV, Bigler ED, Chu Z, Wang ZJ, Hanten GR, Troyanskaya M, Yallampalli R, Li X, Chia J, Levin HS. Diffusion tensor imaging of acute mild traumatic brain injury in adolescents. Neurology. 2008;70(12):948–55. doi: 10.1212/01.wnl.0000305961.68029.54. [DOI] [PubMed] [Google Scholar]
- 10.Ashburner J, Friston KJ. Voxel-based morphometry--the methods. Neuroimage. 2000;11(6 Pt 1):805–21. doi: 10.1006/nimg.2000.0582. [DOI] [PubMed] [Google Scholar]
- 11.Whitcher B, Tuch DS, Wisco JJ, Sorensen AG, Wang L. Using the wild bootstrap to quantify uncertainty in diffusion tensor imaging. Human Brain Mapping. 2008;29(3):346–62. doi: 10.1002/hbm.20395. [DOI] [PMC free article] [PubMed] [Google Scholar]
- 12.Zhu T, Liu X, Connelly PR, Zhong J, Zhu T, Liu X, Connelly PR, Zhong J. An optimized wild bootstrap method for evaluation of measurement uncertainties of DTI-derived parameters in human brain. Neuroimage. 2008;40(3):1144–56. doi: 10.1016/j.neuroimage.2008.01.016. [DOI] [PubMed] [Google Scholar]
- 13.Efron B. An Introduction to the Bootstrap. Chapman and Hall; New York: 1993. p. 436. [Google Scholar]
- 14.O’Gorman RL, Jones DK. Magn Reson Med. 2006;56(4):884–90. doi: 10.1002/mrm.21014. [DOI] [PubMed] [Google Scholar]
- 15.McCrea M, Kelly JP, Randolph C, Kluge J, Bartolic E, Finn G, Baxter B. Standardized assessment of concussion (SAC): on-site mental status evaluation of the athlete. J Head Trauma Rehab. 1998;13(2):27–35. doi: 10.1097/00001199-199804000-00005. [DOI] [PubMed] [Google Scholar]
- 16.Collins MW, Iverson GL, Lovell MR, McKeag DB, Norwig J, Maroon J. On-field predictors of neuropsychological and symptom deficit following sports-related concussion. Clin J Sport Med. 2003;13(4):222–9. doi: 10.1097/00042752-200307000-00005. [DOI] [PubMed] [Google Scholar]
- 17.Jones DK, Symms MR, Cercignani M, Howard RJ. The effect of filter size on VBM analyses of DT-MRI data. Neuroimage. 2005;26(2):546–54. doi: 10.1016/j.neuroimage.2005.02.013. [DOI] [PubMed] [Google Scholar]
- 18.Nichols TE, Holmes AP. Nonparametric permutation tests for functional neuroimaging: a primer with examples. Human Brain Mapping. 2002;15(1):1–25. doi: 10.1002/hbm.1058. [DOI] [PMC free article] [PubMed] [Google Scholar]
- 19.Liu AY, Maldjian JA, Bagley LJ, Sinson GP, Grossman RI. Traumatic brain injury: diffusion-weighted MR imaging findings. AJNR Am J Neuroradiol. 1999;20(9):1636–41. [PMC free article] [PubMed] [Google Scholar]
- 20.Mayer AR, Ling J, Mannell MV, Gasparovic C, Phillips JP, Doezema D, Reichard R, Yeo RA. A prospective diffusion tensor imaging study in mild traumatic brain injury. Neurology. 2010;74(8):643–50. doi: 10.1212/WNL.0b013e3181d0ccdd. [DOI] [PMC free article] [PubMed] [Google Scholar]
- 21.Mac Donald CL, Dikranian K, Bayly Holtzman PD, Brody D. Diffusion tensor imaging reliably detects experimental traumatic axonal injury and indicates approximate time of injury. J Neuroscience. 2007;27(44):11869–76. doi: 10.1523/JNEUROSCI.3647-07.2007. [DOI] [PMC free article] [PubMed] [Google Scholar]
- 22.Obenaus A, Robbins M, Blanco G, Galloway NR, Snissarenko E, Gillard E, Lee S, Curras-Collazo M. Multi-modal magnetic resonance imaging alterations in two rat models of mild neurotrauma. J Neurotrauma. 2007;24(7):1147–60. doi: 10.1089/neu.2006.0211. [DOI] [PubMed] [Google Scholar]
- 23.Pasco A, Lemaire L, Franconi F, Lefur FY, Noury F, Saint-Andre JP, Benoit JP, Cozzone PJ, Le Jeune JJ. Perfusional deficit and the dynamics of cerebral edemas in experimental traumatic brain injury using perfusion and diffusion-weighted magnetic resonance imaging. J Neurotrauma. 2007;24(8):1321–30. doi: 10.1089/neu.2006.0136. [DOI] [PMC free article] [PubMed] [Google Scholar]
- 24.Immonen RJ, Kharatishvili I, Niskanen JP, Grohn H, Pitkanen A, Grohn OH. Distinct MRI pattern in lesional and perilesional area after traumatic brain injury in rat--11 months follow-up. Exp Neurol. 2009;215(1):29–40. doi: 10.1016/j.expneurol.2008.09.009. [DOI] [PubMed] [Google Scholar]
- 25.Le Bihan D, Poupon C, Clark CA, Pappata S, Molko N, Chabriat H. Diffusion tensor imaging: concepts and applications. J Mag Reson Imaging. 2001;13(4):534–46. doi: 10.1002/jmri.1076. [DOI] [PubMed] [Google Scholar]
- 26.Greenwald RM, Gwin JT, Chu JJ, Crisco JJ. Head impact severity measures for evaluating mild traumatic brain injury risk exposure. Neurosurgery. 2008;62(4):789–98. doi: 10.1227/01.neu.0000318162.67472.ad. [DOI] [PMC free article] [PubMed] [Google Scholar]
- 27.Langburt W, Cohen B, Akhthar N. Incidence of concussion in high school football players of Ohio and Pennsylvania. J Child Neurol. 2001;16(2):83–5. doi: 10.1177/088307380101600203. [DOI] [PubMed] [Google Scholar]
- 28.Jezzard P, Balaban RS. Correction for geometric distortion in echo planar images from B0 field variations. Magn Reson Med. 1995;34(1):65–73. doi: 10.1002/mrm.1910340111. [DOI] [PubMed] [Google Scholar]
- 29.Niogi SN, Mukherjee P, Ghajar J, Johnson C, Kolster RA, Sarkar R, Lee H, Meeker M, Zimmerman RD, Manley GT, McCandliss BD. Extent of microstructural white matter injury in postconcussive syndrome correlates with impaired cognitive reaction time: a 3T diffusion tensor imaging study of mild traumatic brain injury. Ajnr: American Journal of Neuroradiology. 2008;29(5):967–73. doi: 10.3174/ajnr.A0970. [DOI] [PMC free article] [PubMed] [Google Scholar]
- 30.Mandonnet E, Nouet A, Gatignol P, Capelle L, Duffau H. Does the left inferior longitudinal fasciculus play a role in language? A brain stimulation study. Brain. 2007;130:623–29. doi: 10.1093/brain/awl361. [DOI] [PubMed] [Google Scholar]
- 31.Shinouraa N, Suzukib Y, Tsukadac M, Yoshidad M, Yamadaa R, Tabeia Y, Saitoa K, Koizumia T, Yagib K. Deficits in the left inferior longitudinal fasciculus results in impairments in object naming. Neurocase. 2010;16 (2):135–139. doi: 10.1080/13554790903329174. [DOI] [PubMed] [Google Scholar]
- 32.Shinoura N, Suzuki Y, Tsukadac M, Katsukic S, Yamadaa R, Tabeia Y, Saitoa K, Yagib K. Impairment of Inferior Longitudinal Fasciculus plays a Role in Visual Memory Disturbance. Neurocase. 2007;13:127–30. doi: 10.1080/13554790701399254. [DOI] [PubMed] [Google Scholar]
- 33.Li J, Li XY, Feng DF, Gu L. Quantitative evaluation of microscopic injury with diffusion tensor imaging in a rat model of diffuse axonal injury. European Journal of Neuroscience. 2011;33:933–945. doi: 10.1111/j.1460-9568.2010.07573.x. [DOI] [PubMed] [Google Scholar]
Associated Data
This section collects any data citations, data availability statements, or supplementary materials included in this article.
Supplementary Materials
WB Method Schematic
FA and MD in each WM voxel.(A) are represented by the numbered grid, although in the human brain there are over 50,000 WM voxels, not 16. The value of FA in voxel 1 pre-season (x), cannot be compared to FA post-season (y) using traditional statistics.(B). After WB, each single FA value is converted into an FA distribution, which can then be compared using a permuted t-test. (C)
Mean FA and MD values in Five Commonly Analyzed ROIs
ROI-based analysis results of FA (A) and MD (B) measurements among 6 controls and 7 athletes. Mean FA/MD values in five ROIs are calculated and compared in the genu of the corpus callosum (GCC), the splenium of the corpus callosum (SCC), the anterior limb of the internal capsule (ALIC), the posterior limb of the internal capsule (PLIC) and the external capsule (EC). There are no significant group difference between controls and athletes nor significant longitudinal difference within athletes in any ROI. Error bars reflect the standard deviation of mean FA/MD of the ROI among different subjects of the same group.