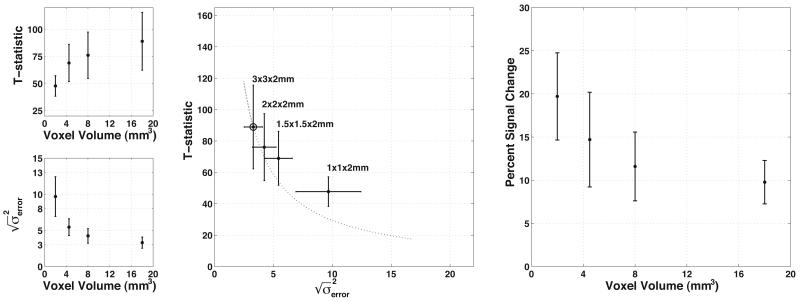
Figure 6.
The effect of decreased partial volume averaging on task-related activation, the residual model error, and voxel volume. All points/bars represent the mean/standard deviation across subjects of the average value across active voxels. (top left) T-statistics decrease with decreasing voxel volume in a nonlinear fashion. (bottom left) The deviation of the model error decreases as voxel volume increases. (center) The decrease in the T-statistic as a function of model error is less than would be predicted by theory. The dotted line represents the theoretical decrease given the initial point measured with 3×3×2mm voxels, marked by an additional circle. (right) Functional contrast increases as voxel volume decreases, indicating less dilution of the functional signals by partial volume averaging.

