

Abstract
The tRNAHis guanylyltransferase (Thg1) catalyzes the incorporation of a single guanosine residue to the −1 position (G−1) of tRNAHis, using an unusual 3′-5′ nucleotidyl transfer reaction. Thg1 and Thg1 orthologs known as Thg1-like proteins (TLPs), which catalyze tRNA repair and editing, are the only known enzymes that add nucleotides in the 3′-5′ direction. Thg1 enzymes share no identifiable sequence similarity to any other known enzyme family that could be used to suggest the mechanism for catalysis of the unusual 3′-5′ addition reaction. The high resolution crystal structure of human Thg1 revealed remarkable structural similarity between canonical DNA/RNA polymerases and eukaryotic Thg1; nevertheless questions remain regarding the molecular mechanism of 3′-5′ nucleotide addition. Here, we use transient kinetics to measure the pseudo-first order forward rate constants for the three steps of the G−1 addition reaction catalyzed by yeast Thg1: adenylylation of the 5′ end of the tRNA (kaden), nucleotidyl transfer (kntrans), and removal of pyrophosphate from the G−1 containing tRNA (kppase). This kinetic framework, in conjunction with the crystal structure of nucleotide-bound Thg1, suggests a likely role for two-metal-ion chemistry in all three chemical steps of the G−1 addition reaction. Furthermore we have identified additional residues (K44 and N161) involved in adenylylation and three positively charged residues (R27, K96, R133) that participate primarily in the nucleotidyl transfer step of the reaction. These data provide a foundation for understanding the mechanism of 3′-5′ nucleotide addition in tRNAHis maturation.
Fidelity of protein synthesis largely depends on the ability of aminoacyl-tRNA synthetases to distinguish between cognate and non-cognate tRNA substrates. However, due to similar secondary and tertiary structures of all tRNAs, proper substrate recognition must be facilitated by identity elements present within the primary sequence of tRNAs. Many characterized identity elements are located in either the anticodon, or in the aminoacyl-acceptor stem, with the discriminator nucleotide (N73) often playing a significant role (1).
In most organisms, the histidyl-tRNA synthetase (HisRS)1 recognizes a single guanosine residue located at the −1 position (G−1) of tRNAHis as a critical identity element (2-7). In E. coli, G−1 is genomically encoded and retained in the primary transcript following ribonuclease P (RNase P) cleavage of the 5′ leader sequence from the precursor tRNAHis; a similar mechanism is predicted to incorporate G−1 in most bacteria and some archaea (8). Cleavage of the pre-tRNA in this case results in a 5′-monophosphorylated tRNAHis containing a G−1:C73 Watson-Crick (WC) base pair. However, in eukaryotes the G−1 residue is not genomically encoded and therefore this mechanism of incorporating the G−1 identity element cannot occur. Instead, G−1 is added post-transcriptionally via an unusual 3′-5′ addition reaction, as first described in Schizosaccharomyces pombe and Drosophila melanogaster (9). In these organisms, the additional residue is added opposite a universally conserved adenosine at position 73, resulting in a non-WC G−1:A73 base pair at the top of the acceptor stem.
The enzyme that catalyzes post-transcriptional G−1 addition, the tRNAHis guanylyltransferase (Thg1), was first discovered in Saccharomyces cerevisiae, where it was demonstrated that controlled depletion of Thg1 correlates with accumulation of tRNAHis lacking G−1, reduction in aminoacylated tRNAHis, and unexpected accumulation of m5C modifications at positions 48 and 50 (10, 11). In yeast, the THG1 gene is essential for optimal growth, although overexpression of HisRS and its cognate tRNAHis can suppress the lethal growth phenotype of the yeast deletion strain (12). In accordance with the essential role for G−1 in tRNAHis recognition, Thg1 is highly conserved throughout eukaryotes, which nearly all lack a genomically encoded G−1 residue (10). Interestingly, Thg1 orthologs referred to as Thg1-like proteins (TLPs) have been identified in some bacteria and archaea that also contain a genomically encoded G−1, where TLPs have been implicated in tRNA 5′-end repair reactions (13-15)
The molecular mechanism of Thg1 is of extreme interest because the Thg1 enzymes are the only known enzymes that catalyze nucleotide addition in the 3′-5′ direction. However, the mechanism of 3′-5′ addition cannot be inferred through identifiable sequence similarity between Thg1 enzymes and any other known enzyme family. Yeast Thg1 (yThg1) adds G−1 to a 5′ monophosphorylated tRNAHis (p-tRNAHis) species generated from RNase P cleavage of the precursor tRNA, and selective recognition of tRNAHis is ensured through recognition of the His anticodon (GUG) (16). G−1 addition to the physiologically-relevant p-tRNAHis substrate proceeds via a three step reaction (Fig. 1A). First, yThg1 activates the 5′ end of p-tRNAHis using ATP in an adenylylation step, resulting in formation of an adenylylated intermediate (App-tRNAHis) containing a 5′-5′ phosphoanhydride bond. The presence of the App-activated intermediate was first demonstrated with partially purified yeast enzyme, and confirmed later using purified yThg1, once the identity of the gene was known (10, 17). In both cases, incorporation of [α-32P]-AMP from labeled ATP into tRNAHis was confirmed by P1 and snake venom nuclease analysis of reaction products, and release of the labeled AMP upon addition of G−1 was also demonstrated. In the second step of the G−1 addition reaction, yThg1 utilizes the 3′-hydroxyl of GTP to attack the intermediate in a nucleotidyl transfer step, releasing AMP and resulting in addition of a single GTP to the 5′ end of the tRNA (pppG−1p-tRNAHis). Third, yThg1 removes pyrophosphate from the G−1 residue in a pyrophosphate removal step, yielding mature pG−1-containing tRNAHis (pG−1p-tRNAHis). Thg1 can also add nucleotides to a 5′-triphosphorylated tRNAHis (ppp-tRNAHis) in the absence of ATP in vitro (Fig. 1B) (10). The ppp-tRNAHis substrate is presumed to mimic the adenylylated intermediate, allowing Thg1 to bypass the adenylylation step when acting on a substrate containing a pre-activated 5′ end.
Figure 1. Two pathways for G−1 addition to tRNAHis.

(A) Three step reaction scheme for addition to the physiologically relevant 5′-monophosphorylated tRNAHis. (B) Alternative pathway for G−1 addition in vitro using a 5′-ppp-tRNAHis, in which Thg1 bypasses the activation step.
In addition to non-WC G−1 addition that occurs in vivo in yeast with A73-containing tRNAHis, the natural substrate in eukaryotes, yThg1 also catalyzes multiple rounds of nucleotide addition in a strictly template-dependent 3′-5′ polymerase reaction with a C73-containing tRNAHis variant in vitro (18). This reverse polymerase activity forms G:C and C:G WC base pairs, and while yThg1 does not polymerize A:U and U:A base pairs with these substrates, other Thg1 family enzymes have the ability to polymerize any of the four WC base pairs (13). Although an in vivo function for 3′-5′ polymerization in yeast remains unknown, Thg1 family enzymes from every domain of life catalyze the WC-dependent reverse polymerase activity, suggesting that this may be an ancestral activity of the earliest Thg1 family members (13, 14). The 3′-5′ polymerase activity is likely exploited by TLPs to facilitate tRNA 5′-end repair and a 5′-tRNA editing reaction that occurs in the mitochondria of lower eukaryotes (13, 19). Despite the lack of identifiable sequence similarity between Thg1 and any other known enzyme, the putative active site of human Thg1 (hThg1) shares significant structural similarity with canonical WC-dependent 5′-3′ DNA/RNA polymerases. This suggests the possibility of a common evolutionary origin between 5′-3′ and 3′-5′ nucleotide addition enzymes (20)
The long-term goal of this work is to determine the complete molecular mechanism for the unusual enzymatic activity catalyzed by Thg1. The hThg1 structure suggested that Thg1 utilizes two-metal-ion catalysis, a feature also shared among canonical DNA/RNA nucleotidyl transferase enzymes (21, 22), and alanine-scanning mutagenesis previously identified 19 residues that are important for the overall G−1 addition reaction (23). However, the precise roles of the metal ions and of individual Thg1 residues in the 3′-5′ addition reaction were not addressed by these earlier studies. To fully understand the complex, multistep reaction catalyzed by yThg1, we developed single turnover kinetic assays that allow isolation and characterization of each of the three individual chemical steps that occur during addition of G−1 to tRNAHis in yeast (adenylylation, nucleotidyl transfer and pyrophosphate removal). Here we use this approach to construct a kinetic framework for the non-WC-dependent G−1 addition reaction catalyzed by yThg1, which is the first in-depth biochemical investigation into the molecular mechanism of any Thg1 family member. We also assign functional roles for nine highly conserved yThg1 residues that participate in the mechanism of G−1 addition.
MATERIALS AND METHODS
Nucleotides and reagents
NTPs (100 mM LiCl salts) used for enzyme assays were purchased from Roche; γ32P-ATP (6000 Ci/mmol), α32P-ATP (3000 Ci/mmol) and γ32P-GTP (6000 Ci/mmol) were purchased from Perkin Elmer. Oligonucleotides were purchased from Sigma and enzymes for labeled tRNA substrate preparation (T4 polynucleotide kinase, alkaline phosphatase) were from New England Biolabs. For Thg1 transient kinetic assays ribonuclease A was purchased from Ambion and calf alkaline intestinal phosphatase from Invitrogen.
Thg1 expression and purification
E. coli strain BL21-DE3(pLysS) was used for overexpression and purification of yThg1, which was performed essentially as previously described for the N-terminally His6-tagged enzyme (14, 23). Briefly, Thg1 proteins (wild-type and variants) were purified from 0.5 L culture using immobilized metal ion affinity chromatography, dialyzed into buffer containing 50% glycerol for storage at −20 °C, and assessed for purity (≥ 90% for wild-type and all alanine yThg1 variants as judged by visual inspection of the purified enzyme preparation) using SDS-PAGE. Concentrations of wild-type and variant proteins were determined by Bio-Rad protein assay; we note that the concentrations used for the kinetic measurements reflect the total concentration of Thg1 monomer in each reaction, and are not adjusted for fraction of active enzyme in each preparation.
Adenylylation assay
Kinetic parameters for the adenylylation step of the G−1 addition reaction were determined at room temperature by reacting 5′-[32P] monophosphorylated tRNAHis (p*tRNAHis) substrate (≤ 40 nM) with ATP in the presence of excess enzyme. 5′-32P-labeled tRNAHis was generated by in vitro transcription followed by phosphatase treatment and labeling with T4 polynucleotide kinase, as previously described (16). Thg1 reaction buffer (used for all assays) contained 10 mM MgCl2, 3 mM dithiothreitol (DTT), 125 mM NaCl and 0.2 mg/mL BSA, buffered using either 25 mM 4-2-hydroxyethyl-1-piperazineethanesulfonic acid (HEPES) pH 7.5, or using a tri-buffer system that spans a broad pH range (25 mM sodium acetate, 50 mM 2-[Bis-(2-hydroxyethyl)-amino]-2-hydroxymethyl-propane-1,3-diol (Bis-Tris) and 50 mM 2-Amino-2-hydroxymethyl-propane-1,3-diol-HCl (Tris)) for assays at pH 6.0.
For determination of KDapptRNA, reactions were performed in the presence of a saturating concentration of ATP (1mM) with varying concentrations of enzyme (0.05– 15 μM) and were initiated by addition of enzyme to pre-incubated tRNA and ATP. For determination of KDapp ATP, reactions contained saturating concentrations of enzyme (15 μM) while ATP concentration was varied (0.1 – 3 mM), and were initiated by addition of ATP to pre-incubated enzyme and tRNA. At specific time points, a 5 μL aliquot was removed from each reaction to a new tube containing 0.5 μL 500 mM ethylenediamine tetraacetic acid (EDTA) to quench the reactions, and 0.5 μL 10 mg/mL ribonuclease A (RNase A) to digest the labeled RNA preferentially after each pyrimidine, yielding a labeled 5′-oligonucleotide derived from the cleavage at nucleotide C+2. The quenched reactions were incubated at 50°C for 10 min, after which time, 0.5 U alkaline phosphatase was added to each quenched reaction and incubated at 37°C for 35 min to remove terminal phosphates from the digested reaction products. The resulting oligonucleotide App*GpC (corresponding to the adenylylated tRNA reaction product) and inorganic phosphate (Pi*, generated from unreacted tRNA) were resolved using silica TLC plates (EM Science) in an n-propanol: NH4OH: H20 (55:35:10, v:v:v) solvent system, visualized and quantified using a Typhoon trio and ImageQuant software (GE Healthsciences). A small amount of Ap*GpC oligonucleotide corresponding to addition of A−1 to the tRNA is also observed under these conditions, thus the amount of both products (App*GpC and A−1p*GpC) were included for determination of kobs.
Time courses of product formation were plotted and fit to a single exponential rate equation (eq. 1) using Kaleidagraph (Synergy software), where Pt is the fraction product formed at each time and ΔP is the maximal amount of product conversion observed during each time course.
| (eq. 1) |
The resulting kobs values determined for each concentration of ATP or Thg1 were plotted and fit to eq. 2 or eq. 3, respectively, as described in the text to yield the pseudo-first order maximal rate constants and dissociation constants. All reported kinetic parameters were determined using kobs values derived from at least two independent experiments, and reported errors in kmax and KD,app are the least squares estimate of the standard error derived from the fit to the data using Kaleidagraph.
| (eq.2) |
| (eq. 3) |
For yThg1 alanine variants with slow activity (< 20% conversion to products after 4 hours of reaction), kobs was estimated using the method of initial rates, according to eq. 4, where vo is the linear initial rate derived from the slope of the fraction product vs. time plots and ΔPt is the maximal fraction of product conversion determined separately using wild-type Thg1 and the relevant substrate.
| (eq. 4) |
Nucleotidyl transfer assays
Kinetic parameters for the nucleotidyl transfer step were determined at room temperature by reacting a 5′-[γ32P] triphosphorylated tRNAHis (5′p*pp-tRNAHis) substrate (100-300 nM) generated by in vitro transcription (16) with GTP in the presence of excess enzyme, in Thg1 reaction buffers described above. At various time points, aliquots (3 μL) were removed to a new tube containing 1 μL of 250 mM EDTA to quench the reactions, then 2 μL of each quenched time point was spotted to PEI-cellulose TLC plates (EM Science). Plates were washed in 100% methanol and air dried, and resolved using a 0.5 M potassium phosphate, pH 6.3:methanol (80:20, v:v) solvent system to separate the labeled pyrophosphate (P*Pi) from unreacted labeled tRNA. For determination of KDapp GTP, reactions contained a saturating concentration of enzyme (15 μM) pre-incubated with labeled tRNA, and were initiated by the addition of varied concentrations of GTP (0.4-500 μM). For determination of KDapp tRNA, observed rates of nucleotidyltransfer were measured from reactions containing pre-incubated labeled tRNA and a saturating concentration of GTP (250 μM), initiated by the addition of varied concentration of enzyme (0.5-30 μM). The kobs for each condition was determined either by fit of the time courses of product formation to the single exponential rate equation (eq. 1), or by the method of linear initial rates for slow reactions (eq. 4) , and further used to determine kntrans and KD values (eq. 2 and eq. 3), as described above for adenylylation.
Pulse chase nucleotidyl transfer assays
To generate labeled adenylylated tRNAHis, unlabeled p-tRNAHis (0.5 μM) was incubated in a 36 μL reaction containing 1-1.5 μCi (100-200 nM) [α32P]-ATP and excess yThg1 (15 μM) in Thg1 reaction buffer at room temperature for 1 hour at pH 6.0 or for 3-4 hours at pH 7.5. To each reaction, a chase was performed by addition of a large excess concentration of ATP and GTP, yielding a total reaction volume of 39 μL. For pH 6.0 reactions, the chased reactions contained a final concentration of 50 μM ATP and 250 μM GTP, and for pH 7.5 reactions, final concentrations were 1.0 μM ATP and 25 μM GTP. At various times following the addition of the unlabeled GTP and ATP, aliquots of the reaction (3 μL) were removed to a new tube containing 1 μL of 250 mM EDTA to quench the reaction. An equal volume of sample loading dye (containing 95 % formamide, 0.1 % xylene cyanol and 0.1 % bromophenol blue) was added to each quenched reaction and products were resolved on a 10% polyacrylamide, 4 M urea denaturing gel. The dried gel was visualized using a Typhoon trio (GE Healthsciences), and the amount of labeled tRNA at each time was quantified using ImageQuant (GE Healthsciences). Time courses of decay of the activated intermediate, normalized to the amount of activated tRNA present at the time of the chase were fit either to eq. 1 to yield kobs (pH 7.5 data) or to both eq. 1 and eq. 5 for the data at pH 6.0 where the double exponential rate equation fits the data. In eq. 5, ΔPf is the amplitude of decay products that result from the fast-reacting state, and ΔPs is the amplitude of decay products resulting from the slow-reacting state, and kobs-fast and kobs-slow are the rate constants for the respective reactions.
| (eq. 5) |
Pyrophosphate removal assays
Kinetic parameters for removal of pyrophosphate were determined at room temperature by reacting a 5′-[γ32P] triphosphorylated G−1-tRNAHis (5′p*pp G−1tRNAHis) transcript (100-300 nM) in the presence of excess enzyme in the same reaction buffers described above. Observed rates (kobs) for pyrophosphate removal were measured at varied concentrations of enzyme in the presence and absence of 1 mM GTP. Reactions were initiated by addition of enzyme to tRNA (± GTP) and 3 μL aliquots were quenched at various time points by addition of 1 μL of 250 mM EDTA. The removal of pyrophosphate (P*Pi) from unreacted tRNA was visualized using PEI-cellulose TLC, as described above for nucleotidyl transfer. Time courses of product formation for wild-type Thg1 were fit to eq. 1 to yield kobs. For alanine variants with low activity (time courses indicate linear product formation after four hours), kobs was estimated using the method of initial rates (eq. 4). Pseudo-first order maximal rate constants and dissociation constants were determined using eq. 3.
Preparation and analysis of yThg1 alanine variants
yThg1 alanine variants R27A, D29A, D77A, E78A, K44A, N161A, R133A, and K96A were described previously (20, 23). The S76A yThg1 variant was created for this study using Quik-Change (Agilent) according to the manufacturer’s instructions, using complementary pairs of oligonucleotides and the plasmid encoding N-terminally His6-tagged yeast Thg1 as the template for the mutagenesis experiment. Thg1 variant proteins were purified using immobilized metal-ion affinity chromatography as described above for wild-type yThg1. Adenylylation of nucleotidyl transfer kinetic parameters were measured at the optimal pH for each activity determined with the wild-type enzyme, using 15 μM of each alanine variant under single turnover conditions. Reactions with higher concentrations of Thg1 to test for saturation of the observed rates with respect to tRNA were determined for certain variants, as indicated in the text. For adenylylation, reactions were performed at pH 6.0 and contained varied concentrations of ATP (0.075-5 mM), and nucleotidyl transfer reactions were performed at pH 7.5 and contained varied concentrations of GTP (0.005-2 mM). Observed rates for each concentration of NTP were determined using eq. 1, or by the method of initial rates (eq.4) for variants with slow catalytic activity, and fit to eq. 2 to yield the kmax and KD,appNTP for the indicated step. For pyrophosphate removal, a single kobs measurement was performed with 15 μM of each variant enzyme at pH 7.5; reported values are the average of at least two independent experiments.
RESULTS
Analysis of the activation step
Using single turnover conditions ([E]/[tRNA] ≥ 5), we measured the observed rate (kobs) for each of the three chemical steps for the non-templated addition of G−1 to yeast tRNAHis, and the dependence of those rates on concentration of enzyme or nucleotide, as appropriate for the step being investigated. To characterize adenylylation, we used an assay that measures protection of a labeled tRNA 5′-phosphate from removal by alkaline phosphatase, due to reaction at the 5′-end of the tRNA. After incubation of 5′-[32P] monophosphorylated tRNAHis (p*tRNAHis) substrate (≤ 40 nM) with ATP in the presence of excess yThg1, the amount of adenylylated tRNA (visualized as App*GpC) was quantified as a function of time (Fig. 2A). A slow rate of A−1 addition to the adenylylated tRNA was observed in the absence of the preferred GTP substrate for G−1 addition. The amount of this product (visualized as A−1p*GpC) was included in the total of adenylylated reaction product.
Figure 2. Single turnover measurement of adenylylation kinetics.

(A) Representative single turnover adenylylation reaction containing 3 μM yThg1, 1 mM ATP, and 5′-[32P]tRNAHis at pH 6.0. Reactions products (AppGpC and ApGpC) were resolved from Pi generated from unreacted tRNA by silica TLC. (B) Adenylylation catalyzed by 5 μM yThg1 with 1 mM ATP at 1.5 hr at the indicated pH (measured in tri-buffer Thg1 reaction system to span entire pH range). (C) Single turnover adenylylation enzyme titration reactions were carried out at pH 6 with 1 mM ATP, 5′-[32P] tRNAHis in the presence of 0.05 (■), 0.25 (△),0.6 (●), 1(◆), 3 (×), 5 (+), 10 (□), and 15 (○) μM yThg1. Observed rates (kobs) were determined by fit to eq.1. (D) Observed rates of adenylylation were plotted as a function of [E] and fit to equation 3 to determine the first-order adenylation rate constant (kaden) and apparent equilibrium dissociation constant (KD) for ptRNAHis.
Time courses of product formation fit well to a single exponential equation (eq. 1) (Fig. S1A), and were not dependent on order of mixing reactants or concentration of tRNA tested (data not shown). No lags in product formation were observed at any concentrations of enzyme or nucleotide cofactors tested, suggesting a rapid equilibrium mechanism, where the initial binding of enzyme and substrate is rapid, and dissociation of substrate is faster than the maximal rate kaden (koff >> kaden) (24, 25). Thus, dependence of kobs on the varied reactant (NTP or enzyme) reveals the apparent binding constant for NTP or tRNA, respectively, and the pseudo first-order maximal rate constant for each reaction (according to eq. 2 & 3). Saturating concentrations of the non-varied reactant were included in each assay. For each of the steps, the observed maximal rate constants (kaden, kntrans or kppase) may reflect the rate of the actual chemical step, or of a rate-determining conformational change that precedes chemistry. Identification of the precise nature of the rate-determining step requires further characterization.
At pH 7.5, the same pH used previously for determination of steady-state kinetic parameters for yThg1-catalyzed G−1 addition (18), observed rates of adenylylation did not saturate, but remained linearly dependent on [yThg1] even at the highest concentration of enzyme achievable in the assay, providing a lower limit to kaden and KD,apptRNA at pH 7.5 (Fig. S1B and Table 1). To address this limitation, the extent of adenylylation after 1.5 hour was investigated in the pH range 5.0-8.5, revealing a maximum amount of adenylylated product formed at pH 6.0 (Fig. 2B). At pH 6.0, observed rates of adenylylation exhibit the expected hyperbolic dependence on both enzyme and ATP concentration, and KD,app and kaden were determined at this pH (Fig. 2, Fig. S2 and Table 1). For both enzyme and ATP titration experiments, the measured kaden were in reasonable agreement (0.23 ± 0.01 min−1 and 0.45 ± 0.03 min−1, respectively).
Table 1.
Kinetic parameters for G−1 addition to tRNAHis catalyzed by yeast Thg1
| pH 6 | kmax (min−1) | KDapp,tRNA (μM) | kmax (min−1) | KDapp,NTP (μM) |
|---|---|---|---|---|
| adenylylation nucleotidyl transfer |
0.23 ± 0.01 0.20 ± 0.01 |
0.51 ± 0.09 1.3 ± 0.3 |
0.45 ± 0.03 0.24 ± 0.01 |
360 ± 80 16 ± 2 |
| pp-removal +GTP |
0.15 ± 0.01 | 0.4 ± 0.1 | N/A | N/A |
| pp-removal −GTP |
0.002-0.003a | < 5 b | N/A | N/A |
|
| ||||
| pH7.5 | kmax (min−1) | KDapp,tRNA (μM) | kmax (min−1) | KDapp,NTP (μM) |
|
| ||||
| adenylylation nucleotidyl transfer |
> 0.06 c 3.6 ± 0.3 |
> 15 d 7 ± 2 |
ND e 3.0 ± 0.1 |
ND e 21 ± 4 |
| pp-removal +GTP |
0.77 ± 0.04 | 2.5 ± 0.4 | N/A | N/A |
| pp-removal −GTP |
0.030 ± 0.003 | 1.6 ± 0.7 | N/A | N/A |
kmax(ppase) estimated based on values for kobs at the highest concentrations of enzyme tested (5-15 μM).
Upper limit for KD tRNA, based on saturation of kobs measured in assays with ≥ 5 μM yThg1.
Lower limit for kmax(aden) at pH 7.5 based on the kobs for adenylylation at the highest concentration of enzyme achievable in the assays (15 μM, see Fig. S1B).
Lower limit for KD tRNA based on the highest concentration of enzyme achievable in the assays.
ND, not determined
Single-turnover measurement of nucleotidyl transfer
Kinetic parameters for the second step, nucleotidyl transfer, were determined by reacting a 5′-[γ32P] triphosphorylated tRNAHis (p*pp-tRNAHis) substrate with GTP and enzyme, and quantifying release of labeled PPi following G−1 addition (Fig. 3). The faster steady-state kcat previously measured for reaction with ppp-tRNAHis compared with kcat for p-tRNAHis (16) suggests that the ppp-tRNAHis substrate is kinetically competent to mimic the nucleotidyl transfer step that occurs with App-tRNAHis during the physiological G−1 addition reaction (see Fig. 1), which we also confirmed below. All reactions contained limiting tRNA and saturating amounts of the non-varied reactant (250 μM GTP for enzyme titration and 15 μM yThg1 for GTP titration). As with adenylylation, time courses were well fit by the single exponential equation, no lags in product formation were observed, and kobs did not depend on order of mixing or concentration of tRNA (Fig. 3C and data not shown). Rates of nucleotidyl transfer (kobs) were measured at pH 6.0 and 7.5. In contrast to the adenylylation step, hyberbolic reaction kinetics were observed with respect to GTP (Fig. 3D and Fig. S3) and enzyme (data not shown) at both pH values, allowing for determination of pseudo-first order maximal rate constants (kntrans) and apparent dissociation constants (KDappGTP and KDapptRNA) (Table 1). kntrans was 10-fold faster at pH 7.5 (3.0 ± 0.1 min−1) than at pH 6.0 (0.24 ± 0.01 min−1) (Table 1). Similar kntrans values were also obtained regardless of whether enzyme or GTP was varied in the assay (Table 1).
Figure 3. Single turnover measurement of nucleotidyl transfer with ppptRNAHis.

(A) Nucleotidyl transfer assay scheme with 5′ ppp-tRNAHis labeled at the γ phosphate; addition of G−1 results in release of labeled PPi. (B) Representative single turnover nucleotidyl transfer assay containing 250μM GTP, 15 μM yThg1 and 5′ ppp -tRNAHis at pH 6, resolved by PEI cellulose TLC. (C) Single turnover nucleotidyl transfer GTP titration reaction pH 6, carried out with saturating yThg1 (15 μM) in the presence of 1 (◆), 3 (■), 5 (▲), 10 (×), 20 (+), 40 (△), 100 (●), 150 (□), and 175 (◇) μM GTP. Observed rate (kobs) were determined by fit to eq. 1. (D) Observed rates of nucleotidyl transfer were plotted as a function of [GTP] and fit to eq.2 to determine the first-order nucleotidyl transfer rate constant (kntrans ) and apparent equilibrium dissociation constant (KD) for GTP.
To further investigate the kinetic competence of ppp-tRNAHis as a mimic of the adenylylated tRNA intermediate, a pulse chase experiment was performed to directly measure the rate of nucleotide addition to App-tRNAHis. In this experiment, unlabeled ptRNAHis was incubated with [α32P]-ATP and excess yThg1 (15 μM), to yield Ap*p-tRNAHis with label in the AMP moiety (Fig 4A). A sufficient amount of time was allowed to accumulate maximal amounts of adenylylated tRNA, based on previous time courses. At this point (t = 0), a large excess of unlabeled ATP and GTP was added to the reactions. Reaction of GTP with the labeled Ap*ptRNA causes displacement, and hence loss of the radiolabel from the tRNA, while the ATP trapped any remaining unreacted p-tRNAHis, ensuring only pre-formed labeled Ap*ptRNAHis present at the time of the chase was observed in the assay. Time courses of loss of the radiolabel from the intermediate, normalized to the amount of activated tRNA present at the time of the chase were plotted and fit to single or double exponential rate equation.
Figure 4. Rate of nucleotidyl transfer of G−1 to adenylylated tRNA.

(A) Pulse chase reaction scheme. Formation of 5′-adenylylated tRNAHis labeled at the AMP α-phosphate is followed by addition of unlabeled GTP (substrate for nucleotidyl transfer) as well as excess unlabeled ATP to trap any remaining unreacted tRNA. Decay of radiolabeled tRNA corresponds to the rate of addition of G−1 to the adenylylated tRNA. (B) Observed rate of nucleotidyl transfer for reaction chased with 25 μM GTP and 50 μM ATP at pH 7.5 determined by fit to eq. 1. (C) Observed rate of nucleotidyl transfer for reaction chased with 250 μM GTP and 50 μM ATP at pH 6: both single exponential (eq. 1, R2 = 0.93, dashed line) and double exponential (eq. 5, R2 = 0.97, solid line) fits to the data are shown.
At pH 7.5, reactions chased with 25 μM GTP were fit well by a single exponential equation (eq. 1), yielding kobs = 1.3 ± 0.1 min−1 (Fig. 4B), in close agreement with the kobs (1.1 min−1) measured at the same concentration of GTP with the ppp-tRNAHis substrate (Fig. S3). At pH 6.0, reactions chased with 250 μM GTP can be fit with either single (kobs = 0.28 ± 0.04 min−1) or double exponential (kobs-fast = 0.78 ± 0.25 min−1 and kobs-slow = 0.044 ± 0.029 min−1) equations (eq. 5), with approximately equal amplitudes (45%) for each phase of the reaction (Fig. 4C). Although the R2 value for the fit to the double exponential equation is higher than for the fit to the single exponential (0.97 vs. 0.93), the larger uncertainty in the rate constants derived from the double exponential fit make it difficult to assess which fit better describes the observed data, thus both are shown. Observation of the double exponential behavior would suggest that at pH 6.0 there are two states, not in equilibrium with each other, which react with different rates. These data could be explained by a slow conformational change in the ES complex, followed by a fast step leading to formation of products, or two conformations of enzyme that react with differing rates to generate products; further experimental evidence is required to distinguish these possibilities. Nonetheless, whether the data reflect a single rate of reaction, or two, the rate of nucleotide addition to App-tRNAHis is still within reasonable agreement with the kobs of 0.21 min−1 measured at 250 μM GTP with the ppp-tRNAHis substrate (Fig. 3D). These data suggest that addition to ppp-tRNAHis occurs by the same mechanism as addition to the adenylylated tRNA and thus kinetic parameters obtained with ppp-tRNAHis are likely to reflect the same rate-determining step for the nucleotidyl transfer reaction, regardless of the identity of the activating group on the 5′-end of the tRNA substrate.
Pyrophosphate removal is stimulated by the addition of GTP
Kinetic parameters for the third step of G−1 addition, removal of pyrophosphate, were determined using a 5′-[γ32P] triphosphorylated p*ppG−1-containing tRNAHis transcript that mimics the product of the nucleotidyl transfer step formed by yThg1 (Fig. 5A). Reactions were performed under single turnover conditions with limiting tRNA, and the release of labeled pyrophosphate was observed as previously described. Time courses of pyrophosphate release were fit to a single exponential equation (eq. 1) to yield kobs, with no detectable lags in product formation at any concentration of yThg1 (data not shown). Saturation kinetics were observed at pH 7.5, and the pseudo-first order maximal rate constant (kppase) and KDapptRNA were determined using eq. 2 (Table 1). Although the observed rates of pyrophosphate removal measured at pH 6 did not change significantly between 5-15 μM enzyme (kobs = 0.002-0.003 min−1), these rates were too slow for determination of KDapp tRNA (data not shown). Therefore we estimate KDapp tRNA (pH 6) to be < 5 μM (Table 1).
Figure 5. Rate of pyrophosphate removal from the G−1-containing tRNA.

(A) Reaction scheme for assay of diphosphatase activity using γ-32P labeled pppG−1-tRNAHis; removal of labeled PPi is measured using PEI-cellulose TLC. (B) Single-turnover measurement of kppase and KD,apptRNA at pH 7.5, determined by fit of the data to eq. 3.
The removal of pyrophosphate does not necessarily require participation of an NTP substrate (Fig. 1 and Fig. 5A). However, in the presence of saturating enzyme and 1 mM GTP, the observed rates of pyrophosphate removal were measureably enhanced. kppase was stimulated 30 fold at pH 7.5 (kppase = 0.77 ± 0.04 min−1) and 80 fold at pH 6.0 (kppase = 0.15 ± 0.01 min−1) (Table 1). It is unlikely that the stimulation results from addition of further GTP nucleotides to the pppG−1-tRNA (to yield G−2-containing tRNA), which would similarly cause release of labeled PPi in reactions, since G−2 addition does not occur at significant levels with the wild-type (A73-containing) tRNAHis used in these assays (18). Similar amplitudes are observed (maximum 80-85% PPi released) for reactions in the presence and absence of nucleotide, suggesting that the increase in kppase is not attributable to −1 addition to significant amounts of aberrantly G+1-initiated substrate that may have arisen during in vitro transcription. Previously reported steadystate kinetic parameters for the overall G−1 addition reaction were determined in the presence of similarly high concentrations of GTP (16), suggesting that the kppase measured in the presence of GTP reflects the rate of this step during the multiple-turnover reaction.
Application of kinetic framework to identify catalytic residues that participate in G−1 addition
yThg1 and human Thg1 (hThg1) share significant (69 %) sequence similarity, including conservation of all 19 residues implicated as important for G−1 addition activity in the earlier alanine scanning mutagenesis (23). Therefore, using the hThg1 crystal structure in conjunction with our kinetic framework for yThg1 activity, we investigated how highly-conserved yThg1 residues are involved in the catalytic mechanism of G−1 addition. Despite the recent availability of a Thg1 structure, questions remain about the mechanism that are not fully addressed by the structural data, particularly since the current structure lacks bound tRNA (and thus any information about tRNA recognition). In addition, the involvement of multiple nucleotides in different ways for each step of the G−1 addition reaction makes it difficult to unambiguously assign identities to the bound nucleotides visualized in the structure. Finally, since the available structural data are for the hThg1 enzyme, while the kinetic analysis was performed with yThg1, the possibility must be addressed that residues implicated by the structure in catalysis may not function similarly in the context of these two different, albeit highly homologous, enzymes. Thus, the need for detailed kinetic investigation of the three steps of the G−1 addition reaction to test roles for residues predicted by the structure is clear.
Our kinetic analysis indicates that kntrans and kppase increase from pH 6.0 to pH 7.5 while kaden decreases across this range (Table 1). These data imply that different ionization events may be important for the different chemical steps of the reaction, suggesting the possibility that independently functioning amino acid residues may be identified. Using the biochemical assays described previously, under optimal conditions for each step, we measured transient kinetic parameters for nine yThg1 alanine variants chosen due to their location near the bound nucleotides revealed by the crystal structure (R27A, D29A, K44A, S76A, D77A, E78A, K96A, R133A and N161A) (Fig. 6) (20). All of these yThg1 variants with the exception of S76A were previously tested and shown to exhibit significant reductions in overall specific activity of G−1 addition (20, 23). S76A was also chosen for further study because the analogous alteration in hThg1 (S75A) affected adenylylation during analysis of the hThg1 crystal structure (20). Numbering of residues throughout is according to positions in the yeast sequence, with the equivalent residue in hThg1 indicated by parentheses, if different from the yeast residue numbering. Analysis of kinetic parameters for these variants in conjunction with the structural data has enabled us to assign functional roles for these highly conserved Thg1 residues.
Figure 6. Catalytic residues in the human Thg1 active site.
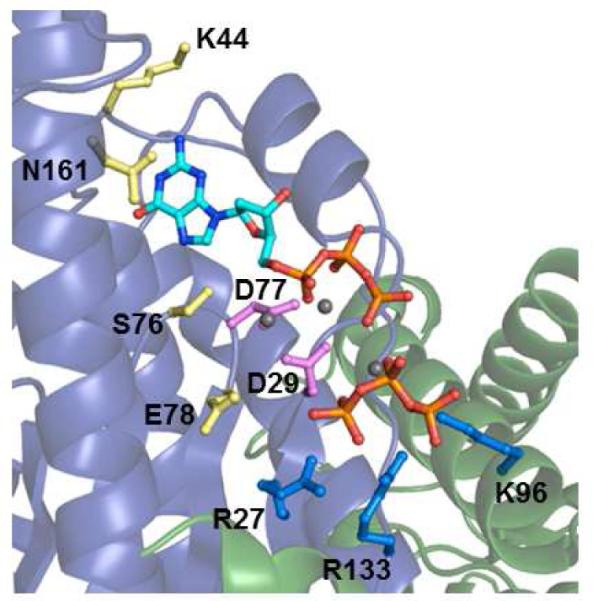
A view of the hThg1 active site containing two bound dGTP molecules (for the second bound dGTP, only the triphosphate moiety is visible in the electron density map) (20), with residues investigated in this study highlighted. Numbering is according to the yThg1 residue position. Each residue side chain is colored according to the kinetic effects observed here. Yellow residues are those with more significant defects in adenylylation kinetics (K44, S75, E78 and N161); blue residues are those with the most severe defects in nucleotidyl transfer kinetics (R27, K96 and R133). The two metal-ion binding carboxylates (D29 and D77) that are critical for all three chemical steps of the yThg1 reaction are highlighted in magenta.
Two metal-ion catalysis may be used for all three chemical steps of G−1 addition
In the hThg1 crystal structure, D29 and D76(D77) coordinate two metal ions believed to be important for catalysis, and are located in analogous positions to two highly conserved carboxylate residues (D475 and D654 in T7 DNA Pol) important for 5′-3′ addition by family A DNA polymerases (20, 26, 27). The two aspartates are critical for the overall G−1 addition reaction, as indicated by the severe defects in specific activity upon alteration to alanine in either yeast or human Thg1 (20, 23). Transient kinetic measurements revealed severe reductions in kobs for all three chemical steps for the yThg1 D29A and D77A variant enzymes (Table 2). Between these two variants, the only step for which detectable rates could be measured was for nucleotidyl transfer catalyzed by D77A yThg1. Importantly, while kntrans for the D77A variant was reduced by 30,000-fold as compared to wild type, KDappGTP was relatively unaffected (Table 2). These data strongly suggest that D76 and D77, and likely the two metal ions coordinated by these residues, participate in the rate determining process for each of the three chemical steps of the 3′-5′ addition reaction catalyzed by yThg1. Moreover, at least for the D77A variant, the similar KD for the GTP nucleotide suggests that the alteration has not significantly perturbed the global protein structure, and the kinetic effects of these changes reflect changes in catalytic activity, not structure, of the variant enzyme. Due to the undetectable rates of reaction exhibited in most assays with these variants even at enzyme concentrations that are saturating for the wild-type enzyme (15 μM), we note that potential tRNA binding defects could also contribute to the decreased catalysis observed upon alteration of the metal-binding carboxylates.
Table 2.
Kinetic parameters for G−1 addition catalyzed by yeast Thg1 alanine variantsa
| adenylylation | nucleotidyl transfer | ppase | |||||
|---|---|---|---|---|---|---|---|
| kaden (min−1) | KDapp,ATP (μM) | kaden/KD (μM−1 min−1) |
kntrans (min−1) | KDapp,GTP (μM) |
kntrans/KD (μM−1 min−1) |
kobs (min−1) | |
| WT | 0.45 ± 0.03 | 360 ± 80 | 1.3 ± 0.3 × 10⁻³ | 3.0 ± 0.2 | 25 ± 6 | 0.12 ± 0.03 | 0.027 ± 0.001 |
|
| |||||||
| D29A | UDb | UD | UD | UD | UD | UD | UD |
| D77A | UD | UD | UD | 1.1 ± 0.1 × 10⁻⁴ c | 11 ± 4 | 1.0 ± 0.4 × 10⁻⁵ | UD |
| E78A | UD | UD | UD | 0.16 ± 0.02 | 216 ± 74 | 7 ± 3 × 10⁻⁴ | 5.2 ± 0.2 × 10⁻⁴ c |
|
| |||||||
| K44A | 2.7 ± 0.5 × 10⁻³ c | 4000 ± 1000 | 7 ± 2 × 10⁻⁷ | 0.45 ± 0.05 | 23 ± 9 | 0.020 ± 0.008 | 0.028 ± 0.003 |
| N161A | 5.4 ± 0.6×10⁻³ c | 1400 ± 400 | 4 ± 1 × 10⁻⁶ | 1.2 ± 0.1 | 34 ± 8 | 0.034 ± 0.008 | 0.009 ± 0.001 |
| S76A | ~0.03 d | < 3000 e | > 1 × 10⁻⁵ | 1.0 ± 0.1 | 45 ± 12 | 0.023 ± 0.006 | 0.015 ± 0.001 |
|
| |||||||
| R27A | 8.4 ± 0.7 × 10⁻⁴ c | 300 ± 100 | 3 ± 1 × 10⁻⁶ | 5.8 ± 0.4 × 10⁻⁴ c | 230 ± 60 | 2.5 ± 0.7 × 10⁻⁶ | 0.016 ± 0.001 |
| R133A | 1.8 ± 0.9 × 10⁻³ c | 170 ± 40 | 1.1 ± 0.6 × 10⁻⁵ | 3.8 ± 0.3 × 10⁻⁴ c | 85 ± 30 | 4.5 ± 2 × 10⁻⁶ | 0.025 ± 0.001 |
| K96A | 2.3 ± 0.9 × 10⁻³ c | 320 ± 50 | 7.2 ± 3 × 10⁻⁶ | 8.6 ± 0.7 × 10⁻³ c | 240 ± 70 | 4 ± 1 × 10⁻⁵ | 0.016 ± 0.001 |
Kinetic parameters for alanine variants were measured at optimal pH values for each step of the G−1addition reaction in the presence of a saturating concentration of enzyme (15 μM) with respect to wild-type yeast Thg1. Adenylylation reactions were at pH 6 in the presence of varied [ATP] (0.075-5 mM). Nucleotidyl transfer reactions were at pH 7.5 in the presence of varied [GTP] (0.005-2 mM). Time courses of pyrophosphate removal were at pH 7.5 in the absence of GTP and the reported kobs are the average of two independent measurements.
UD, product formation was not detected above background after 4 hours.
kmax values derived from observed rates determined using the method of initial rates.
Estimate for kaden based on similar kobs measured in reactions with ≥3 mM ATP.
Upper limit to KDATP determined from the lowest [ATP] that yielded maximal kobs for the reaction.
A third carboxylate, E78(E77), is located at a position in the structure analogous to the position of the highly conserved E655 in T7 DNA Pol (20, 27). In both hThg1 and T7 Pol the glutamate side chain points away from the metals (Fig. 6). As with E655 in T7 DNA Pol, alteration of E78(E77) to alanine causes only minor defects in catalysis in hThg1; however the E78A alteration in yeast Thg1 causes severe defects in G−1 addition, both in vitro and in vivo in yeast (20, 23, 28). From analysis of the three steps, the source of the E78A defect in yThg1 can be substantially attributed to the adenylylation step, which is affected by at least 4000-fold, as compared to the relatively moderate effects on the rates of nucleotidyl transfer and pyrophosphate removal (20- and 60-fold decreased, respectively) (Table 2 and Fig. 7). These data suggest a difference between the requirement for the third carboxylate residue between yeast and human Thg1 that is directly related to a difference in the adenylylation step of the reaction, which could include differences in the rate-determining step for chemistry, or binding of tRNA or nucleotide substrates.
Figure 7. Effects on adenylylation, nucleotidyl transfer and pyrophosphate removal caused by yThg1 alanine alterations.
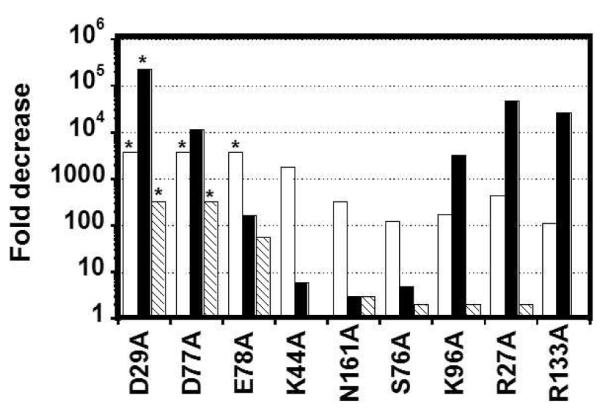
For each variant, the fold decrease in activity was calculated by determining the ratio of the measured activities of wild-type to that of the indicated yThg1 variant enzyme. For adenylylation (open bars) and nucleotidyl transfer (solid bars), the indicated value is the fold decrease in the overall catalytic efficiency, as reflected by the (kmax/KDappNTPWT)/(kmax/KDappNTPmut) measured for each step under the conditions defined in Table 2. For pyrophosphate removal (hatched bars), the fold decrease caused by the alanine alteration was determined by the comparison of kobs for wild-type vs. each variant, measured with 15 μM yThg1 at pH 7.5. Values indicated with (*) represent the lower limit to the fold decrease calculated for variants that exhibit undetectable levels of activity under the conditions of the assay.
K44 and N161 participate in the adenylylation step
Previously, we implicated S76(S75) of hThg1 in adenylylation, and on this basis proposed that one of the bound nucleotides observed in the hThg1 structure mimics the position of the ATP used for activation of the tRNA. In the hThg1 structure, S76(S75) makes a direct contact with N7 of the bound dGTP, and alteration of the serine to alanine in the human enzyme causes a 10-fold increase in KDappATP (20). As with hThg1, alteration of the analogous serine residue (S76) in yThg1 to alanine causes a significant defect in adenylylation, while the kinetics for nucleotidyl transfer and pyrophosphate removal remain relatively unchanged (Table 2). We identified two additional residues, K44 and N161, which, unlike S76(S75), are not observed to make direct contacts to the bound nucleotide base in the hThg1 structure, but are located nearby (Fig. 6). K44 resides on a loop ~5 Å away from the bound nucleotide, and N161 is located on an alpha helical region ~ 8 Å away from the nucleotide. The measured catalytic efficiencies for the adenylylation step, as reflected by kaden/KDappATP, for K44A and N161A are reduced by 2000- and 300-fold respectively, while kntrans/KDappGTP and kobs for pyrophosphate removal are only modestly affected (< 10 fold) as compared to wild type (Table 2, Fig. 6). To ensure that defects in tRNA binding are not responsible for the substantial decrease in the maximal rate constant for adenylylation, we measured kobs for each variant with saturating [ATP] at several high concentrations of Thg1 (15-30 μM). At all concentrations, the measured rates did not vary significantly, indicating that KDapp,tRNA is not substantially affected by these alterations (data not shown). Moreover, for each of these variants, the relatively unaffected rate of pyrophosphate removal suggests that the overall protein fold remains intact in each variant, and as above, the observed kinetic effects reflect changes in groups that actively participate in catalysis.
The yThg1 S76A variant displayed distinct kinetic behavior for the adenylylation step. In time courses kobs did not change significantly between 0.075-5 mM ATP (the measured kobs varied between 0.02 - 0.03 min−1). However, in the lower part of this ATP concentration range (0.075-3 mM), the amplitude of total reaction products increased from 7% to 63%, until maximal product amplitudes (62-63%) were reached for ATP concentrations above 3 mM (Fig. S4A). Amplitudes of reaction products in nucleotidyl transfer experiments for S76A yThg1 reached the same maximal values at all GTP concentrations tested, and catalytic efficiency for this step (kntrans/KDappGTP) was only reduced by 5 fold (Fig. S4B and Table 2). Therefore these kinetic effects are specific to adenylylation. Since the amplitude of the single-turnover time course reflects the amount of convertible tRNA substrate in each reaction, a likely interpretation of these data is that, at low concentrations of ATP, lack of the S76 hydroxyl-containing side chain promotes an alternative catalytically inactive conformation of tRNA-bound enzyme to accumulate, and addition of sufficiently high ATP concentrations are needed to overcome the inactive conformation. These data provide further evidence that different modes of nucleotide binding occur within the Thg1 active site and can affect the reactivity of the enzyme, also consistent with the unexpected role we observed for GTP in stimulating removal of pyrophosphate (Table 1).
A second bound nucleotide appears to represent the position of the incoming GTP for nucleotidyl transfer
For yThg1 variants R27A, K96A, and R133A there is a 100-450 fold reduction in overall catalytic efficiency for adenylylation (as represented by kaden/KDappATP) (Table 2 and Fig. 7). However, the catalytic efficiency of nucleotidyl transfer is reduced much more substantially, with kntrans/KDappGTP decreased by 3,000-50,000-fold (Fig. 7). As with the adenylylation defective variants described above (K44A, N161A, S76A), the observed rate of pyrophosphate removal is minimally affected by these alterations, suggesting that the global enzyme fold is not altered significantly by the alterations (Table 2).
Since these highly conserved lysine and arginine residues could potentially interact with negatively charged backbone residues of the tRNAHis substrate, we tested whether defects in tRNA binding caused by these alterations may contribute to the observed decreases in adenylylation or nucleotidyl transfer. Although the slow rates make it difficult to directly measure KD values for tRNA, we tested whether the observed maximal rate constants were saturating for tRNA by measuring kobs for each reaction at several high concentrations of Thg1 (10-20 μM) and saturating concentrations of NTP. For the R133A variant, observed maximal rates of adenylylation and nucleotidyl transfer did not depend on the concentration of Thg1 at ≥ 15 μM enzyme in the assays, suggesting that KD,apptRNA is not substantially altered from wild-type with this variant (data not shown). For R27A, the rate of adenylylation is similarly insensitive to changes in enzyme concentration, but kobs for nucleotidyl transfer increases across this concentration range, suggesting that saturation for tRNA binding has been achieved for adenylylation, but potentially not for nucleotidyl transfer (data not shown). While there may be some defect in tRNA binding associated with the R27A alteration, the fact that this defect is specific to only the nucleotidyl transfer step (and not adenylylation or pyrophosphate removal) argues that the alteration does not cause a global change in tRNA recognition or binding, and reinforces our observation that this residue exerts its primary function during nucleotidyl transfer. For the K96A alteration, kobs for both adenylylation and nucleotidyl transfer increase across the 10-20 μM concentration range tested, suggesting that defects in tRNA binding may contribute significantly to the decreased catalytic efficiencies measured for this variant. Again, the relatively unaffected rate of pyrophosphate removal indicates that tRNA binding is not generally defective with the K96A variant. Further investigations of tRNA binding will be required to address these possibilities directly. We note that although adenylylation is certainly less efficiently catalyzed by all three variants, the decreases are entirely attributed to a decrease in the rate determining step for chemistry (which may include changes in positioning of the tRNA substrate that affect reactivity), with little change in the binding affinity for the activating ATP (Table 2).
Taken together, these data reveal that R27, K96 and R133 exhibit a major role in nucleotidyl transfer. The decrease in catalytic efficiency for nucleotidyl transfer is driven by both a substantial decrease in kntrans and a 3-10 fold increase in KDappGTP, suggesting that these residues play important roles both in binding the GTP to be added in the 3′-5′ addition reaction, and in the rate determining step for chemistry, which may include positioning of the tRNA substrate for catalysis. In the hThg1 crystal structure, R27, K96(K95), and R133(R131) make direct contacts with the triphosphate of a second bound dGTP in the Thg1 active site (Fig. 6) (20). The position of the base and sugar of the second dGTP cannot be determined due to lack of density observed for the rest of this nucleotide in the hThg1 structure, and therefore the orientation of the 3′-OH that would act as the nucleophile for the 3′-5′ addition step, relative to the metal ions, remains to be determined. Nevertheless, our kinetic data suggest that the triphosphate moiety captured in the hThg1 structure may represent the position of the incoming GTP used for addition.
DISCUSSION
The recently available crystal structure of human Thg1 provided the long-awaited opportunity to investigate the molecular mechanism of the unusual 3′-5′ nucleotide addition reaction catalyzed by Thg1 enzymes. Yet, even with this structural data, many questions remain unanswered regarding roles of Thg1 residues in the individual steps of 3′-5′ nucleotide addition, and there is a clear need for a detailed kinetic analysis to address these questions in light of the ambiguity of the structural data. In this study, we used single turnover kinetics to individually probe the three known chemical steps of the eukaryotic tRNAHis G−1 addition reaction (Fig. 1-5 and Table 1). Using the kinetic framework we established, we provide support for the proposed position of the 5′-end activating ATP nucleotide (Table 2 and Fig. 6 and Fig. 7). We also identify previously unknown roles for Thg1 active site residues in the nucleotidyl transfer and pyrophosphate removal steps of the G−1 addition reaction. These include a critical role for the two metal-coordinating carboxylate residues in all three chemical steps of G−1 addition, and the likely role of 3 highly conserved positively charged residues in the nucleotidyl transfer step of the reaction, possibly through positioning the incoming NTP to be added to the 5′- end of the polynucleotide chain. Our data provide insight into the mechanism of 3′-5′ addition catalyzed by Thg1, and are the foundation for investigating additional 3′-5′ addition activities catalyzed by other Thg1 family enzymes, including tRNA editing and repair reactions.
The crystal structure of hThg1 revealed a βαββαβ motif structurally homologous to the palm domain found in A-family DNA polymerases (i.e. T7 DNA pol) (20, 27). As observed for A-family DNA polymerases, present within this motif are two divalent metal ions coordinated by two highly conserved aspartate residues (D29 and D76) in a bidentate manner (Fig. 6). Interestingly, in addition to the 3′-5′ nucleotidyl transfer reaction (Fig. 1) that is most analogous to canonical polymerase chemistry, the kinetic data support the hypothesis that the two metal ions are also used by Thg1 to catalyze the adenylylation step and removal of pyrophosphate during G−1 addition, based on the deleterious effects of mutation of the metal-coordinating aspartates on all three steps of the reaction. Further analysis will be required to decisively demonstrate the catalytic role of the two metal ions. Parallels may be drawn between the predicted use of a two metal-ion active site to catalyze different chemical transformations by Thg1 and the distinct nucleotide addition and proofreading exonuclease activities proposed to occur within a single two-metal-ion active site in some RNA polymerases (29). However, unlike for RNA polymerases, where the exonuclease activity is the reverse of the addition reaction, the orientation of substrates and reactive phosphates with respect to the two metal ions is predictably different for each of the different steps of G−1 addition by Thg1. Therefore conformational changes during the course of the reaction are necessarily expected to occur, just as are observed for canonical 5′-3′ polymerases (30-33).
In the hThg1 structure, both metals contact the bound nucleotide proposed to mimic the position of the activating ATP (20). Though activation of the nucleophilic 5′ terminal phosphate of the tRNA may not be required for attack on the α-phosphate of the ATP, by analogy to canonical polymerases it is possible that metal A may serve this function in addition to stabilizing the pentacovalent transition state, while metal B participates in transition state stabilization and promotes the pyrophosphate leaving group (21). The adenylylation step of 3′-5′ nucleotide addition strongly resembles the activation step of a ligation reaction catalyzed by DNA/RNA ligases. Though ligases require divalent cations for catalysis and two divalent metals are seen in the T4 RNA ligase active site, mutational analysis of the metal binding residues argues against a classical two-metal-ion mechanism as with polymerases (34). Furthermore, under the reaction conditions used in our assays, formation of a covalent AMP-enzyme intermediate, a shared mechanistic feature among all known covalent nucleotidyl transferase enzymes (i.e ligase and mRNA capping enzymes) is not observed (35-37). Therefore Thg1 is to our knowledge the only enzyme which appears to utilize a two-metal-ion mechanism to catalyze the activation of the 5′-terminal phosphate of a polynucleotide chain via formation of a 5′-5′ phosphoanhydride bond.
Notably, for several variants, substantial defects in the maximal pseudo-first order rate constants were observed upon alteration of the side chain to alanine (Table 2), despite the fact that direct roles in the chemistry of the reaction are not obvious from the currently available structural data. For example, the R27, R133 and K96 residues implicated in the nucleotidyl transfer step are all observed to bind the triphosphate moiety of the second bound nucleotide (Fig. 6), whereas the 3′-hydroxyl of this nucleotide (not visible in the existing hThg1 structure) is the reactive group for this step. Additionally, the observation of smaller but significant defects in kaden for the R27, R133 and K96 variants supports the idea that the overall organization of the Thg1 active site, including positioning the reactive tRNA substrate, is important for efficient catalysis, yet no structural data are available to indicate the position of bound tRNA in the active complex for catalysis. Similarly, K44 and N161 exhibit strong defects in adenylylation (Fig. 7), but in the current structure, are not close enough to make direct contacts with the bound nucleotide that mimics the activating ATP (Fig. 6). In the absence of structures that provide insight into the multiple distinct steps that occur during 3′-5′ addition, the kinetic data are essential to understanding the mechanism of this unusual reaction. Furthermore, although the nature of the rate-determining step for kmax for each of the three steps is not yet known, these observations strongly support the idea that the measured kmax values may reflect rate-determining conformational rearrangements necessary for catalysis, instead of the rates of the actual chemical steps.
The kinetic data suggest that the active site metals may participate in the removal of pyrophosphate from the 5′-end of the G−1 containing tRNA (Table 2 and Fig. 7), presumably by activating a nucleophilic water molecule. This reaction is similar to the divalent cation-dependent hydrolysis reaction catalyzed by the bacterial pyrophosphohydrolase RppH which hydrolyzes pyrophosphate from the 5′-triphosphate of mRNAs in prokaryotes, initiating mRNA decay (38, 39). RppH belongs to the Nudix superfamily which includes orthologs in eukaryotes (Dcp2) that catalyze decapping of deadenylylated mRNAs (40). Mechanisms proposed for Nudix enzymes implicate a protein side chain as a general base in the deprotonation of a metal-activated water for the hydrolysis reaction. Our mutational analysis has not thus far revealed evidence for a general base that could participate in this step of the G−1 addition reaction. Alternatively in the absence of a general base, the water nucleophile may be coordinated by metal A and the tRNA. The possibility that metal A alone may be sufficient for this step of the 3′-5′ addition reaction is precedented by the ribonuclease RNase H, where, in addition to metal A, the proposed nucleophilic water is coordinated by the nonbridging oxygen of the phosphate 3′ to the scissile bond of the nucleic acid substrate (41, 42). However, in the absence of structural information to define the orientation of tRNA in the active site, the orientation of the metals with respect to the 5′-end of the tRNA remains uncertain, and moreover, may change during the course of the reaction cycle.
Comparison of steady state and single-turnover kinetic parameters show that kaden is the slowest of the three chemical steps measured here at pH 7.5, and the lower limit to this rate constant observed here (> 0.06 min−1) is not substantially different from the measured kcat for p-tRNAHis (0.012 min−1) previously determined at the same pH (16). Therefore adenylylation may be the rate determining step for yThg1-catalyzed G−1 addition to p-tRNAHis at pH 7.5 under multiple turnover conditions. Since the adenylylation step is bypassed by the use of ppp-tRNA (Fig. 1B), a different step must be rate-determining for multiple turnover G−1 addition with this substrate, but the identity of that step cannot be determined from these data. The previously measured steady-state kcat at pH 7.5 (0.14 min−1) is significantly slower than kntrans and kppase measured in the presence of GTP, suggesting neither of these are rate limiting (Table 1). Therefore kcat for addition to ppp-tRNAHis may reflect either a rate limiting conformational change not detectable with our single turnover assays, or perhaps product release.
This study provides the first kinetic insight into the individual steps of the non-WC G−1 addition reaction to tRNAHis, the known physiological function of Thg1 in yeast. Yet Thg1 family enzymes are implicated in additional activities, including tRNA 5′-editing and tRNA repair (13, 19). These functions require Thg1 to take advantage of its unique ability to catalyze a second, distinct, 3′-5′ polymerase activity. The WC addition activity of Thg1, first discovered in yeast using tRNAHis variant substrates but now shown to be a fundamental property of all Thg1 family enzymes (14, 18), is the reverse reaction of the canonical 5′-3′ nucleic acid synthesis reactions catalyzed by all known DNA/RNA polymerases.
The 3′-5′ polymerase activity imposes additional requirements on the Thg1 mechanism that are potentially distinct from those studied here for the non-WC tRNAHis maturation reaction. For instance, rather than removing pyrophosphate from a 5′ pppG−1:C73 WC base pair created by addition of the first G−1 nucleotide during 3′-5′ polymerization, yThg1 utilizes the activated 5′-triphosphorylated end generated by the addition of the G−1 nucleotide for subsequent addition reactions (18). Thus, efficient removal of the pyrophosphate would predictably impede the polymerase reaction, and the mechanistic basis for this difference is unknown. Likewise, since 3′-5′ polymerization does not require re-activation of the 5′-end during multiple rounds of nucleotide addition, the mechanism of the adenylylation reaction may differ for TLPs (from archaea and bacteria) that only carry out WC-dependent polymerase activities as compared with the eukaryotic Thg1 enzymes investigated in this study (13, 14).
Interestingly, in contrast to yThg1, hThg1 contains a putative N-terminal mitochondrial targeting peptide and mitochondrial tRNAHis lacks genomically encoded G−1 and contains a C73. Consequently, it is likely that human Thg1 catalyzes both non-WC addition to cytosolic A73 containing tRNAHis and templated G−1 addition to mitochondrial C73 containing tRNAHis substrates in vivo, raising the question of whether hThg1 adds multiple G residues to mito-C73 tRNAHis in vivo? Further studies will be needed to determine the mechanistic differences, if any, that exist between Thg1 orthologs causing these enzymes to avoid polymerizing multiple G residues to the 5′-end of the tRNA. This question is especially intriguing when considering TLPs from other organisms which have roles in tRNA repair and editing that require multiple addition reactions to C73 containing tRNAHis and other tRNA substrates in vivo.
Supplementary Material
ACKNOWLEDGEMENT
We are grateful to Sam Hyde and Sylvie Doublié for helpful discussions and assistance with preparation of the hThg1 structure figure, and Bhalchandra Rao for comments and help with preparation of the manuscript.
Footnotes
This research was supported by NIH grant GM08543 (to J.E.J.).
List of abbreviations HisRS, histidyl-tRNA synthetase Thg1, tRNAHis guanylyltransferase TLPs, Thg1-like proteins p-tRNAHis, 5′ monophosphorylated tRNAHis ppp-tRNAHis, 5′ triphosphorylated tRNAHis WC, Watson-Crick DTT, dithiothreitol EDTA, ethylenediamine tetraacetic acid HEPES, 4-2-hydroxyethyl-1-piperazineethanesulfonic acid Bis-Tris, [Bis-(2-hydroxyethyl)-amino]-2-hydroxymethyl-propane-1,3-diol Tris, 2-Amino-2-hydroxymethyl-propane-1,3-diol RNase A, ribonuclease A
SUPPORTING INFORMATION PARAGRAPH Adenylylation kinetics demonstrating [yThg1] dependence at pH 7.5 (Figure S1) and [ATP] dependence at pH 6.0 (Figure S2), nucleotidyl transfer kinetics for [GTP] dependence at pH 7.5 (Figure S3) and kinetic analysis of the S76A yThg1 variant (Figure S4). This material is available free of charge via the Internet at http://pubs.acs.org.
REFERENCES
- 1.Giege R, Sissler M, Florentz C. Universal rules and idiosyncratic features in tRNA identity. Nucleic Acids Res. 1998;26:5017–5035. doi: 10.1093/nar/26.22.5017. [DOI] [PMC free article] [PubMed] [Google Scholar]
- 2.Nameki N, Asahara H, Shimizu M, Okada N, Himeno H. Identity elements of Saccharomyces cerevisiae tRNA(His) Nucleic Acids Res. 1995;23:389–394. doi: 10.1093/nar/23.3.389. [DOI] [PMC free article] [PubMed] [Google Scholar]
- 3.Rudinger J, Felden B, Florentz C, Giege R. Strategy for RNA recognition by yeast histidyl-tRNA synthetase. Bioorg Med Chem. 1997;5:1001–1009. doi: 10.1016/s0968-0896(97)00061-8. [DOI] [PubMed] [Google Scholar]
- 4.Rudinger J, Florentz C, Giege R. Histidylation by yeast HisRS of tRNA or tRNA-like structure relies on residues −1 and 73 but is dependent on the RNA context. Nucleic Acids Res. 1994;22:5031–5037. doi: 10.1093/nar/22.23.5031. [DOI] [PMC free article] [PubMed] [Google Scholar]
- 5.Himeno H, Hasegawa T, Ueda T, Watanabe K, Miura K, Shimizu M. Role of the extra G-C pair at the end of the acceptor stem of tRNA(His) in aminoacylation. Nucleic Acids Res. 1989;17:7855–7863. doi: 10.1093/nar/17.19.7855. [DOI] [PMC free article] [PubMed] [Google Scholar]
- 6.Rosen AE, Brooks BS, Guth E, Francklyn CS, Musier-Forsyth K. Evolutionary conservation of a functionally important backbone phosphate group critical for aminoacylation of histidine tRNAs. RNA. 2006;12:1315–1322. doi: 10.1261/rna.78606. [DOI] [PMC free article] [PubMed] [Google Scholar]
- 7.Rosen AE, Musier-Forsyth K. Recognition of G-1:C73 atomic groups by Escherichia coli histidyl-tRNA synthetase. J Am Chem Soc. 2004;126:64–65. doi: 10.1021/ja0381609. [DOI] [PubMed] [Google Scholar]
- 8.Orellana O, Cooley L, Soll D. The additional guanylate at the 5′ terminus of Escherichia coli tRNAHis is the result of unusual processing by RNase P. Mol Cell Biol. 1986;6:525–529. doi: 10.1128/mcb.6.2.525. [DOI] [PMC free article] [PubMed] [Google Scholar]
- 9.Cooley L, Appel B, Soll D. Post-transcriptional nucleotide addition is responsible for the formation of the 5′ terminus of histidine tRNA. Proc Natl Acad Sci U S A. 1982;79:6475–6479. doi: 10.1073/pnas.79.21.6475. [DOI] [PMC free article] [PubMed] [Google Scholar]
- 10.Gu W, Jackman JE, Lohan AJ, Gray MW, Phizicky EM. tRNAHis maturation: an essential yeast protein catalyzes addition of a guanine nucleotide to the 5′ end of tRNAHis. Genes & Development. 2003;17:2889–2901. doi: 10.1101/gad.1148603. [DOI] [PMC free article] [PubMed] [Google Scholar]
- 11.Gu W, Hurto RL, Hopper AK, Grayhack EJ, Phizicky EM. Depletion of Saccharomyces cerevisiae tRNA(His) guanylyltransferase Thg1p leads to uncharged tRNAHis with additional m(5)C. Mol Cell Biol. 2005;25:8191–8201. doi: 10.1128/MCB.25.18.8191-8201.2005. [DOI] [PMC free article] [PubMed] [Google Scholar]
- 12.Preston MA, Phizicky EM. The requirement for the highly conserved G-1 residue of Saccharomyces cerevisiae tRNAHis can be circumvented by overexpression of tRNAHis and its synthetase. RNA. 2010;16:1068–1077. doi: 10.1261/rna.2087510. [DOI] [PMC free article] [PubMed] [Google Scholar]
- 13.Rao BS, Maris EL, Jackman JE. tRNA 5′-end repair activities of tRNAHis guanylyltransferase (Thg1)-like proteins from Bacteria and Archaea. Nucleic Acids Res. 2011;39:1833–1842. doi: 10.1093/nar/gkq976. [DOI] [PMC free article] [PubMed] [Google Scholar]
- 14.Abad MG, Rao BS, Jackman JE. Template-dependent 3′-5′ nucleotide addition is a shared feature of tRNAHis guanylyltransferase enzymes from multiple domains of life. Proceedings of the National Academy of Sciences. 2010;107:674–679. doi: 10.1073/pnas.0910961107. [DOI] [PMC free article] [PubMed] [Google Scholar]
- 15.Heinemann IU, Randau L, Tomko RJ, Jr., Soll D. 3′-5′ tRNAHis guanylyltransferase in bacteria. FEBS Lett. 2010;584:3567–3572. doi: 10.1016/j.febslet.2010.07.023. [DOI] [PMC free article] [PubMed] [Google Scholar]
- 16.Jackman JE, Phizicky EM. tRNAHis guanylyltransferase adds G-1 to the 5′ end of tRNAHis by recognition of the anticodon, one of several features unexpectedly shared with tRNA synthetases. Rna. 2006;12:1007–1014. doi: 10.1261/rna.54706. [DOI] [PMC free article] [PubMed] [Google Scholar]
- 17.Jahn D, Pande S. Histidine tRNA guanylyltransferase from Saccharomyces cerevisiae. II. Catalytic mechanism. J Biol Chem. 1991;266:22832–22836. [PubMed] [Google Scholar]
- 18.Jackman JE, Phizicky EM. tRNAHis guanylyltransferase catalyzes a 3′-5′ polymerization reaction that is distinct from G-1 addition. Proc Natl Acad Sci U S A. 2006;103:8640–8645. doi: 10.1073/pnas.0603068103. [DOI] [PMC free article] [PubMed] [Google Scholar]
- 19.Abad MG, Long Y, Willcox A, Gott JM, Gray MW, Jackman JE. A role for tRNA(His) guanylyltransferase (Thg1)-like proteins from Dictyostelium discoideum in mitochondrial 5′-tRNA editing. RNA. 2011;17:613–623. doi: 10.1261/rna.2517111. [DOI] [PMC free article] [PubMed] [Google Scholar]
- 20.Hyde SJ, Eckenroth BE, Smith BA, Eberley WA, Heintz NH, Jackman JE, Doublie S. From the Cover: tRNAHis guanylyltransferase (THG1), a unique 3′-5′ nucleotidyl transferase, shares unexpected structural homology with canonical 5′-3′ DNA polymerases. Proc Natl Acad Sci U S A. 2010;107:20305–20310. doi: 10.1073/pnas.1010436107. [DOI] [PMC free article] [PubMed] [Google Scholar]
- 21.Steitz TA. A mechanism for all polymerases. Nature. 1998;391:231–232. doi: 10.1038/34542. [DOI] [PubMed] [Google Scholar]
- 22.Steitz TA. DNA polymerases: structural diversity and common mechanisms. J Biol Chem. 1999;274:17395–17398. doi: 10.1074/jbc.274.25.17395. [DOI] [PubMed] [Google Scholar]
- 23.Jackman JE, Phizicky EM. Identification of critical residues for G-1 addition and substrate recognition by tRNA(His) guanylyltransferase. Biochemistry. 2008;47:4817–4825. doi: 10.1021/bi702517q. [DOI] [PubMed] [Google Scholar]
- 24.Fierke CA, Hammes GG. Transient kinetic approaches to enzyme mechanisms. Methods Enzymol. 1995;249:3–37. doi: 10.1016/0076-6879(95)49029-9. [DOI] [PubMed] [Google Scholar]
- 25.Sohn J, Buhrman G, Rudolph J. Kinetic and structural studies of specific protein-protein interactions in substrate catalysis by Cdc25B phosphatase. Biochemistry. 2007;46:807–818. doi: 10.1021/bi061257y. [DOI] [PubMed] [Google Scholar]
- 26.Doublie S, Ellenberger T. The mechanism of action of T7 DNA polymerase. Curr Opin Struct Biol. 1998;8:704–712. doi: 10.1016/s0959-440x(98)80089-4. [DOI] [PubMed] [Google Scholar]
- 27.Doublie S, Tabor S, Long AM, Richardson CC, Ellenberger T. Crystal structure of a bacteriophage T7 DNA replication complex at 2.2 A resolution. Nature. 1998;391:251–258. doi: 10.1038/34593. [DOI] [PubMed] [Google Scholar]
- 28.Polesky AH, Dahlberg ME, Benkovic SJ, Grindley ND, Joyce CM. Side chains involved in catalysis of the polymerase reaction of DNA polymerase I from Escherichia coli. J Biol Chem. 1992;267:8417–8428. [PubMed] [Google Scholar]
- 29.Sydow JF, Cramer P. RNA polymerase fidelity and transcriptional proofreading. Curr Opin Struct Biol. 2009;19:732–739. doi: 10.1016/j.sbi.2009.10.009. [DOI] [PubMed] [Google Scholar]
- 30.Vaisman A, Ling H, Woodgate R, Yang W. Fidelity of Dpo4: effect of metal ions, nucleotide selection and pyrophosphorolysis. EMBO J. 2005;24:2957–2967. doi: 10.1038/sj.emboj.7600786. [DOI] [PMC free article] [PubMed] [Google Scholar]
- 31.Franklin MC, Wang JM, Steitz TA. Structure of the replicating complex of a pol alpha family DNA polymerase. Cell. 2001;105:657–667. doi: 10.1016/s0092-8674(01)00367-1. [DOI] [PubMed] [Google Scholar]
- 32.Beard WA, Wilson SH. Structural insights into DNA polymerase beta fidelity: hold tight if you want it right. Chem Biol. 1998;5:R7–13. doi: 10.1016/s1074-5521(98)90081-3. [DOI] [PubMed] [Google Scholar]
- 33.Doublié S, Sawaya MR, Ellenberger T. An open and closed case for all polymerases. Structure. 1999;7:R31–R35. doi: 10.1016/S0969-2126(99)80017-3. [DOI] [PubMed] [Google Scholar]
- 34.Wang LK, Schwer B, Shuman S. Structure-guided mutational analysis of T4 RNA ligase 1. RNA. 2006;12:2126–2134. doi: 10.1261/rna.271706. [DOI] [PMC free article] [PubMed] [Google Scholar]
- 35.Shuman S. Structure, mechanism, and evolution of the mRNA capping apparatus. Prog Nucleic Acid Res Mol Biol. 2001;66:1–40. doi: 10.1016/s0079-6603(00)66025-7. [DOI] [PubMed] [Google Scholar]
- 36.Shuman S, Hurwitz J. Mechanism of mRNA capping by vaccinia virus guanylyltransferase: characterization of an enzyme--guanylate intermediate. Proc Natl Acad Sci U S A. 1981;78:187–191. doi: 10.1073/pnas.78.1.187. [DOI] [PMC free article] [PubMed] [Google Scholar]
- 37.Shuman S, Schwer B. RNA capping enzyme and DNA ligase: a superfamily of covalent nucleotidyl transferases. Molecular Microbiology. 1995;17:405–420. doi: 10.1111/j.1365-2958.1995.mmi_17030405.x. [DOI] [PubMed] [Google Scholar]
- 38.Deana A, Celesnik H, Belasco JG. The bacterial enzyme RppH triggers messenger RNA degradation by 5′ pyrophosphate removal. Nature. 2008;451:355–358. doi: 10.1038/nature06475. [DOI] [PubMed] [Google Scholar]
- 39.Messing SA, Gabelli SB, Liu Q, Celesnik H, Belasco JG, Pineiro SA, Amzel LM. Structure and biological function of the RNA pyrophosphohydrolase BdRppH from Bdellovibrio bacteriovorus. Structure. 2009;17:472–481. doi: 10.1016/j.str.2008.12.022. [DOI] [PMC free article] [PubMed] [Google Scholar]
- 40.Wang Z, Jiao X, Carr-Schmid A, Kiledjian M. The hDcp2 protein is a mammalian mRNA decapping enzyme. Proc Natl Acad Sci U S A. 2002;99:12663–12668. doi: 10.1073/pnas.192445599. [DOI] [PMC free article] [PubMed] [Google Scholar]
- 41.Nowotny M, Gaidamakov SA, Crouch RJ, Yang W. Crystal structures of RNase H bound to an RNA/DNA hybrid: substrate specificity and metal-dependent catalysis. Cell. 2005;121:1005–1016. doi: 10.1016/j.cell.2005.04.024. [DOI] [PubMed] [Google Scholar]
- 42.Nowotny M, Yang W. Stepwise analyses of metal ions in RNase H catalysis from substrate destabilization to product release. EMBO J. 2006;25:1924–1933. doi: 10.1038/sj.emboj.7601076. [DOI] [PMC free article] [PubMed] [Google Scholar]
Associated Data
This section collects any data citations, data availability statements, or supplementary materials included in this article.