Abstract
Acetaminophen (APAP) toxicity is responsible for approximately half of all cases of acute liver failure in the United States. The mouse model of APAP toxicity is widely used to examine mechanisms of APAP toxicity. Non-invasive approaches would allow for serial measurements in a single animal to study the effects of experimental interventions on the development and resolution of hepatocellular necrosis. The following study examined the time course of hepatic necrosis using small animal magnetic reasonance imaging (MRI) following the administration of 200 mg/kg ip APAP given to B6C3F1 male mice. Mice treated with saline served as controls (CON). Other mice received treatment with the clinical antidote N-acetylcysteine (APAP+NAC). Mouse liver pathology was characterized using T1 and T2 weighted sequences at 2, 4, 8 and 24 h following APAP administration. Standard assays for APAP toxicity (serum alanine aminotransaminase (ALT) levels and hemotoxylin and eosin (H&E) staining of liver sections) were examined relative to MRI findings. Overall, T2 sequences had a greater sensitivity for necrosis and hemorrhage than T1 (FLASH) images. Liver injury severity scoring of MRI images demonstrated increased scores in the APAP mice at 4, 8 and 24 h compared to the CON mice. APAP+NAC mice had MRI scores similar to the CON mice. Semi-quantitative analysis of hepatic hemorrhage strongly correlated with serum ALT. Small animal MRI can be used to monitor the evolution of APAP toxicity over time and to evaluate the response to therapy.
Keywords: Acetaminophen, liver, MRI, hemorrhage
INTRODUCTION
Acetaminophen or paracetamol (N-acetyl-p-aminophenol) toxicity is an important health problem and accounts for more than 100,000 telephone calls to poison control centers (1) and 500 deaths annually in the United States (US) (2). Patients that present to medical centers early after overdose have a good response to treatment with the antidote N-acetylcysteine (NAC). However, treatment delays are very common and recent reports indicate that 45% of all cases of acute liver failure in the US are secondary to APAP toxicity (3, 4). While the antidote NAC is highly effective for the treatment of APAP overdose, its efficacy is greatly diminished in patients that present to medical centers 24 h after an APAP overdose (5). The development of novel therapies for the treatment of APAP overdose, and approaches to monitor the effects of new therapies, has the potential to improve overall survival for this common clinical condition.
Depletion of hepatic glutathione and metabolism of APAP to the highly reactive intermediate N-acetyl p-benzoquinonimine (NAPQI) are critical early steps in the pathogenesis of APAP toxicity (6, 7). The histopathologic appearance of APAP toxicity by light microscopy is characterized by hepatocellular necrosis that begins in the centrilobular regions of the liver and extends to the midzonal regions over time (8, 9). In addition, hemorrhage is associated with the appearance of necrosis. These histologic findings parallel elevations of serum alanine aminotransferase (ALT), a standard biochemical indicator of liver injury (2, 3, 6, 7). Mechanistic studies of APAP toxicity in the mouse model involve time course experiments using large numbers of mice that are sacrificed at various time points to obtain liver sections to examine relative changes in toxicity across time. These studies can be expensive and labor intensive. Non-invasive approaches to study hepatic injury in real time would allow for within animal comparisons of toxicity events. Small animal MRI analysis of the liver represents a non-invasive approach that could be used to study relative changes in mouse liver over time. The following report demonstrates the temporal progression of MRI findings in the liver using the mouse model of APAP toxicity. In addition, the effect of treatment with the clinical antidote, NAC, is examined.
METHODS AND MATERIALS
Reagents
APAP and NAC were obtained from Sigma Chemical Co. (St. Louis, MO). Gills Hematoxylin and Eosin stain (H&E) and permount were acquired from Fisher Scientific, Inc. (Pittsburgh, PA).
Experimental Animals
Six week old male B6C3F1 mice (mean weight = 24.4 grams) were obtained from Harlan Sprague Dawley (Indianapolis, IN). All animal experimentation was in accordance with the criteria of the “Guide for the Care and Use of Laboratory Animals” prepared by the National Academy of Sciences. Protocols for animal experimentation were approved by the University of Arkansas for Medical Sciences Institutional Animal Care and Use Committee. Mice were acclimatized one week prior to the planned experiments. Mice were fed ad libitum and were housed in individual cages on a 12 h light/dark cycle. On the day prior to experiments, mice were fasted overnight and dosing studies began at 0800 the following morning.
Treatments
Mice were dosed with APAP (200 mg/kg ip, n=3) or saline (CON, n=3). Additional mice received APAP followed by NAC (1200 mg/kg IP in saline, pH 7.4) at 1 h after APAP (APAP + NAC, n=3). Immediately prior to MRI scans, retro-orbital blood samples were collected for determination of ALT at 2, 4, 8 and 24 h following APAP injection. Blood samples were allowed to coagulate at room temperature and then centrifuged to obtain serum. At the end of the study, euthanasia was conducted by cervical dislocation and livers were quickly removed for histopathological analyses. All samples were stored at −80°C until analysis. Separate mice were used for histology sections for some of the experiments.
APAP Toxicity assays
Serum ALT levels (IU/L) were determined using an Ace Alera Chemistry Analyzer (Alfa Wassermann Inc., West Caldwell, NJ). H&E staining was performed for histological examination of mouse livers (10, 11).
MRI
Two hours following treatment with APAP, mice were imaged in a 7 Tesla (T) research magnetic resonance imaging (MRI) scanner (7T Bruker PharmaScan with a Bruker BioSpec console) using a Bruker 300 MHz mouse body coil to perform two sequences. Since this study focused on anatomical changes in the liver resulting from APAP, two MRI pulse sequences that provide excellent structural information, the T1 FLASH and T2 RARE sequences, were used. Other sequences such as diffusion weighted imaging may also provide useful information assessing the acute injury (12, 13), but are vulnerable to motion artifacts caused by breathing and cardiac pulsation and image distortion caused by susceptibility artifact. Relaxation parameter measurements such as T1 and/or T2 mapping may be more specific than T1 and/or T2 weighted images, but require longer scan times and would not be suitable for the mice in this study which underwent 4 MRI studies in 24 hours. Contrast enhanced MRI was also not considered. Imaging parameters for the T1 (FLASH) weighted images were TR=350.0 ms, TE= 3.7 ms, flip angle (FA) of 40 deg, field of view (FOV) 46 mm×46 mm, image resolution of 0.180 mm/pixel×0.180 mm/pixel, slice size 1 mm, signal average of 1 and scan time of 2.14 min. T2 weighted sequences (T2 RARE) parameters were TR=2500.0 ms and TE= 32.0 ms, FA 180.0 deg, FOV 46 mm×46 mm, image resolution 0.180 mm/pixel×0.180 mm/pixel, slice size 1 mm, signal average of 3 and scan time of 8 min. All images were obtained in the axial plane and were respiratory-gated to minimize motion artifact. Subsequent scans were performed at 4, 8 and 24 h following APAP injection. The animals were anesthetized with isoflurane at 1.5% or 2.0% isoflurane mixed with oxygen.
MRI assessment of tissue necrosis and hemorrhage
MRI images were reviewed and scored according to the degree of venous congestion and hemorrhage, well-characterized histopathological findings of APAP toxicity (12, 13). Qualitative evaluation of the severity of liver injury (Table 1) at three axial levels (I, II and III) obtained from images of the dome of the diaphragm to the kidneys in each animal was performed by two radiologists that were blinded to the experimental groups. In addition, a semi-quantitative approach was used to examine the severity of liver injury. In the semi-quantitative approach, the drawing tool of National Institute of Health ImageJ was used to outline focal areas of hemorrhage in two regions of the medial and lateral lobes of the liver. These measurements were expressed relative to the total area of the liver parenchyma. The total parenchymal area was calculated in six measurements/sequence type (FLASH and T2).
Table 1.
Hepatic MRI Scoring
| Score | Marked Change |
|---|---|
| 0 | =Normal |
| 1 | =Mottling only |
| 2 | =Mottling predominant |
| 3 | =Confluent predominant with some Focal areas* |
| 4 | =Complete confluency* |
Focal area shown as severe dark areas on MRI
Statistics
Results are expressed as means ± SE. The ANOVA or Student’s t test was used to determine comparisons between treatment groups. StatView for Windows, SAS Institute Inc Version 5.0 software was used for statistical analysis.
RESULTS
Model of APAP Toxicity
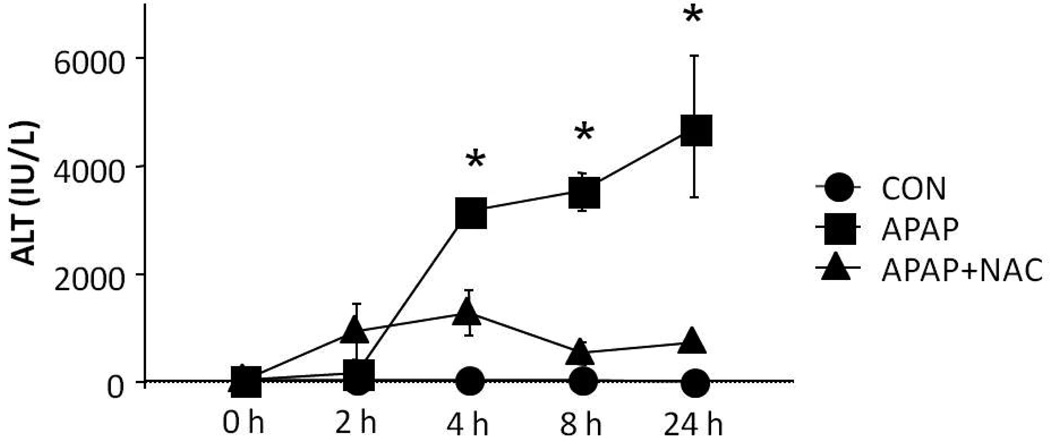
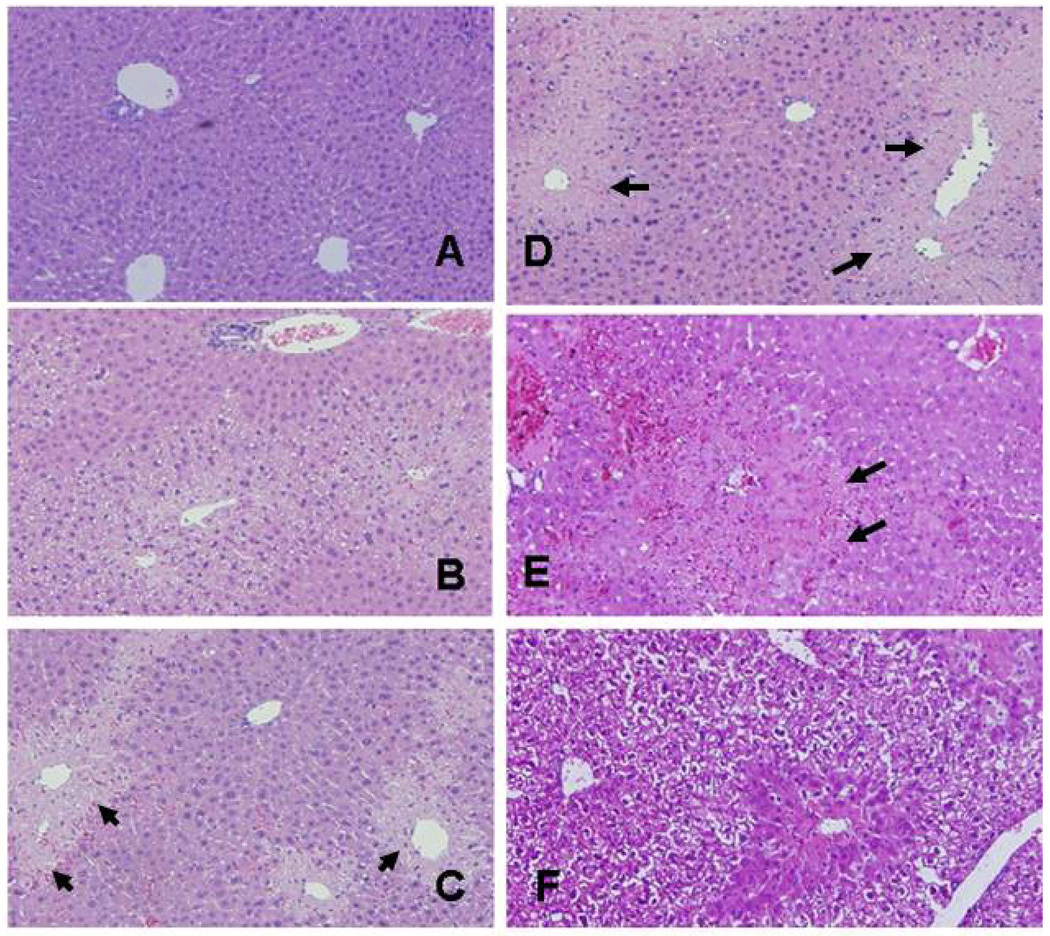
Elevation of ALT is the most widely used biochemical marker of APAP toxicity. Blood samples were obtained from the mice at the time of MRI scanning for analysis of serum ALT. Consistent with previous data, (14, 15) serum levels of ALT were significantly elevated in the APAP mice at 4, 8, and 24 h compared to CON mice (Fig 1, p<0.05). In contrast, the APAP+NAC mice had serum ALT values that were comparable to the CON mice at all time points (Fig 1; p=NS). Figure 2 demonstrates the histologic appearance of hepatocellular necrosis in the CON (A), APAP (B-E), and APAP+NAC (F) mice at 200×magnification. Beginning at 2 hours (B), there was pallor in the hepatocytes surrounding the central veins and the nuclei of the hepatocytes were shrunken in some of the cells. By 4 h (C), the area of necrosis was more defined and greater in extent. By 8 h (D), the necrosis had increased to the midzonal regions of the hepatic lobule, with bridging between the centrilobular regions in some areas. By 24 h (E), the central veins were occluded and frank hemorrhage was present in the midzonal regions. In contrast, the area of necrosis was contained to the cells surrounding the central vein in the mice that received NAC 1 h after APAP (F), indicating that NAC prevented the further progression of necrosis.
Figure 1. Time course of APAP toxicity in mice.
Mice were treated with saline vehicle (CON) or APAP or APAP+NAC and sacrificed after 24 hours. Serum ALT was significantly elevated in the APAP mice at 4, 8 and 24 h compared to the CON mice (*p<0.05). Mice treated with APAP+NAC had ALT levels that were comparable to the CON mice.
Figure 2. Effect of APAP toxicity on liver histology.
Mice were treated with APAP (200 mg/kg IP) and sacrificed at 2, 4, 8 or 24 h (panels B-E, respectively). Some mice received saline (panel A). Other mice received APAP+NAC (panel F). Arrows indicate areas of necrosis. At 2 h (B), there was centrilobular pallor in the hepatocytes surrounding the central vein and the nuclei were shrunken in some cells. By 4 h (C), the regions of necrosis were defined and progressed in extent by 8 h (D). By 24 h (E), the central veins were collapsed and filled with cellular debris and frank hemorrhage was present. The progression of necrosis was halted in the mice treated with APAP+NAC (F).
MRI Findings
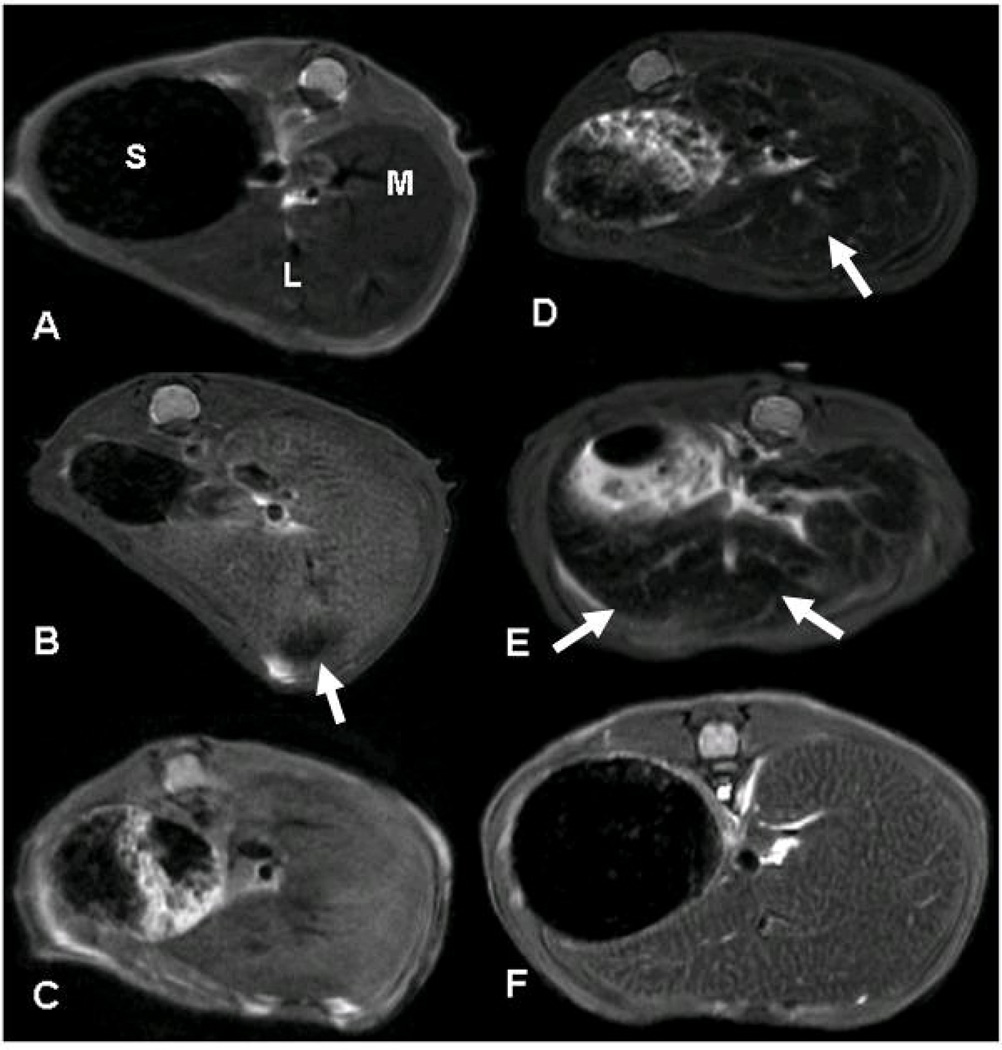
All mice were scanned using the T1 FLASH and T2 weighted sequences at 2, 4, 8 and 24 h after APAP. Overall, the T2 weighted sequence images provided better visualization of liver injury than the T1 FLASH sequence. A representative MRI T2 sequence of APAP toxicity is shown in Figure 3. The T2 images illustrated the appearance of mottling soon after APAP administration (Fig 3B, 2 h), which correlated with the histology appearance of centrilobular pallor (Fig 2B). The mottled appearance became confluent by 4 h (Fig 3C) and in subsequent images at 8 and 24 h, areas of necrotic hemorrhage were the predominant finding (Fig 3D and 3E). In contrast, the mice that received APAP+NAC (Fig 3F) maintained a mottled appearance which was similar to the APAP mice at 2 h. No evidence of hemorrhage was apparent in the APAP+NAC mice.
Figure 3. Axial T2 MRI weighted images in transverse views of the median (M) and left (L) liver lobes in mice treated with APAP (200 mg/kg IP).
T2 weighted images representing the following groups (A) Saline vehicle treated mouse and APAP treated mice at 2 (B), 4 (C), 8 (D) and 24 (E) h following treatment with 200 mg/kg IP and (F) APAP+NAC mouse. The early appearance of mottling in the APAP mouse at 2 h is followed by extensive hemorrhage at 8 and 24 h. The APAP+NAC (panel F) indicated mottling without hemorrhage. Abbreviations: stomach (S), median lobe (M), left lobe (L). Arrows indicate areas of hemorrhage.
Qualitative Scoring of MRI Images
To compare the relationship between MRI findings to the histologic appearance of hepatocellular necrosis, MRI findings were scored by two blinded, independent reviewers according to the system outlined in Table 1. MRI median and left lateral lobe T2 sequence scores were averaged and are presented in Table 2. Significantly higher MRI scores were present in the APAP mice at 4, 8 and 24 h, compared to the CON mice (Table 2; p≤0.004). In addition, the MRI image scores were significantly higher in the APAP mice compared to the APAP+NAC (p≤0.028) at 4, 8 and 24 h. There were no differences among APAP+NAC image scores over time from 2 to 24 h (p≥0.49) (Table 2). However MRI scores in APAP+NAC reflected slight mottling and there was no necrosis or hemorrhage (Table 2).
Table 2.
Qualitative MRI assessment of tissue necrosis.
| T2 Pathologic MRI scores | CON | APAP† | APAP+NAC |
|---|---|---|---|
| 0 h | 0.25±0 | 0.25±0 | 0.25±0 |
| 2 h | 0.25±0 | 2.4±0.4 | 1.0±1.0 |
| 4 h | 0±0 | 3.3±0.4* | 1.0±0.6** |
| 8 h | 0±0 | 3.8±0.1* | 1.5±0.5** |
| 24 h | 0±0 | 3.9±0.1* | 1.7±0.3** |
APAP means at similar times are > CON and APAP+NAC at p≤0.028.
Overall APAP+NAC treatment mean was significantly less than APAP alone at p≤0.03.
In APAP treatment groups, 0 and 2 h was significantly different from 4, 8 and 24 h, however 4 and 8 h was not different from 24 h.
Changes were noted in the extent of necrosis between the median and left lobes of the liver in the APAP mice using the T2 sequence (p=0.03). Differences in scores between the T2 median and left lobe sequences may have been due to gravity as blood pooled in the hemorrhagic liver. Similar to T2 images, FLASH sequence scores were significantly different between the treatment groups (APAP 2.75±0.34 vs. APAP+NAC 1.38±0.24, p=0.001). No difference was observed in the MRI scores between the median and left lateral lobes (p=0.26) using the FLASH sequences.
Semi-Quantitative MRI Analysis
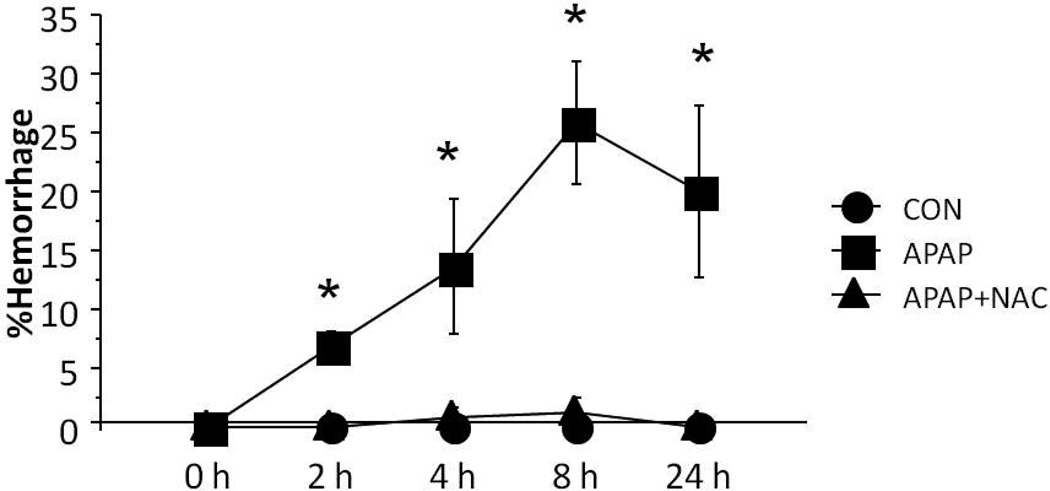
Semi-quantitative MRI analysis using a drawing tool to isolate and quantify areas of hemorrhage indicated that the APAP mice had higher percentages of hemorrhage at all time points compared to the CON mice (mean %, 17.5±3.3 vs. 0.0, p=0.0003). In addition, the APAP mice had increased hemorrhage compared to the APAP+NAC mice (mean %, 17.5±3.3 vs. 0.52±0.4, p<0.0001) (Figure 4).
Figure 4. MRI measurements of hemorrhage in APAP toxicity in mice.
Focal intensity measurements of hemorrhage, expressed as a percent of the hepatic parenchyma, obtained from the MRI RARE T2 scan series. Data are expressed as means ± SE (*p<0.05).
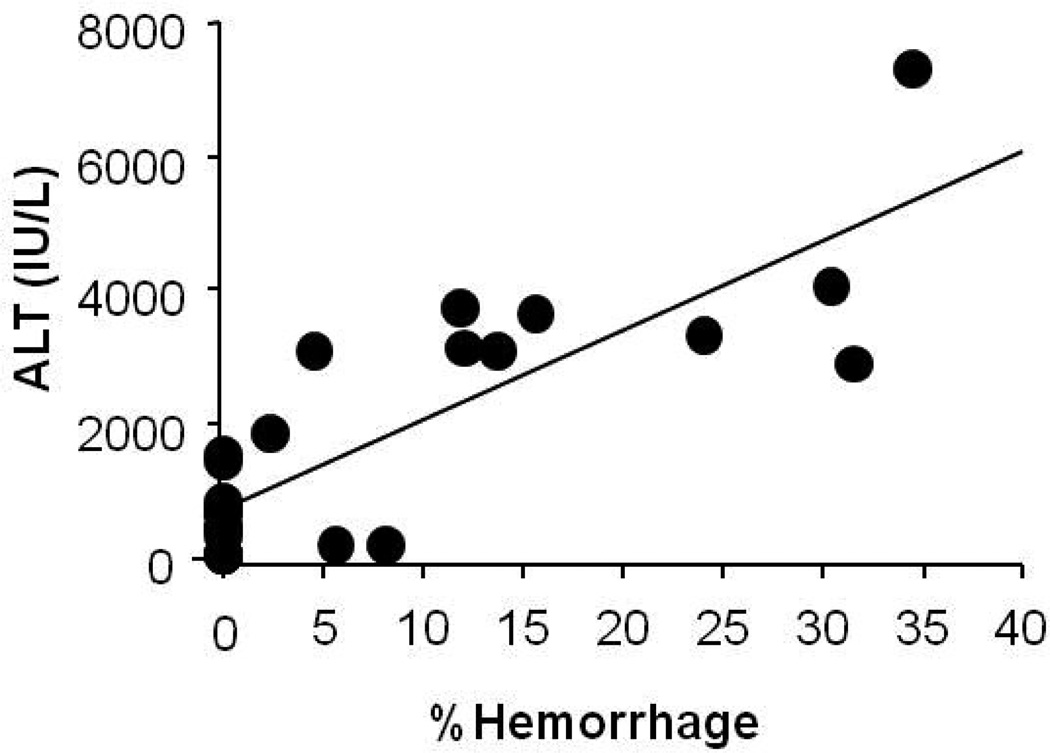
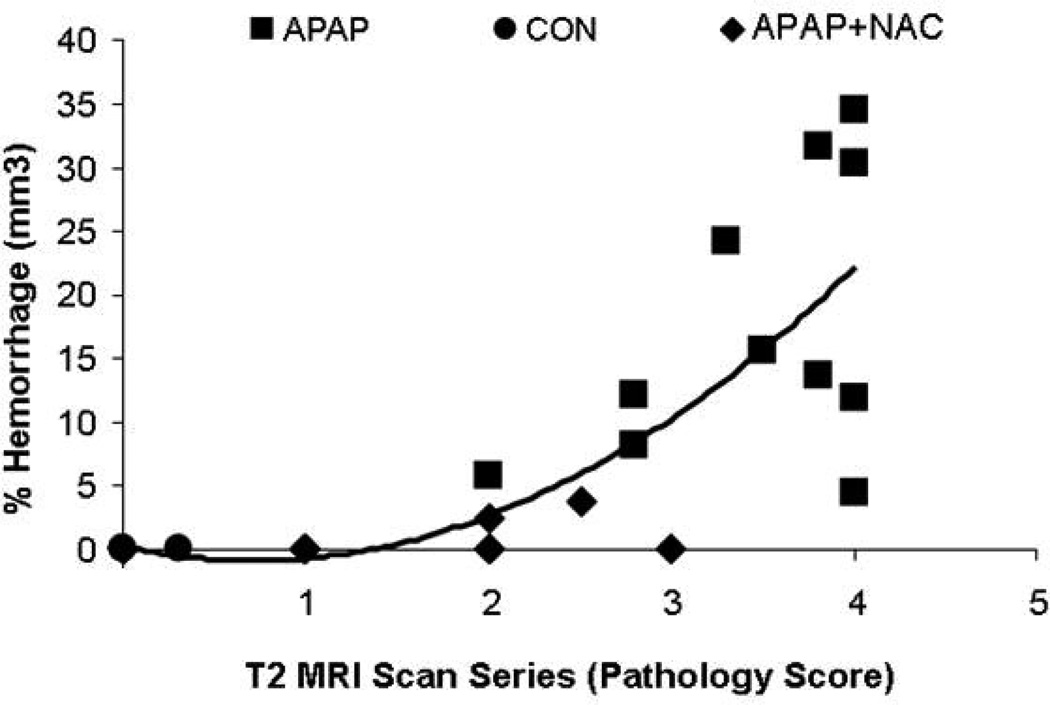
Analysis of serum ALT and percent hemorrhage in the MRI images demonstrated a strong positive correlation between ALT and the percent hemorrhage areas (Figure 5; R=0.83; p<0.0001). In addition, analysis of percent hemorrhage and the T2 and FLASH scores demonstrated a positive relationship between hemorrhage and T2 sequences (R=0.74; p<0.0001) (Figure 6) and hemorrhage and FLASH sequences (R=0.73; p<0.0001) (figure not shown).
Figure 5. Alanine aminotransferase (ALT) vs. percent hemorrhage area measurements.
Analysis of serum ALT and % hemorrhage area measurements demonstrated a positive correlation (R=0.83; p<0.0001).
Figure 6. Percent hemorrhage area vs. radiology scoring.
Analysis indicated a positive correlation between image analysis of hemorrhage and qualitative scoring of MRI by radiologists (R=0.74; p<0.0001).
DISCUSSION
Small animal MRI has not been widely used in studies of drug toxicity. Dupas et al (16) reported the MRI appearance of liver necrosis in a rat model of alcohol hepatotoxicity. Contrast agents were used to observe site injected alcohol in necrotic areas. Malarkey et al (17) reported the use of MRI in the rat model of APAP toxicity, but did not examine relative changes over time. The findings of the present study demonstrate that small animal MRI, and in particular, T2 weighted images, can be used as an alternative approach to examine in vivo toxicity in a single mouse over time.
Traditional approaches to study APAP toxicity require large numbers of mice that are sacrificed at multiple points across time following the administration of hepatotoxic doses of APAP. MRI enables direct observation over time of the appearance of the liver in an individual mouse. The present study examined the relationship between traditional endpoints in toxicity studies (histology, serum ALT) and MRI changes in the mouse model of APAP toxicity. Analyses by blinded observers indicated that changes in the MRI appearance of the liver were present at the earliest time point studied (2 h) in APAP treated mice (Figure 2C; Table 2). The histologic appearance of APAP toxicity by light microscopy at 2 h is that of centrilobular pallor (or “congestion”) and pyknotic nuclei, as illustrated in Figure 2B. Using high resolution techniques, such as scanning electronic microscopy, changes in the hepatic sinusoids have been shown to occur from 30 min to 2 h in APAP toxicity (18–20). Erythrocytes enter the Space of Disse via large pores or gaps that occur in sinusoidal endothelial lining cells (20). The Space of Disse subsequently enlarges as sinusoidal endothelial cells swell and separate from hepatocytes.
At the 4 h time point, the mottled appearance noted at 2 h became confluent (Figure 3C) and corresponded to larger, distinct areas of necrosis in the histology images (Figure 2C). ALT elevations were also apparent at 4 h (Figure 1). It is interesting to note that previous studies using intravital microscopy have shown a progressive decline from 1 to 6 h in the number of sinusoids containing red blood cell flow in APAP toxicity in the mouse (21). We postulate that the MRI appearance of mottling may represent the correlate of changes in the hepatic microcirculation that begin to occur before frank necrosis and the release of ALT from the liver into serum (Figure 1). As necrosis progressed, demonstrated by ALT values and histology at 8 and 24 h (Figure 1, Figure 2D, Figure E), the presence of hemorrhage became the predominant pattern in the T2 Flash MRI images (Figure 3D, Figure 3E).
Finally, the data from the present study demonstrate that the T2 FLASH images had the sensitivity to detect changes in the livers of mice that received treatment with the clinical antidote, NAC. NAC works by replacing hepatic glutathione which is depleted early in APAP toxicity. Administration of NAC at 1 h after APAP halted subsequent progression to frank necrosis and hemorrhage, but did not alter the appearance of mottling that was present in the APAP mice at 1 h. In the clinical setting, NAC is highly effective if given early in APAP toxicity. However, new therapies are needed for patients that present late in the course of toxicity, following the depletion of hepatic glutathione, at which time NAC’s efficacy is diminished. Future studies of new treatments for APAP toxicity could utilize small MRI to perform longitudinal assessments of liver responses to treatment.
ACKNOWLEDGEMENTS
The project described was supported by Award Number UL1RR029884 from the National Center for Research Resources. The content is solely the responsibility of the authors and does not necessarily represent the official views of the National Center for Research Resources or the National Institutes of Health. In addition, this work was supported by the NIDDK grant (1R01DK081406) and by Arkansas Children’s Hospital Research Institute and the Arkansas Biosciences Institute through Arkansas Tobacco Settlement Funds.
Footnotes
Publisher's Disclaimer: This is a PDF file of an unedited manuscript that has been accepted for publication. As a service to our customers we are providing this early version of the manuscript. The manuscript will undergo copyediting, typesetting, and review of the resulting proof before it is published in its final citable form. Please note that during the production process errors may be discovered which could affect the content, and all legal disclaimers that apply to the journal pertain.
REFERENCES
- 1.Litovitz TL, Klein-Schwartz W, Dyer KS, Shannon M, Lee S, Powers M. 1997 annual report of the American Association of Poison Control Centers Toxic Exposure Surveillance System. Am J Emerg Med. 1998;16:443–497. doi: 10.1016/s0735-6757(98)90000-6. [DOI] [PubMed] [Google Scholar]
- 2.Lee WM. Acetaminophen-related acute liver failure in the United States. Hep Research. 2008;38:S3–S8. doi: 10.1111/j.1872-034X.2008.00419.x. [DOI] [PubMed] [Google Scholar]
- 3.Khandelwal N, James LP, Sanders C, Larson AM, Lee WM the Acute Liver Failure Study Group. 2011;53:567–576. doi: 10.1002/hep.24060. [DOI] [PMC free article] [PubMed] [Google Scholar]
- 4.Lawson JA, Farhood A, Hopper RD, Bajt ML, Jaeschke H. The hepatic inflammatory response after acetaminophen overdose: the role of neutrophils. Toxicol. 2000;54:509–516. doi: 10.1093/toxsci/54.2.509. [DOI] [PubMed] [Google Scholar]
- 5.Smilkstein MJ, Knapp GL, Lukig KW, Rumack BH. Efficacy of oral N-acetylcysteine in the treatment of acetaminophen overdose. Analysis of the national multicenter study (1976 to 1985) N Engl J Med. 1988;319:1557–1562. doi: 10.1056/NEJM198812153192401. [DOI] [PubMed] [Google Scholar]
- 6.Hinson JA, Roberts DW, James LP. Adverse Drug Reactions, Handbook of Experimental Pharmacology 196. Springer-Verlag Berlin Heidelberg; 2009. Mechanisms of acetaminophen-induced liver necrosis. [DOI] [PMC free article] [PubMed] [Google Scholar]
- 7.Hinson JA, Roberts DW, James LP. Mechanisms of acetaminophen-induced liver necrosis. Handb Exp Pharmacol. 2010;196:369–405. doi: 10.1007/978-3-642-00663-0_12. [DOI] [PMC free article] [PubMed] [Google Scholar]
- 8.Portmann B, Talbot IC, Day DW, et al. Histopathological changes in the liver following a paracetamol overdose: correlation with clinical and biochemical parameters. J Pathol. 1975;117:169–181. doi: 10.1002/path.1711170307. [DOI] [PubMed] [Google Scholar]
- 9.Poulsen HE, Petersen P, Vilstrup H. Quantitative liver function and morphology after paracetamol administration to rats. Eur J Clin Invest. 1975;11:161–164. doi: 10.1111/j.1365-2362.1981.tb01835.x. [DOI] [PubMed] [Google Scholar]
- 10.Milesi-Halle A, Abdel-Rahman SM, Brown A, McCullough SS, Letzig L, Hinson JA, James LP. Indocyanine green clearance varies as a function of N-acetylcysteine treatment in a muring model of acetaminophen toxicity. Chem Biol Interact. 2011;189:222–229. doi: 10.1016/j.cbi.2010.12.001. [DOI] [PMC free article] [PubMed] [Google Scholar]
- 11.Chaudhuri S, McCullough SS, Hennings L, Letzig L, Simpson PM, Hinson JA, James LP. Acetaminophen hepatotoxicity and HIF-1α induction in mice occur without hypoxia. Toxicol Appl Pharmacol. 2011 doi: 10.1016/j.taap.2011.02.005. Epub ahead of print. [DOI] [PMC free article] [PubMed] [Google Scholar]
- 12.Hussain S, Perkins T. Preliminary clinical experience with a multiecho 2-point DIXON (mDIXON) sequence at 3T as an efficient alternative for both the SAR-intensive acquired in- and out-of phase chemical shift imaging as well as for 3D fat-suppressed T1-weighted sequences used for dynamic gadolinium-enhanced imaging. Proc Intl Soc Mag Reson Med. 2010;18:556. [Google Scholar]
- 13.Rosenkrantz AB, Mannelli L, Mossa D, Babb JS. Breath-hold T2-weighted MRI of the liver at 3T using the BLADE technique: impact upon image quality and lesion detection. Clin Radiol. 2011;66:426–433. doi: 10.1016/j.crad.2010.10.018. [DOI] [PubMed] [Google Scholar]
- 14.Blazka ME, Elwell MR, Holladay SD, Wilson RE, Luster MI. Histopathology of acetaminophen-induced liver changes: role of interleukin 1 alpha and tumor necrosis factor alpha. Toxicol Pathol. 1996;24:181–189. doi: 10.1177/019262339602400206. [DOI] [PubMed] [Google Scholar]
- 15.Roberts DW, Bucci TJ, Benson RW, Warbritton AR, McRae TA, Pumford NR, Hinson JA. Immunohistochemical localization and quantification of the 3-(cystein-S-yl)-acetaminophen protein adduct in acetaminophen toxicity. Am J Pathol. 1991;138:359–371. [PMC free article] [PubMed] [Google Scholar]
- 16.Dupas B, Bach-Gansmo T, Nomballasis MF, Meflah K. Delineation of liver necrosis using double contrast-enhanced MRI. J Magn Reson Imaging. 1997;7:472–477. doi: 10.1002/jmri.1880070304. [DOI] [PubMed] [Google Scholar]
- 17.Malarkey DE, Johnson K, Ryan L, Boorman G, Maronpot RR. New insights into functional aspects of liver morphology. Toxicol Path. 2005;33:27–34. doi: 10.1080/01926230590881826. [DOI] [PubMed] [Google Scholar]
- 18.Ito Y, Abril ER, Bethea NW, McCuskey RS. Inhibition of matrix metalloproteinases minimizes hepatic microvascular injury in response to acetaminophen in mice. Toxicol Sci. 2005;83:190–196. doi: 10.1093/toxsci/kfh291. [DOI] [PubMed] [Google Scholar]
- 19.Bajt ML, Yan HM, Farhood A, Jaeschke H. Plasminogen activator inhibitor-1 limits liver injury and facilitates regeneration after acetaminophen overdose. Toxicol Sci. 2008;104:419–427. doi: 10.1093/toxsci/kfn091. [DOI] [PMC free article] [PubMed] [Google Scholar]
- 20.Walker RM, Racz WJ, McElligott F. Scanning electron microscopic examination of acetaminophen-induced hepatotoxicity and congestion in mice. Am J Pathol. 1983;113:321–330. [PMC free article] [PubMed] [Google Scholar]
- 21.Ito Y, Bethea NW, Abril ER, McCuskey RS. Early hepatic microvascular injury in response to acetaminophen toxicity. Microcirculation. 2003;10:391–400. doi: 10.1038/sj.mn.7800204. [DOI] [PubMed] [Google Scholar]


