Abstract
An ultrasound system (GE Logiq 9) was modified to produce a synthetic crawling wave using shear wave displacements generated by the radiation force of focused beams formed at the left and the right edge of the region of interest (ROI). Two types of focusing, normal and axicon, were implemented. Baseband (IQ) data was collected to determine the left and right displacements, which were then used to calculate an interference pattern. By imposing a variable delay between the two pushes, the interference pattern moves across the ROI to produce crawling waves. Also temperature and pressure measurements were made to assess the safety issues. The temperature profiles measured in a veal liver along the focal line showed the maximum temperature rise less than 0.8 °C, and the pressure measurements obtained in degassed water and derated by 0.3 dB/cm/MHz demonstrate that the system can operate within FDA safety guidelines.
Keywords: Crawling wave, Sonoelasticity, Radiation force, Ultrasonic safety, System modification
Introduction
The field of ultrasound elasticity has developed into a multitude of techniques over the past two decades. All of these techniques begin with movement of the tissue, followed by tracking of the motion, and subsequent analysis of the motion to derive some mechanical property of the tissue or to display a related quantity. The various techniques can differ in the way the motion is applied (manual compression, external vibration, radiation force, natural motion), in the motion detection method, or in the processing of that motion. A comprehensive review of the field is beyond the scope of this paper, but the reader is referred to one of the many review articles available on the subject (Parker et al., 2011; Sarvazyan et al., 2010; Greenleaf et al., 2003; Ophir et al., 1999; Gao et al., 1996). This paper focuses on one of theses techniques: crawling wave processing with shear waves generated by radiation force.
Mechanically generated crawling waves were originally introduced by Wu et al. (2004). The term crawling wave refers to the slowly moving interference pattern seen when two shear waves propagate in opposite directions. The slow and controllable motion of the pattern is determined by a frequency difference or variable phase shift between the two opposing sources. Crawling waves can be created in a number of geometries using mechanical vibration sources, and can be analyzed to provide accurate quantitative estimates of the local shear wave speed, which yields the underlying Young’s modulus, E, of the biomaterial (Wu et al., 2006). The mechanical crawling wave technique has been applied to homogeneous and inhomogeneous phantoms of known Young’s modulus, whole prostates ex-vivo, and muscles in-vivo (Hoyt et al., 2006, 2007a,b, 2008a,b; Zhang et al., 2007; Castaneda et al., 2007, 2009). Real time prostate imaging by crawling waves and other elastographic techniques is of particular interest, since the incidence of prostate cancer is high but conventional imaging has limited ability to detect prostate cancer (Castaneda et al., 2007, 2009; Parker et al., 2011).
Mechanically induced crawling waves have several advantages and disadvantages, some of which are common to the radiation force crawling waves, and some of which are different. When using external mechanical vibration sources, the advantages of crawling waves are: 1) compatibility with conventional Doppler imaging systems, and 2) tractability of solutions for a relatively large region of interest between the two parallel sources. Specifically, the ability to control the motion of the interference pattern by use of small frequency or phase shifts enables the use of conventional Doppler frame rates without synchronization of the motion with the Doppler data collection. Frame rates of only a few frames per second will suffice, so there is no requirement for ultrafast or unconventional imaging strategies. Furthermore, the orientation of the two opposing sources can be set so that the majority of displacement is in the axial direction with respect to the imaging transducer. This maximizes Doppler sensitivity and can create near plane-strain conditions which are ideal for two dimensional imaging systems. The opposing sources create a region of interest characterized by well-formed and simply-modeled interference patterns. Thus, the estimates of underlying Young’s modulus can be calculated from a number of different approaches, including a-priori models, local wavelength estimators, and arrival time analysis (Hoyt et al., 2006, 2007a,b, 2008a,b; Zhang et al., 2007; Castaneda et al., 2007, 2009; McLaughlin et al., 2007). The multiple sources also help to counteract the attenuation of shear waves and to improve the coverage of a larger region. In addition, algorithms that use waves from multiple sources can be stabilized and made more robust (McLaughlin et al., 2007; Lin et al., 2011). One disadvantage of external mechanical vibration sources is that they are restricted to accessible surfaces, such as the skin layers over muscles, the liver, prostate and the breast. Another disadvantage is that the total time required for collecting the data may be high and respiratory, cardiac, and other patient motion can be an issue. The presence of external vibration sources complicates the clinical workflow, and the relative location of the sources, the patient, and the imaging transducer becomes a concern.
Ideally we would have parallel line source vibrations generated within the tissue by same probe used for imaging. Acoustic radiation force has the potential to achieve this localization and integration. Acoustic radiation force is a second-order effect which is related to the attenuation and reflection of a propagating ultrasound wave. For a more complete description of radiation force see Sarvazyan et al. (2010) or Nightingale et al. (2001). The force is directed along the direction of propagation, and is proportional to the absorption coefficient and the local intensity. This effect has been used in a variety of configurations to displace or vibrate tissues.
An early system for making local stiffness measurements on specimens was designed by Sugimoto et al. (1990). Since then, acoustic radiation force has been implemented on a number of imaging systems. See Sarvazyan et al. (2010) for a comprehensive review of the radiation force techniques. Some highlights in the field are presented here. Fatemi and Greenleaf (1998) introduced vibroacoustography, a technique in which an oscillating radiation force is generated at the beat frequency between two ultrasound frequencies transmitted from separate apertures that are simultaneously focused at the same point. This oscillating force generates a low frequency acoustic response from the tissue that is recorded by a hydrophone. Sarvazyan et al. (1998) described shear wave elasticity imaging, in which radiation force is used to generate shear waves in the tissue. The motion of these shear waves is then used to derive mechanical properties of the tissue such as shear modulus. In the mid 1990’s, Nightingale et al. (1994) began to study acoustic streaming, the phenomenon in which radiation force creates fluid flow. The acoustic streaming work led to the development of Acoustic Radiation Force Impulse (ARFI) imaging (Nightingale et al., 2001). ARFI has been explored in a whole host of clinical applications, too numerous to document here. Nightingale et al. (2003) has also tracked shear waves using ARFI type scan sequences. In the late 1990’s, Mathias Fink’s group began to study transient elastography, though at first with mechanically generated shear waves. They developed a method of high frame rate imaging (on the order of 10,000 frames per second) (Sandrin et al., 1999). The group also developed a method of creating more plane-like shear waves by firing multiple acoustic push pulses at multiple depths in rapid succession (Bercoff et al., 2004a). Combining the high speed imaging system with the efficient radiation force shear wave generation led to the unique supersonic elasticity imaging platform (Bercoff et al., 2004b). Chen et al. (2009) developed a method of extracting viscosity as well as shear modulus using Shear wave Dispersion Ultrasound Vibrometry (SDUV). SDUV collects shear displacement data at multiple shear wave frequencies. The shear viscosity is then determined from the dispersion of the phase wave speed as a function of frequency (Chen et al., 2004). Konofagou and Hynynen (2003) have developed a method called localized harmonic motion imaging. A separate transducer is used to provide a continuous wave (CW) excitation which generates an oscillating radiation force that is then tracked by a confocal imaging transducer. McAleavey et al. (2007) has taken a slightly different approach in a technique called Spatially Modulated Ultrasound Radiation Force (SMURF) imaging. Most of the CW shear wave techniques, introduce shear waves at a particular frequency and then track the wavelength in order to determine the shear wave speed. McAleavy reverses this, by setting up a particular spatial distribution and then measuring the resulting frequency to determine the shear speed. All of the radiation force based methods take advantage of locally moving the tissue at depth. This allows for positioning the shear sources within organs and near the region of interest. The same transducer can both detect the motion and generate the shear wave, which can lead to more reproducible results (Evans et al., 2010). This enables the use of shear wave imaging in the clinical setting by reducing the amount of equipment, simplifying the placement of such equipment, and improving the repeatability of the testing.
In this paper, we describe a technique which combines some of the advantages and disadvantages of radiation force with some of the advantages and disadvantages of crawling waves. The radiation force techniques are inherently synchronized with the displacement tracking, so there is no need to track the shear waves asynchronously, which was one of the advantages of mechanical crawling waves. The most straight forward approach would be to create two radiation force beams that closely mimic the mechanical vibration sources that have been used to create crawling waves. These radiation force beams would ideally be parallel, continuous wave with amplitude modulation at the desired vibration frequency, and completely non-interfering with the imaging sequence. However, the use of a single linear ultrasound probe, and the practical limitations of the energy, timing and available bandwidth, force trade-offs in the design strategy of the implementation. Impulsive, rather than continuous, radiation force pushes are more practical. Balanced design between the radiation force sequence and the imaging sequence is critical. The spatial and temporal distribution of radiation force induced displacements is also important. Thermal dose to the tissue is another concern in a clinical system. The technique described here, is a synthetically created crawling wave. The individual shear waves generated by each source are recorded separately at a high frame rate and then combined coherently in software. This allows the processing of the data to be done in a way similar to the mechanical crawling waves. It is also one technique which combines the shear waves responses from both directions in the ROI. This technique still requires high frame rate imaging, and does not have some of the signal-to-noise benefits of a non-synthetic crawling wave. However, the synthetic approach greatly reduces the demands on the hardware.
This paper is organized as follows: The experimental system for collecting displacement data is discussed and the data acquisition process is described. The method of synthetic generation of crawling waves is introduced. More details of the synthetic generation and subsequent image processing are described in a companion paper. The experimental setup for measuring temperatures and pressures is described. Experimental results showing the generation and detection of two opposing shear waves in a phantom are shown. Further results compare the shear waves generated by standard focusing to those produced by an axicon push focus. Temperature and pressure measurements which address safety for future studies are presented. The paper concludes with a discussion of the trade-offs and short comings of the technique and the experimental system used for the study. Reconstructions of shear modulus and further processing are presented in the companion paper.
Materials and Methods
Experimental System
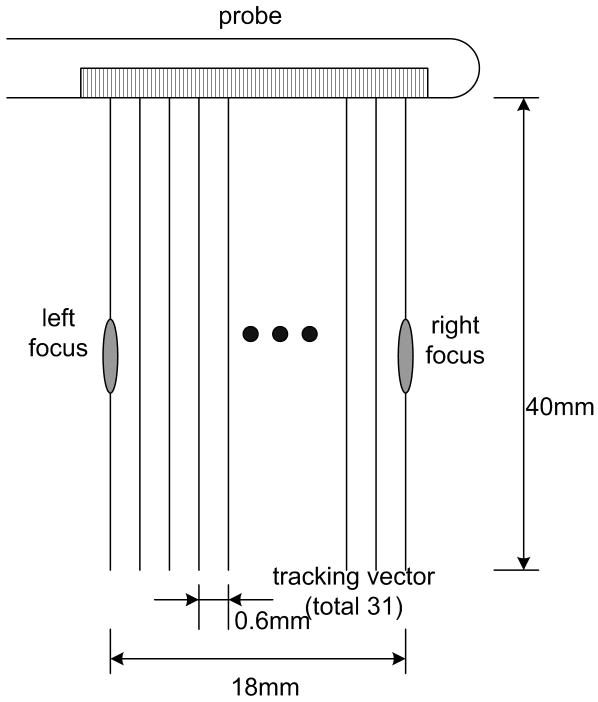
A GE Logiq 9 ultrasound system was modified to sequentially generate a radiation force push and then to collect the pulse-echo data required to generate the ARC (Acoustic Radiation Crawling) wave displacement time histories. First, a dedicated trans-rectal (TR) probe, shown in Fig. 1, was designed and built, with the ultimate goal to image the prostate with ARC waves. The azimuthal aperture of the probe is 4 cm and the maximum active aperture is 2.6 cm. The center frequency used in the experiments was around 5 MHz. Although the aperture can scan up to 4 cm, a typical region of interest (ROI) for the experiment, as shown in Fig. 2, was confined to 18 mm of lateral width and 40 mm of depth. The limited lateral extent of the ROI takes into consideration the attenuation of shear waves in the tissues and phantoms nominally used in the experiment. There are 31 vector locations spaced evenly every 600 μm across the ROI. The term vector location refers to the lateral spatial coordinate of the vector, also known as the azimuthal location. The limited number of vector locations is a trade-off with the amount of time the displacements are tracked after each push and is limited by the total number of vectors which can be stored. The total time for collecting a frame of data is also a consideration.
Figure 1.
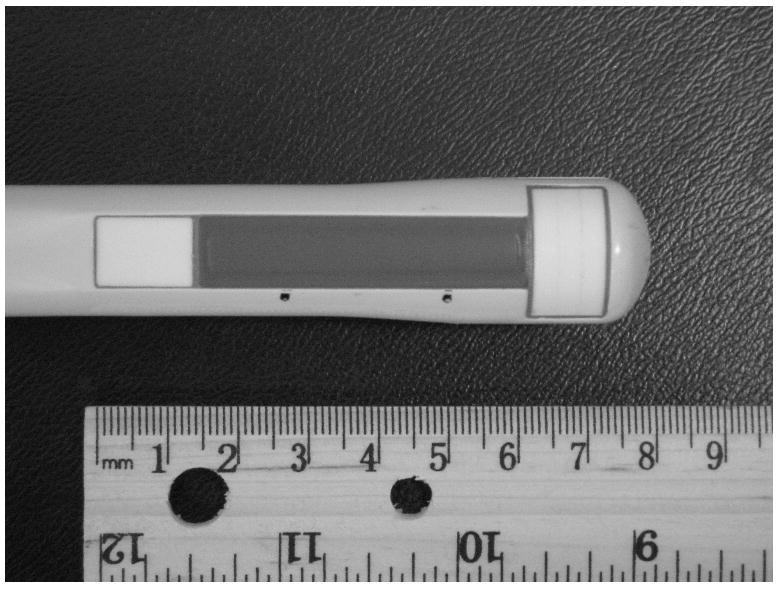
A trans-rectal (TR) probe built for radiation force experiments.
Figure 2.
Region of interest of a typical ARC (Acoustic Radiation Crawling) wave scanning.
There are two types of vectors fired by the system: pushing vectors and tracking vectors. Pushing vectors refer to the longer acoustic pulses which actually move the tissue. No received data is stored for pushing vectors. Tracking vectors are the more standard length acoustic pulses for which data is received and this data can be used to form an image of the tissue and to track the motion of the tissue. A reference vector is a tracking vector that is fired prior to the push, at a time when the tissue is considered to be in a known location. The movement of the tissue is found by comparing the locations of features in the reference vector data to the locations of those features in subsequent tracking vector firings. The pushing and tracking vectors can be fired at any of the spatial vector locations. For the experiments in this paper, the pushing vectors are chosen to be at the extreme left and extreme right vector locations in the ROI, though they can be placed outside of the ROI if desired. For the standard focusing technique, both the pushing and tracking vectors are focused at a depth of 25 mm, which is near the elevational lens focus of the probe. For the axicon focus technique, described below, the pushing vector focus is spread out over a wider depth, but the tracking vectors are not modified.
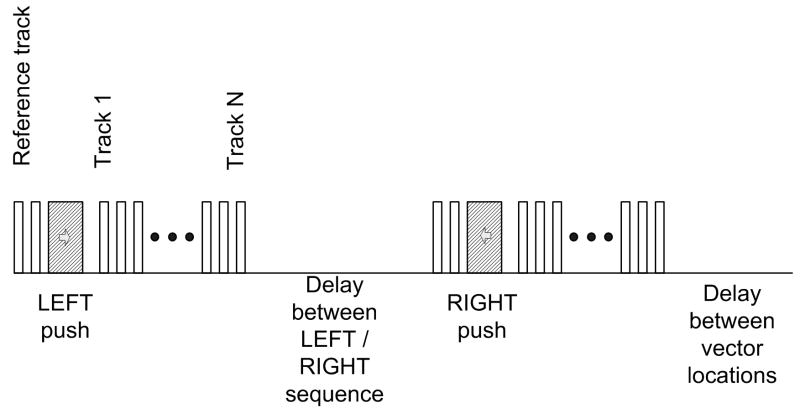
Fig. 3 displays the general timing of the sequence at a given tracking vector location. The sequence begins by firing two reference vectors at a given location to detect the zero displacement (pre-push) signal. After the reference vectors, a push vector is fired at the left most vector location in the ROI. The pushing pulse is a tone burst of a sine wave at 5 MHz that is 250 μs long. Following the push pulse there is a delay of 525 μs to allow for reverberations from the pushing pulse to attenuate and to prevent undue stress on the transmit circuitry. After this delay a series of tracking vectors is fired. The tracking vector firings have the same pulse and spatial vector location as the reference firings and occur at a pulse repetition frequency (PRF) of 2.5 kHz. There are 48 tracking vector firings in the packet, for a total tracking time of 19.2 ms. This is followed by a 43 ms delay to reduce the overall duty cycle. There are then two additional reference firings, followed by a push firing at the right vector location, and then an additional 48 tracking vector firings at the 2.5 kHz PRF. This is followed by a 62 ms delay, again to reduce the duty cycle. This sequence repeats for each of the 31 vector locations in the ROI. The entire sequence, known as a frame, is repeated several times to allow averaging for improved signal-to-noise ratios of the calculated displacements. Each frame takes on the order of 5 seconds to collect, and typically 6 frames are collected for averaging. This is obviously too long for a clinical application, but this time is a hardware limitation and could be greatly reduced with a high frame rate system such as that described by Bercoff et al. (2004b).
Figure 3.
A timing diagram of the modified scan sequence used for the experiments in this paper. This sequence is repeated for each lateral location in the ROI and the entire sequence can be repeated multiple times to allow for averaging.
For each frame, complex baseband demodulated data (IQ) was stored in a dicom format for offline processing. The sampling rate of the IQ data is 10 MHz. There were no modifications to the system hardware, but the duty cycle of the overall scan sequence was maintained at less than 0.5% to avoid thermal failure of some of the components.
Two modes of focusing can be selected for the pushing beams: normal focusing and axicon focusing (Burckhardt et al., 1973) as depicted in Fig. 4(a) and 4(b) respectively. The normal focusing mode applies delays to each element such that the pressure wave from all elements of the active aperture will arrive in phase at the desired focal depth. The size of the aperture is determined by the f-number and the physically available aperture. The focal depth can be selected, but for the experiments described here the focal depth was chosen to be 25 mm to coincide with the elevation lens focus of the probe. The axicon focusing mode distributes the focus along a line defined by two parameters: the near focus and the far focus. The near focus determines the depth at which the waveforms from the center of the active aperture will arrive in phase. The far focus determines the depth at which the waveforms from the edges of the active aperture will arrive in phase. The depth of in-phase arrival is linearly varied between the near focus and far focus as a function of distance from the center of the active aperture. For all of the experiments used in this paper, the near focus point was set to 15 mm and the far focus point was set to 35 mm. A detailed comparison will follow in the discussion section.
Figure 4.
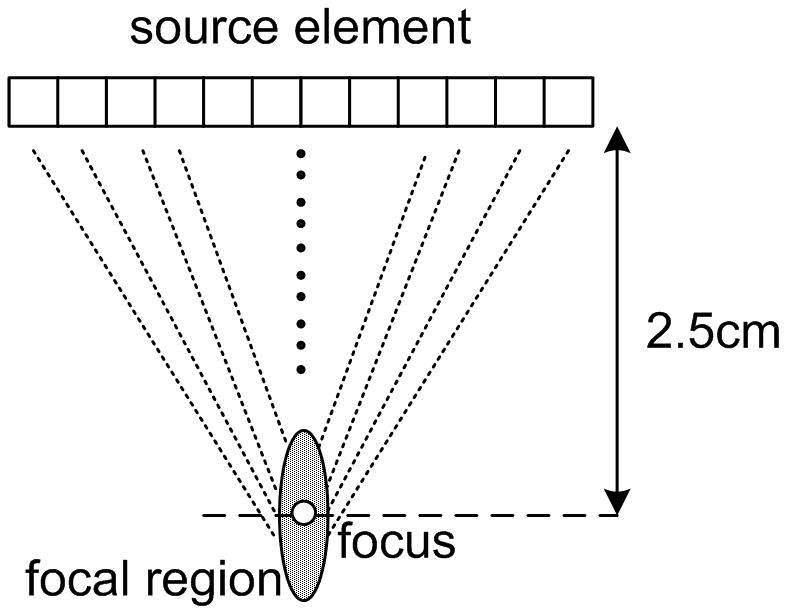
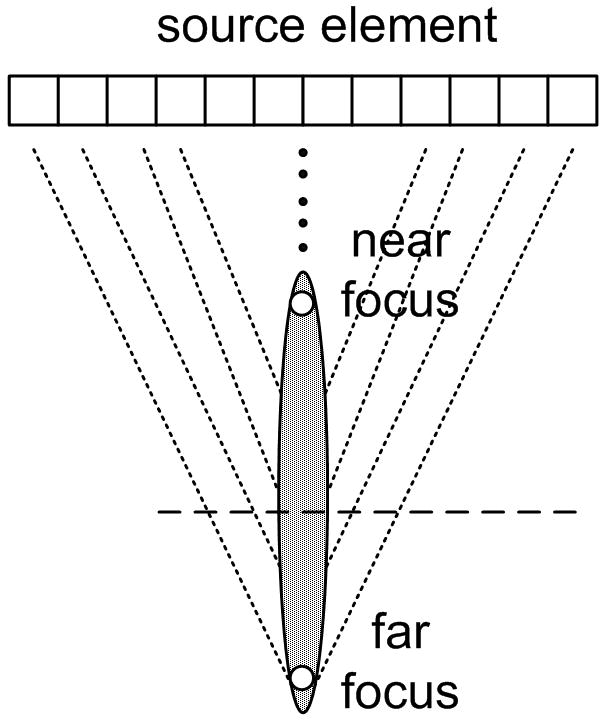
Two push beam schemes: (a) normal focusing (b) axicon focusing.
Data acquisition and post processing
IQ data sets are read from stored dicom files and processed offline. The IQ data allows the calculation of the displacement time history for the entire ROI for both a left push and a right push. Multiple frames are averaged to improve the signal-to-noise ratios of the displacement fields. The size of each data set is 2 (left and right push) × 31 vector locations × 520 samples in depth × 48 samples in time at the 2.5 kHz temporal sampling rate. This sampling rate imposes the aliasing limit on any further processing. The total time tracked is 19.2 ms.
Since the push pulses are repeated for each of the vector locations, any background motion that occurs between the push firings will lead to offset artifacts when combining the multiple data sets. Filtering the data for motion in the frequency range desired can help to reduce the artifacts (Nightingale et al., 2002; Gallippi et al., 2003). The useful bandwidth for impulsive shear wave excitation in soft tissue is between 50 - 500 Hz (Muller et al., 2009; Deffieux et al., 2009b). For phantom and excised tissue experiments, the majority of the noise motion comes from background vibration and vibrations due to the fixturing which holds the probes in place. This background motion is typically 50 Hz or lower. So it is possible to remove these low frequency noise vibrations and still have a band of usefully data. Averaging repeated sequences can reduce the artifacts as the background motion is not coherent over the multiple experiments. In practical situations, the averaging would also be corrupted by motion of the patient or probe. A system capable of very high multi-line acquisition of vectors or a receive-only beam-forming scheme, such as that described in (Tanter et al., 2002), would greatly reduce such artifacts.
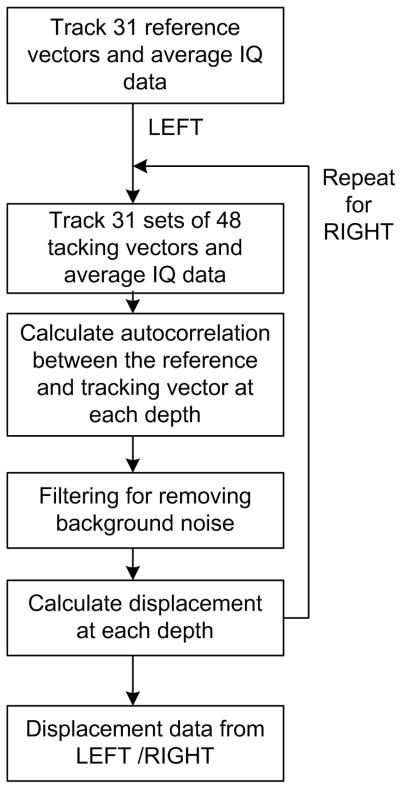
The displacements were estimated by calculating the complex auto-correlation between the reference scan vector and each of the 48 tracking vectors Kasai et al. (1985). The auto-correlation was calculated at each of the 520 depth samples. The correlated signals were spatially filtered and the phase of the signal at each depth was converted to the displacement with the relation
| (1) |
where d is the displacement, c is the sound speed, ω0 is the center angular frequency of the scanning signal, and ϕ is the phase difference between the reference signal and the tracking signal at each depth. A simplified block diagram of the procedure is shown in Fig. 5 below.
Figure 5.
A block diagram showing the measurement and processing procedure.
Phantom preparations
Two phantoms were made for the experiments: a gelatin phantom and a gelatinoil phantom. The gelatin phantom composition was originally developed to approximate the elastic properties of prostates and has been used for ex-vivo prostate crawling wave measurements (Castaneda et al., 2007; Hoyt et al., 2006; Castaneda et al., 2009). The phantom contains 1.8 L of water, 184 g of gelatin (300 Bloom porcine skin gelatin, Gelatin Innovations, Inc. Schiller Park, IL, USA), 16.2 g of salt, and 2.7 g of agar (Difco Agar, Bector & Dickinson, Sparks, MD, USA). The oil-gelatin phantom, which can be made with significant viscosity, contains 1.8 L of water, 144 g of gelatin, 180 ml of safflower oil, and 27 ml of surfactant (Ultra Ivory, Procter & Gamble, Cincinnati, OH, USA). The water-gelatin mixture was warmed up to 90 °C to induce a molten state. Then the mixture was cooled to 55 °C, and the oil and surfactant were mixed in, and then emulsified (Madsen et al., 2003). Both phantoms were stored in a refrigerator and brought to room temperature for at least four hours before scanning.
Temperature and Pressure Measurement Setup
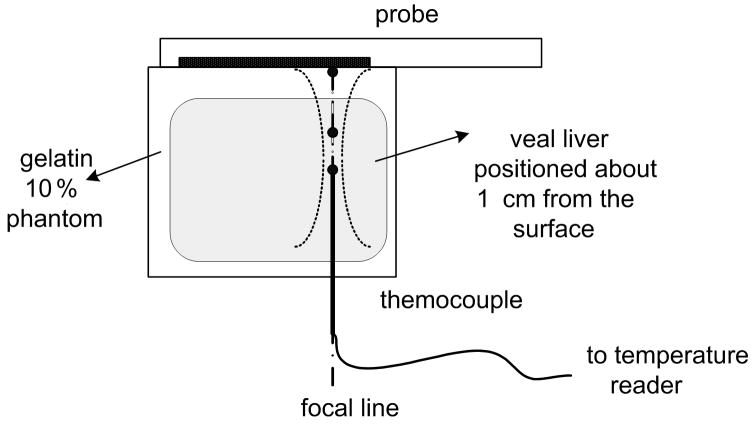
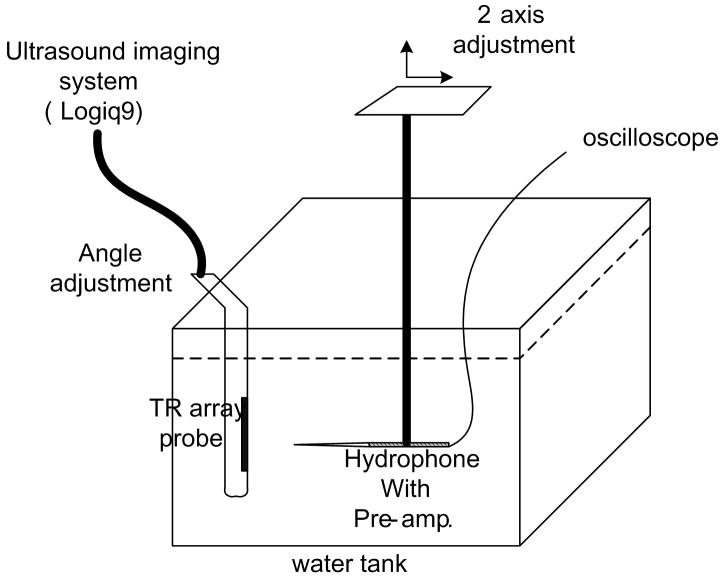
In order to assess the safety of the proposed data acquisition system, temperature and pressure measurement were taken. Temperature measurements were done with the experimental setup shown in Fig. 8 (a). A veal liver sample was cut and suspended in a gelatin background spanning the depth of 1 cm to at least 4 cm to cover the region of ARC wave pushing pulse excitation. The temperature rise was measured at several locations along a focal line with both normal focusing and axicon focusing. A T-type thermocouple (Omega, Stamford, CT, USA) with 0.3 mm diameter (to minimize thermal loading of the thermocouple wire itself) was used for the experiment. The thermocouple output was measured with a multichannel thermocouple reader (USB-471B, Omega,Stamford, CT, USA) and recorded by a computer.
Figure 8.
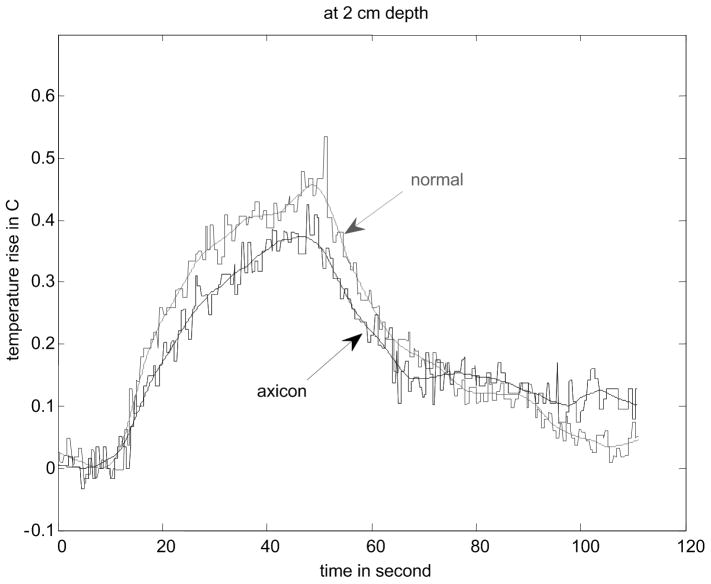
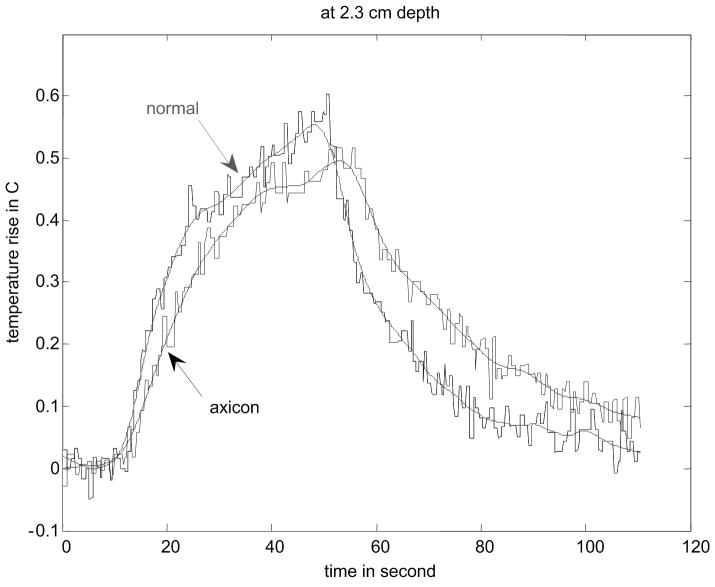
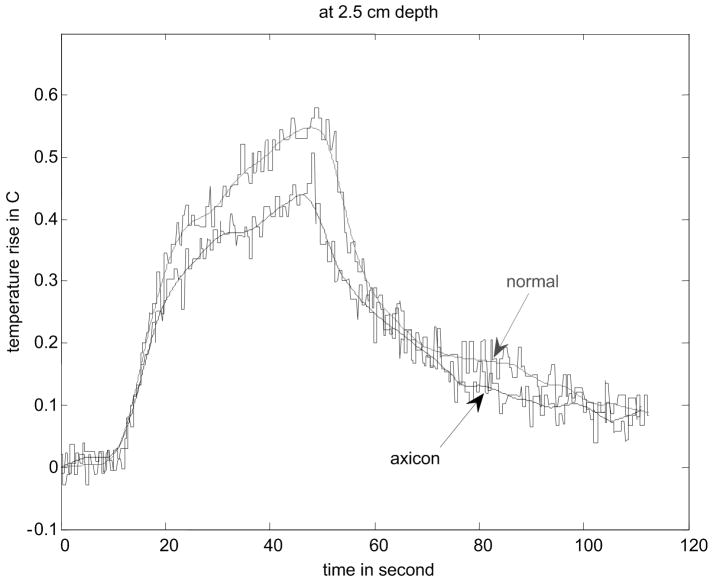
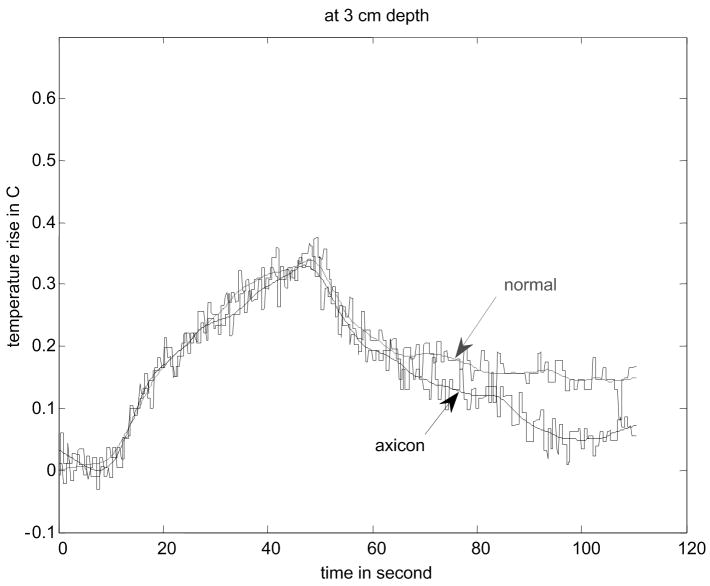
Results of temperature elevation measurement for a veal liver embedded in the gelatin phantom. (a) shows the experimental setup. (b) - (e) show the temperature elevation for a single run of the arc scanning for both normal and axicon mode focusing at focal depths of 2cm, 2.3cm, 2.5cm and 3cm respectively.
The pressure generated by the pushing pulses was measured to assess the potential mechanical effects of ultrasound exposure using the setup shown in Fig. 9 (a). The ultrasound probe, modified for the ARC wave scanning, and a hydrophone(HGL0085, Onda, Sunnyvale, CA, USA) were immersed in a water tank filled with degassed water. Both were mounted on fixtures that allowed the angle and relative position to be finely adjusted. The hydrophone was carefully aligned with the focal point of the transducer by peaking the received signal. The output voltage was measured by an oscilloscope and recorded. This voltage was converted to pressure using the hydrophone calibration curve.
Figure 9.
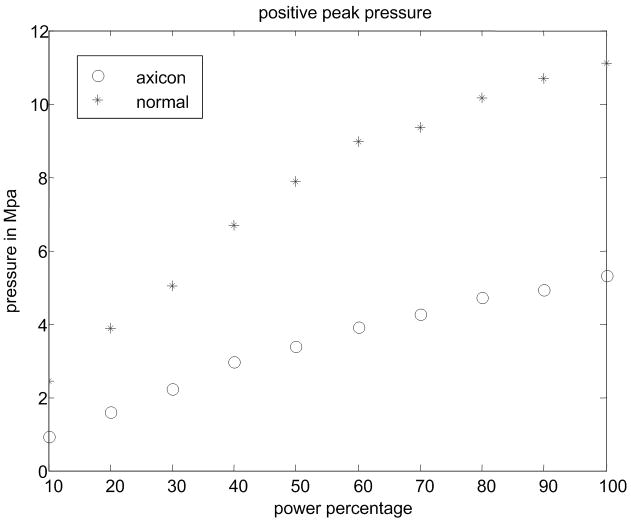
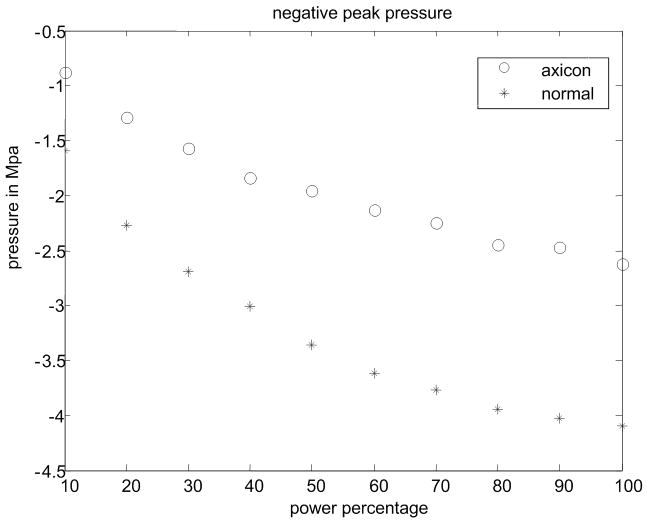
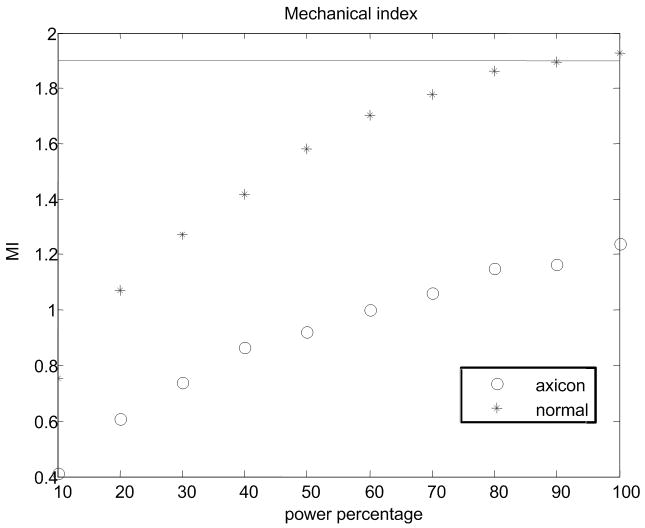
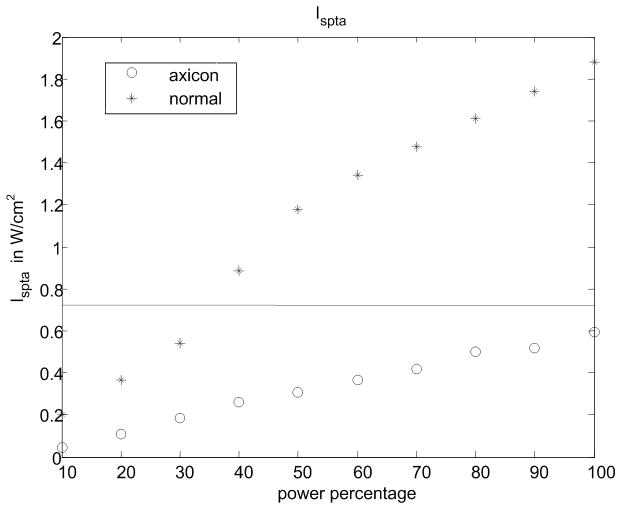
(a) Experimental setup for the pressure measurement. (b) Peak positive pressure as a function system power setting. (c) Peak negative pressure as function of system power setting. (d) Calculated MI as function of system power setting. FDA safely level of 1.9 is shown as a line. (e) Ispta for normal and axicon mode focusing with the safety recommendation of 720 mW/cm2 marked by a line.
Results
Generation of ARC datasets
Fig. 6 shows the displacements caused by the radiation force-generated shear waves in a gelatin-oil phantom. Fig. 6(a) - (d) shows the displacements generated from the shear wave traveling left to right, generated by a pushing pulse on the left hand side of the ROI. Fig. 6(e) - (h) are the displacement cause by the wave traveling right to left. Fig. 6(a) - (d) and Fig. 6(e) - (h) correspond to the displacements at 2.325 ms, 3.525 ms, 4.725 ms, and 6.325 ms after the push, respectively. The x axis is lateral location in the ROI in mm, and the y axis is depth in mm. The gray scale brightness in these images corresponds to the level of displacement. The push beams used standard focusing delays to focus at a depth of 2.5 cm. The displacement waveforms can be seen traveling across the ROI in the filmstrip format.
Figure 6.
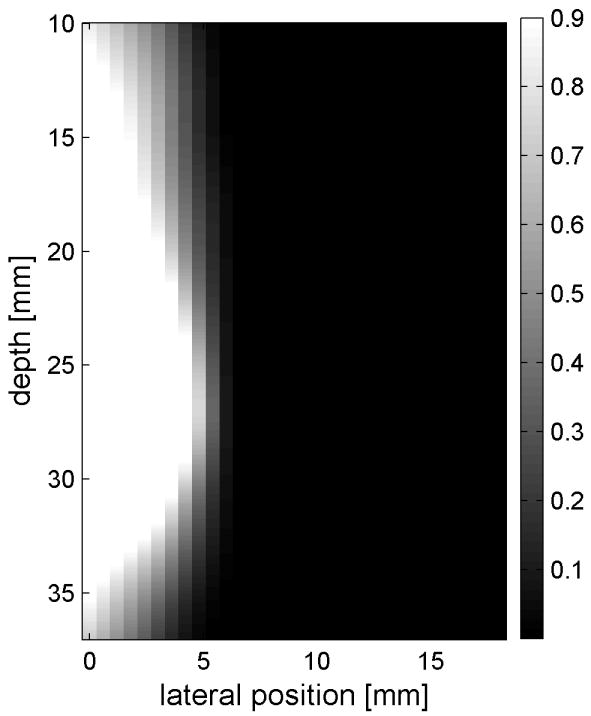
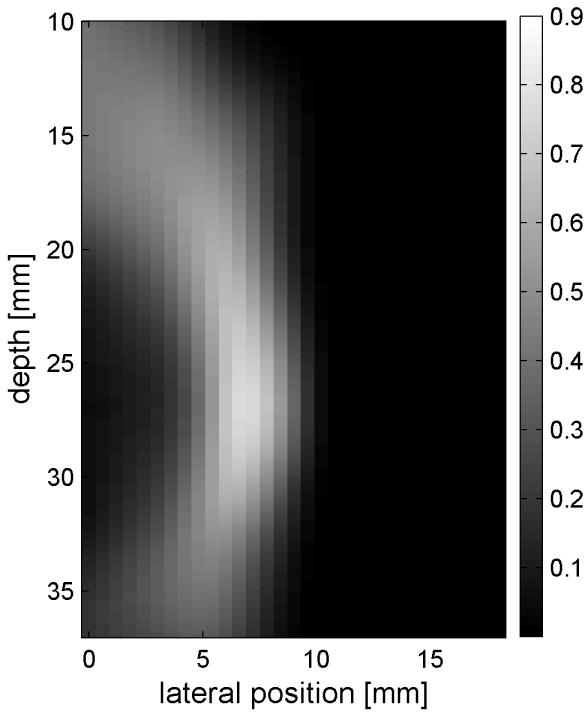
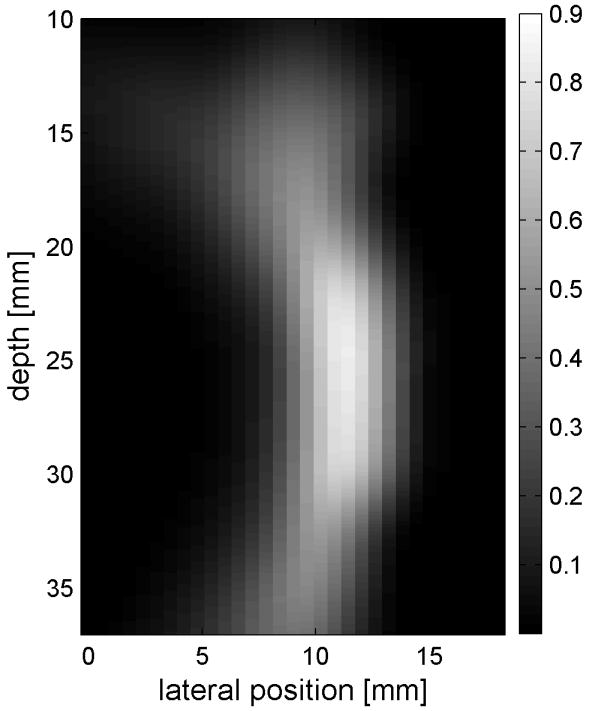

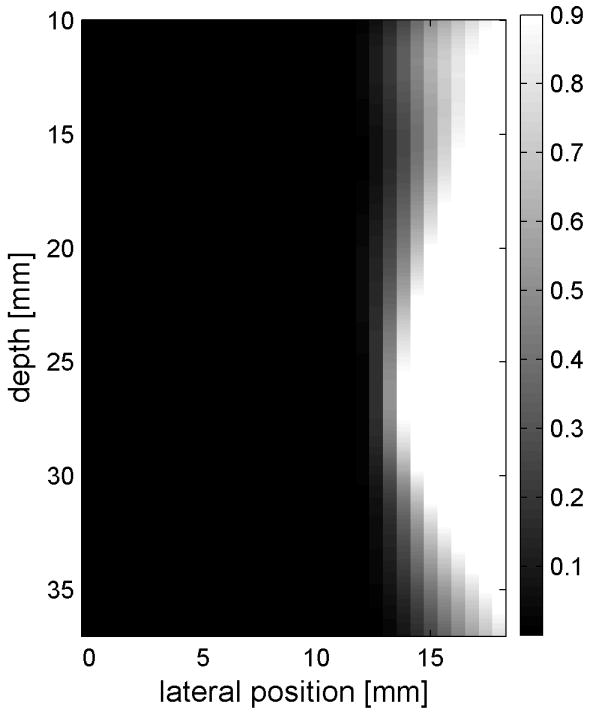
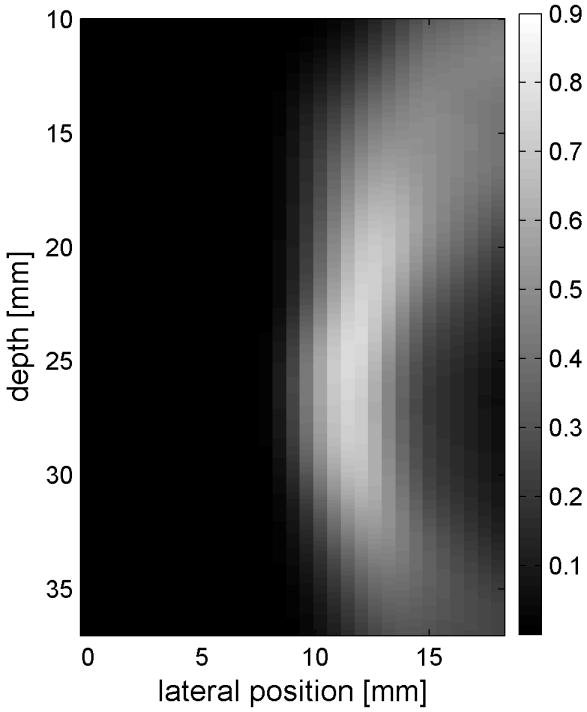
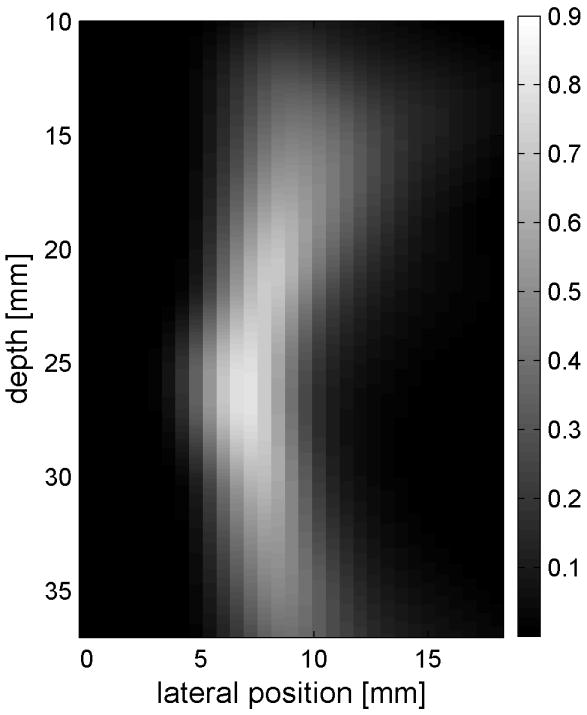
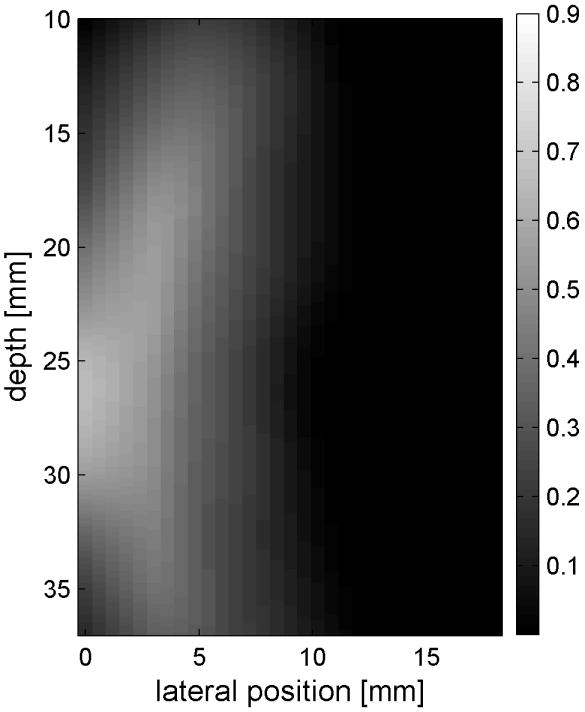
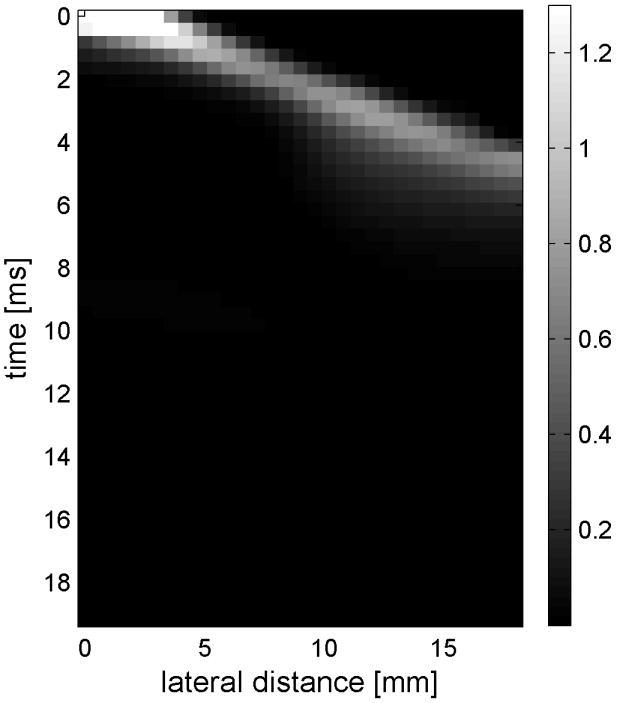
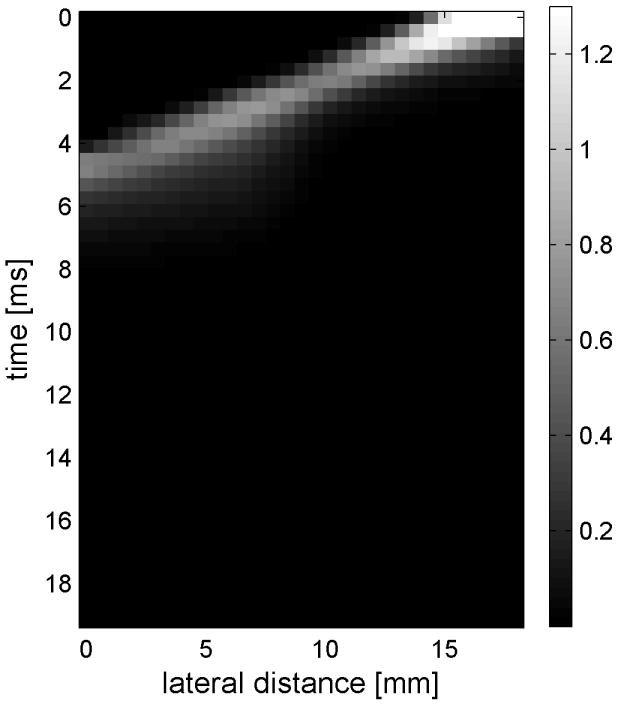
Shear wave generated in a safflower oil -gelatin phantom using normal focusing. (a) -(d) shear waves from left push, (d)- (h) from right push at 2.325ms, 3.525ms, 4.725ms, and 6.325ms after the push respectively. (i) shows slow time -lateral dimension slice of the data at focal depth of 2.5 cm from the left push. (j) shows slow time -lateral dimension slice of the data at focal depth of 2.5 cm from the right push.
Fig. 6(i) and 6(j) show the displacement data in a different way, displaying the data at one depth over time. These figures represent the displacements at the push focal depth of 2.5 cm. The x axis in these figures is again lateral location in the ROI in mm, but the y axis is now time after the push in ms. In Doppler imaging this time is often referred to as slow time or packet time. Analysis of Fig. 6(j) shows that the phantom has a shear speed of 3.6 m/s.
Similar results are shown for the pure gelatin phantom in Fig. 7. Fig. 7 also highlights the difference between normal focusing mode and the axicon focusing mode. Shear wave propagation from the left push with normal focusing mode is shown in Fig. 7(a)-(d), while Fig. 7 (e)-(h) show corresponding axicon mode shear wave propagation. Again the sampling times are 2.325 ms, 3.525 ms, 4.725 ms, and 6.325 ms after the push, respectively. Fig. 7 (a)-(h) have the same displacement scale, to reveal the slight loss of maximum amplitude for the axicon focus mode. Fig. 7 (i)-(l) show normalized displacement profiles as a function of depth for lateral locations 4.2 mm, 7.2 mm, 11.4 mm and 17.4 mm, respectively.
Figure 7.
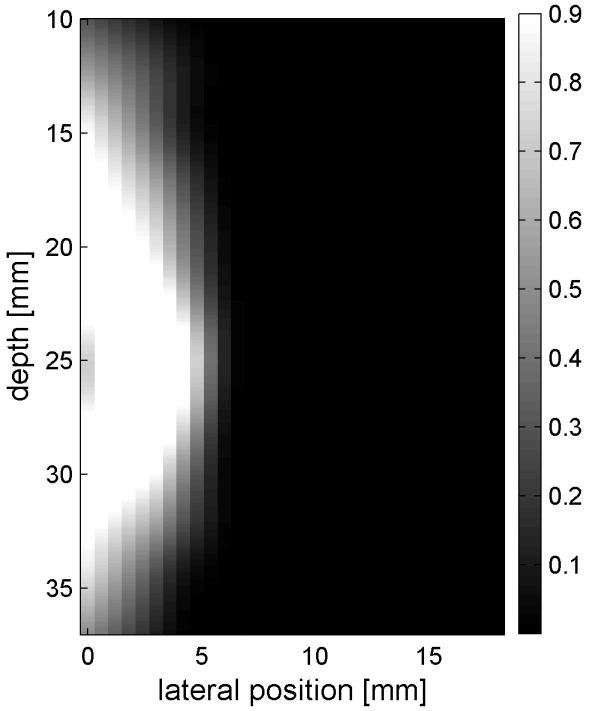
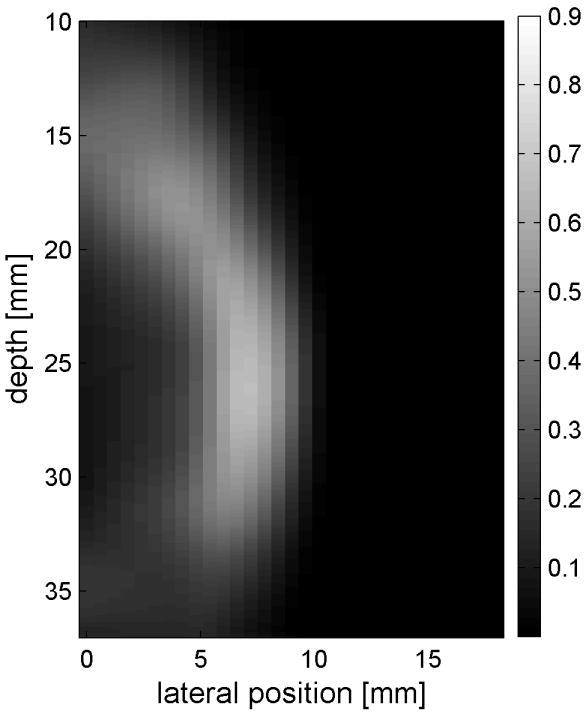
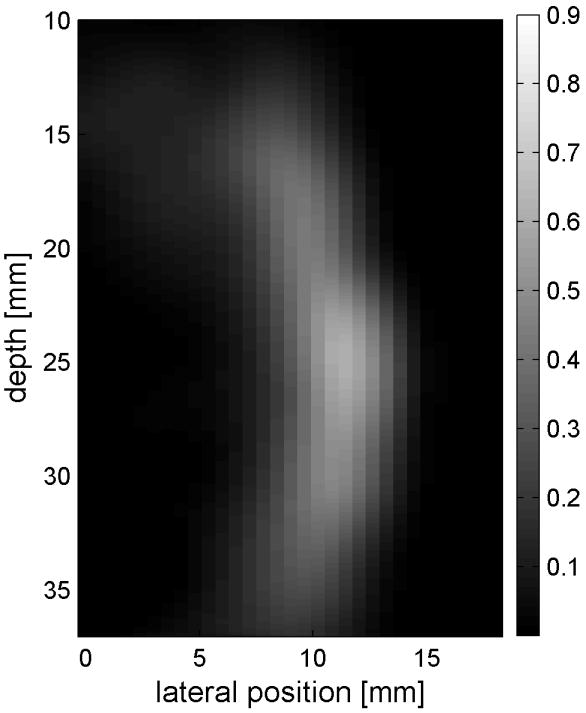
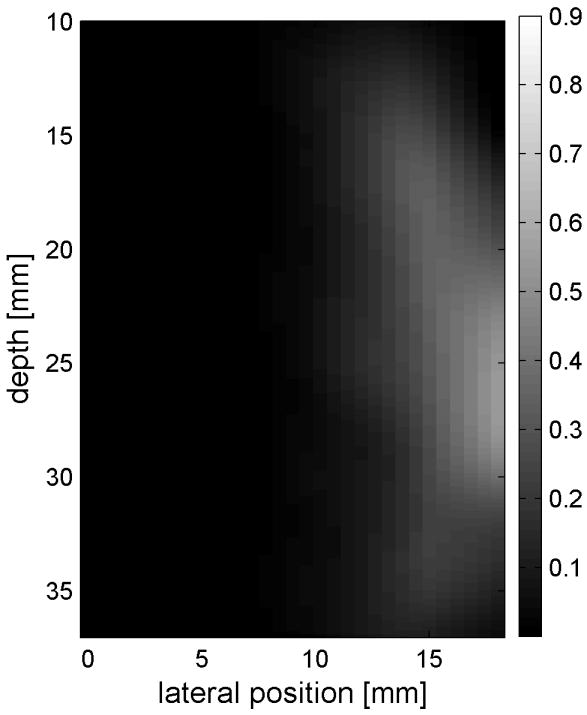
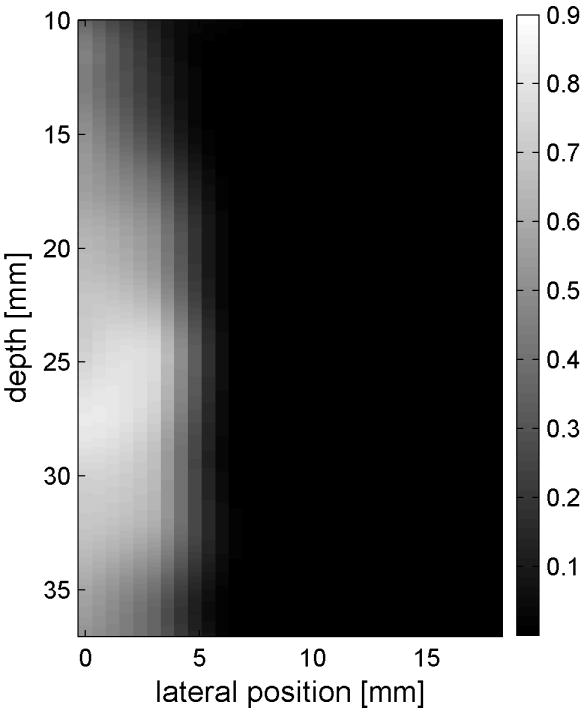
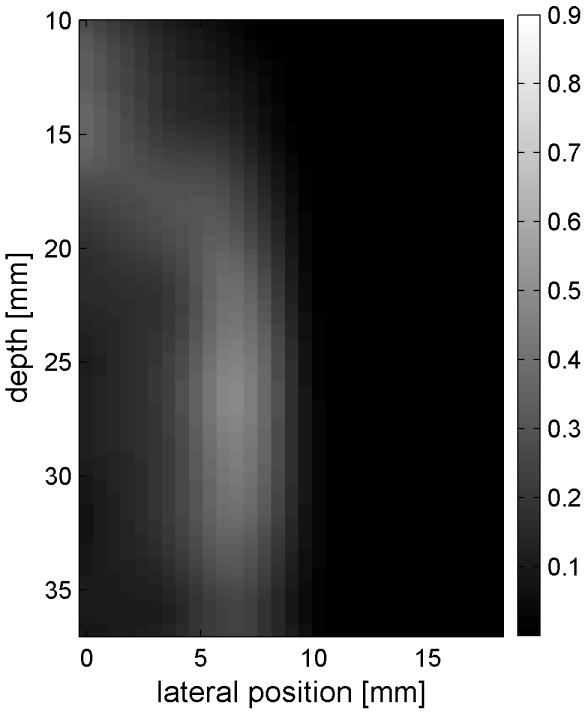
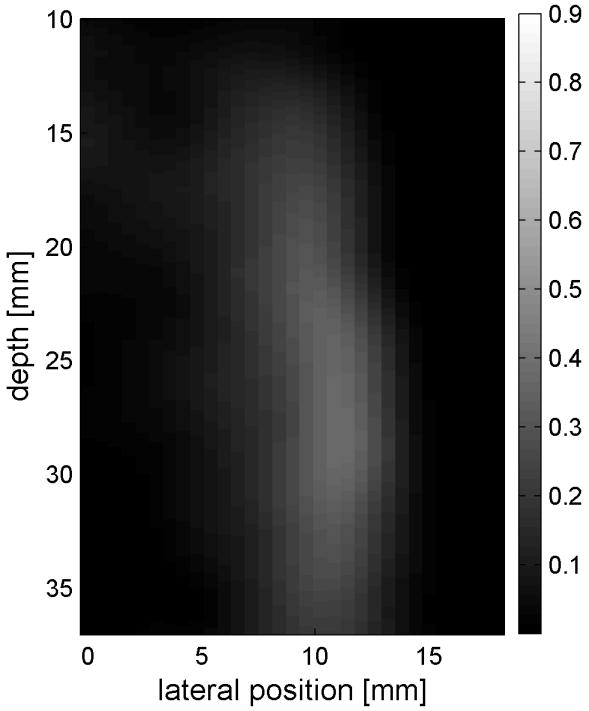
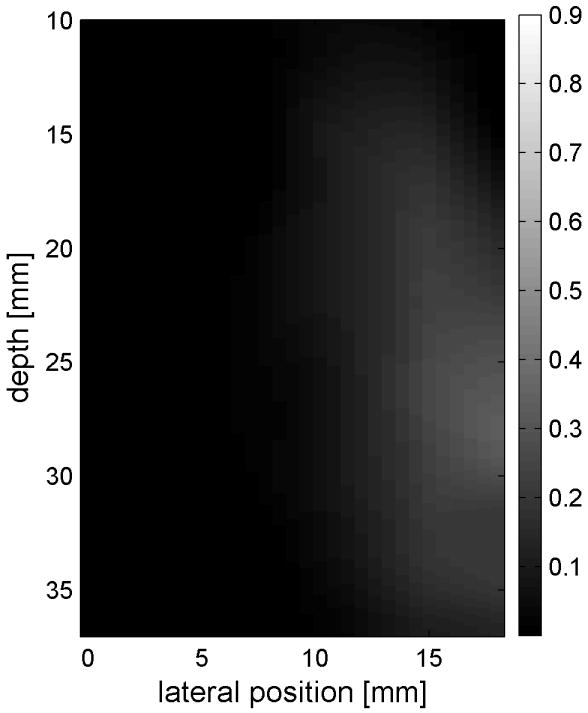
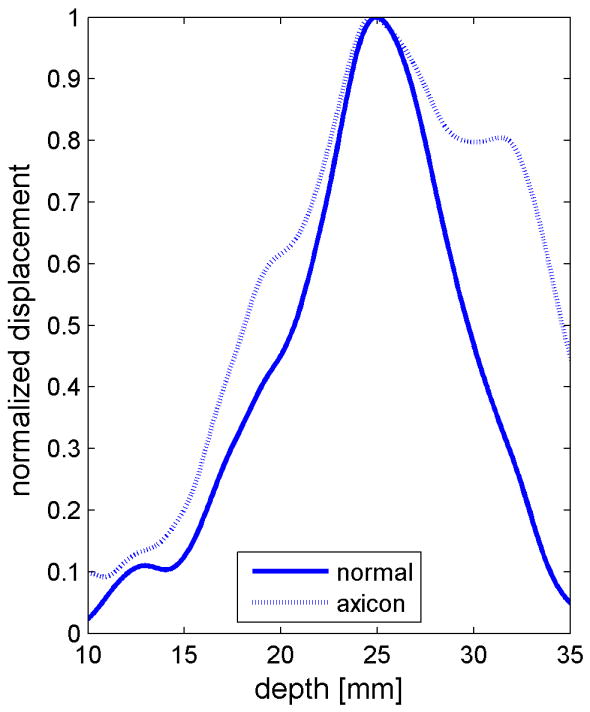
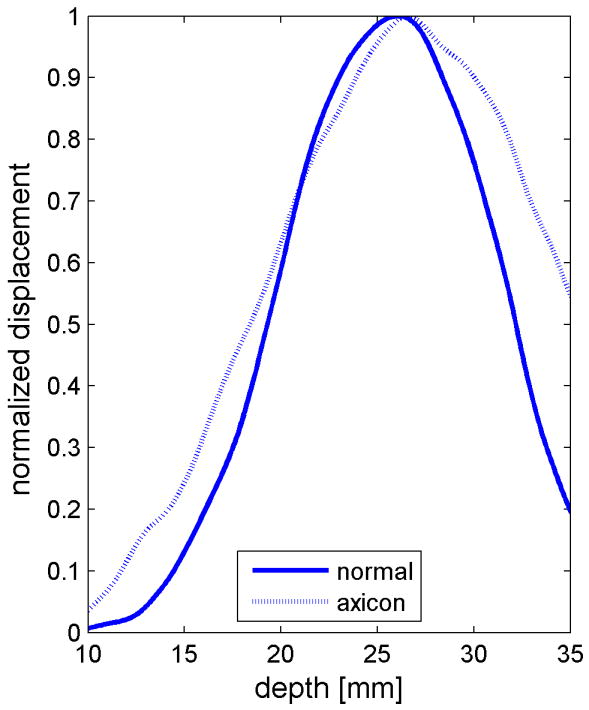
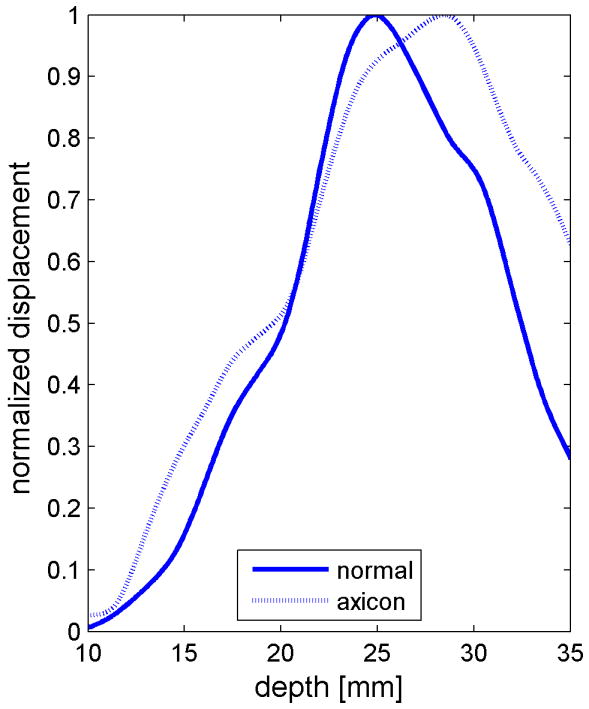
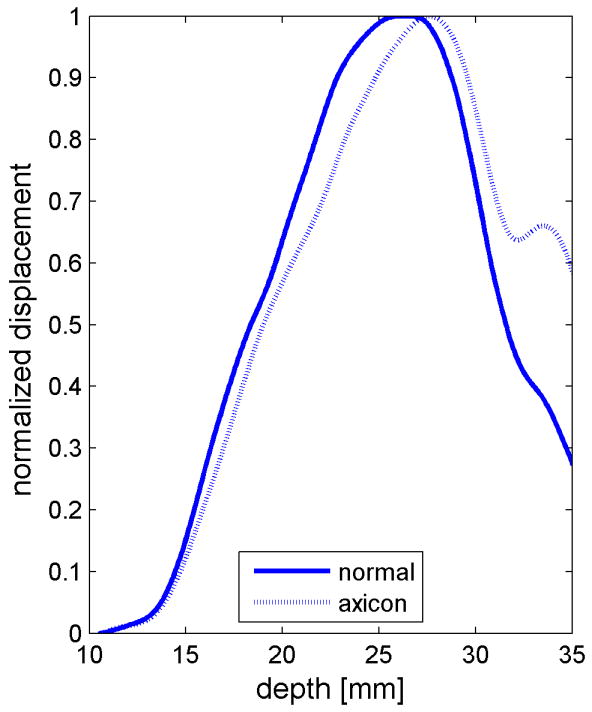
Comparison of normal and axicon mode focusing for the gelatin phantom. (a)-(d) shows shear wave from left push with normal mode focusing at 2.325ms, 3.525ms, 4.725ms, and 6.325ms after the push respectively. (e)-(h) shows corresponding images obtained from axicon focusing. (i) - (l) shows normalized vertical profile of the wave front at (i) 4.2mm, (j) 7.2mm, (k) 11.4mm, and (l) 17.4mm from the left respectively.
Safety measurements
To assess the safety of the proposed technique using the current system, two experiments were performed: measuring temperature elevation and pressure levels.
The temperature increase inside a specimen depends on many factors. These factors include thermal properties of the specimen and the surrounding gelatin phantom, ultrasonic power level, phantom shape, boundary conditions, room temperature and temperature of the probe itself. Our main objective is to determine the maximum increase in temperature inside the specimen under the conditions that are typical of our experimental routine. To determine the maximum temperature rise that might occur in tissue with the scan sequences and focusing described, thermocouple measurements were made. Fig. 8(a) - (d) shows the results of these thermocouple measurements using the setup shown in Fig. 8(a) for both the standard focus and the axicon focus at depths of 2.0 cm, 2.3 cm, 2.5 cm, and 3.0 cm respectively. The maximum temperature rise observed for a single ARC collection was under 0.7 °C, which is below the 1.0 °C threshold cited by Nightingale et al. (2002). If the ARC wave scan sequence is used repeatedly, the temperature rise can become significant. To avoid large temperature rises, the minimum time between scans was 2 minutes.
Pressure measurements with the setup shown in Fig. 9(a) were made at power settings ranging from 10% to 100% with 10% intervals for both normal focusing mode and axicon focusing. Note, that 100% refers to an arbitrary maximum setting on the system. The pressures recorded are shown in Fig. 9(a) and Fig. 9(b) for both positive and negative peak pressure, respectively, as a function of power level. The reported pressures have been derated by 0.3 dB/MHz/cm. The peak positive pressure after derating was 11 MPa for the normal focusing and just over 5 MPa for the axicon focusing. The center frequency of the pushing pulse was 4.5 MHz. Estimates of the MI and ISPTA were calculated using the hydrophone data and are shown in Fig. 9(c) and Fig. 9(d) respectively. The FDA recommended limits are shown as lines on these plots (NEMA, 2004; U.S. Department of Health and Human Services, 2008). The MI would remain below the recommended level of 1.9 for power levels below 90% for normal focusing mode, while for axicon focusing the MI remains below the limit for all the measured power settings.
ISPTA was estimated by calculating the average intensity of the recorded pushing pulse and then multiplying by the duty cycle. The measured ISPTA values remain below the recommended level of 720 mW/cm2 for normal focusing mode if the power setting is 40% or less. For the axicon focusing the measure ISPTA is below the limit for all measured power settings. Of course the time between pushing pulses could be increased to reduce the ISPTA for the normal focusing mode, or to allow increased pushing amplitude.
Discussion
Synthetic interference pattern and system trade-offs
The shear waves generated by the left and right push pulses are impulsive waveforms as shown in Fig. 6 and Fig. 7. Sinusoidal crawling waves, on the other hand, result from the interference of two continuous periodic waves traveling in opposite directions with a small frequency difference, Δf, imposed between the sources. System limitations prevent the simultaneous generation of two continuous wave sources and tracking of the resulting shear wave interference. Instead, the system collected displacement time histories for the left and right push waves separately. These displacement time histories can then be processed to produce a synthetically generated crawling wave. The details of this procedure are described in a companion paper, for completeness a brief description is provided here. If the tissue strain is small, then the displacement will be linear and the superposition principle can be used, as explained and experimentally verified in a paper by Hah et al. (2010) and Mariappan et al. (2009). An interference pattern between the displacement waveforms created by one or a few left and right pushes can be calculated. Instead of pushing multiple times, a synthetic waveform is created by convolving the displacement waveform for a single push with a pulse train of discrete delta functions with the desired time spacing repetition period. The resulting waveform can be filtered around a desired frequency. A synthetic waveform can be constructed for both the left and right pushes. Again exploiting the linearity of the system, the left and right waveforms can be delayed and added together to create a composite waveform that simulates the interference of the shear waves from the left and right pushes in the medium.
This synthetic approach represents a compromise that allows exploration of the concept within the hardware limitations of a standard ultrasound system. The ideal system for generating radiation force based crawling waves would involve a pair of line sources, that generated shear waves inside the tissue. The multiple sources would be parallel and of well determined geometry. The interference would be generated such that it was accurately tracked by the imaging system. One possible solution, might be to use separate pushing transducers. These transducers may be in a very different frequency range, to allow the imaging transducer to track the tissue while the pushing pulses were active. This solution would solve many of the technical challenges, but would still have acoustic power issues for human imaging.
To avoid the alignment and positioning of multiple transducers, a single transducer array is used for the work in this paper. Also, minimal changes were made to the standard ultrasound system. To mimic the mechanical shear sources used in the original crawling wave experiments, the radiation force generated on the left and right of the ROI would be sinusoidally varying with the required frequency difference. However, the practical reality of using a single transducer for generating both the left and right pushes and also the tracking pulses makes this impossible. The next alternative would be to fire shorter pushing pulses at a pulse repetition frequency (PRF) corresponding to the frequency desired on both the left and right. In between these pushing pulses the tracking pulses would be fired. This would generate periodic displacement shear waves with frequency content enhanced at the PRF and it harmonics. Chen et al. (2009) describes such a sequence for the SDUV technique. However, using standard ultrasound systems and probes creates an even more restrictive limitation to avoid component break-down at high duty cycles. It is not feasible to fire these long streams of pulses for the extended amount of time required to scan an entire ROI using a conventional imager.
The next compromise is to synthesize the repeated firings to calculate the interference pattern. This synthetic version has the disadvantage that noise will also be replicated. This can lead to poorer signal-to-noise ratio (SNR) as compared to using the actual displacements caused by repeated pushing. This also assumes that the impulsive displacement waveform that was actually collected has returned to the zero displacement position at the conclusion of the data collection. If this is not the case, the modified waveform will introduce some error in the analysis.
It should also be noted, that all of the information has been captured in the original recorded displacement waveforms. The waveform created by convolution with the pulse train is useful in helping to better demonstrate a periodic response and for allowing subsequent processing steps to match those of earlier sinusoidal crawling wave experiments. For synthetically generated crawling waves the signal-to-noise ratio of the displacements is lower than actually interfering waves in space. In the physical crawling wave experiment, two shear waves are generated simultaneously in the tissue and the interference pattern causes characteristic motion in the tissue. If both shear wave sources have the same amplitude and phase, then at the central point of constructive interference the amplitudes will add to give twice the amplitude of the individual waves. Assuming the displacement noise is a zero mean Gaussian with variance given by σ2, N(0, σ), and that the amplitude of the sum of the two shear waves is 2A at the point of constructive interference, then the SNR is 2A/σ. For a single source the SNR would be A/σ. Repeating the experiment two times with the single source and summing would give a SNR of . When the displacements from the right-going and left-going waves are summed, the SNR is also ≈ 1.4A/σ. The SNR for the synthetic case is not as good as the SNR for the physical crawling wave. However, our synchronized system allows repeated collection for averaging. The background motion is not coherent over the multiple repeated pushes, while the shear wave motion will be and thus averaging can improve the SNR.
In the synthetic crawling wave method, the left going and right going shear waves are tracked separately. One advantage of this method comes from the fact that there are two waves that have different propagation paths to any point in the ROI. Using the information from the two waves provides better estimates of the shear speed than a single wave. There are numerous ways in which the multiple shear wave data can be combined. The shear speed can be estimated separately and the estimates can be combined by weighted averaging. For example, the estimates from the closer source or the estimates with higher ‘quality’ can be emphasized. More complicated inversion algorithms can be devised to determine the shear modulus properties in the ROI with the shear displacements from both directions used as inputs to the inverse problem (Lin et al., 2010, 2011). This can lead to improved estimates, mathematical stability of the algorithms, more robust estimation and even allow estimation of other physical parameters such as viscosity. One can also synthetically create interference patterns similar to those that would be created by the mechanical crawling wave experiment. Future work will be done to compare the results for processing the data as an interfering wave to other more standard methds of calculating shear velocity. We also retain the multiple source direction and geometry, which has advantages for both the interference methods and the more standard methods of shear wave processing.
Axicon focus
There are several motivations for using an axicon focus. First, by spreading the acoustic energy, and therefore the radiation force, over a larger depth of field the shear wave depth of field should also increase. Second, the spreading of the energy reduces the overall peak pressure, which could allow for increased pushing in a MI limited situation. For our experimental system, the pushing was limited by hardware concerns. Third, the longer excitation region should create a more plane-like shear wave that is easier to track and simplifies the velocity estimation. The increased depth of field and plane-like shear waves could also be achieved using the rapid firing of multiple pushes as described by Bercoff et al. (2004b).
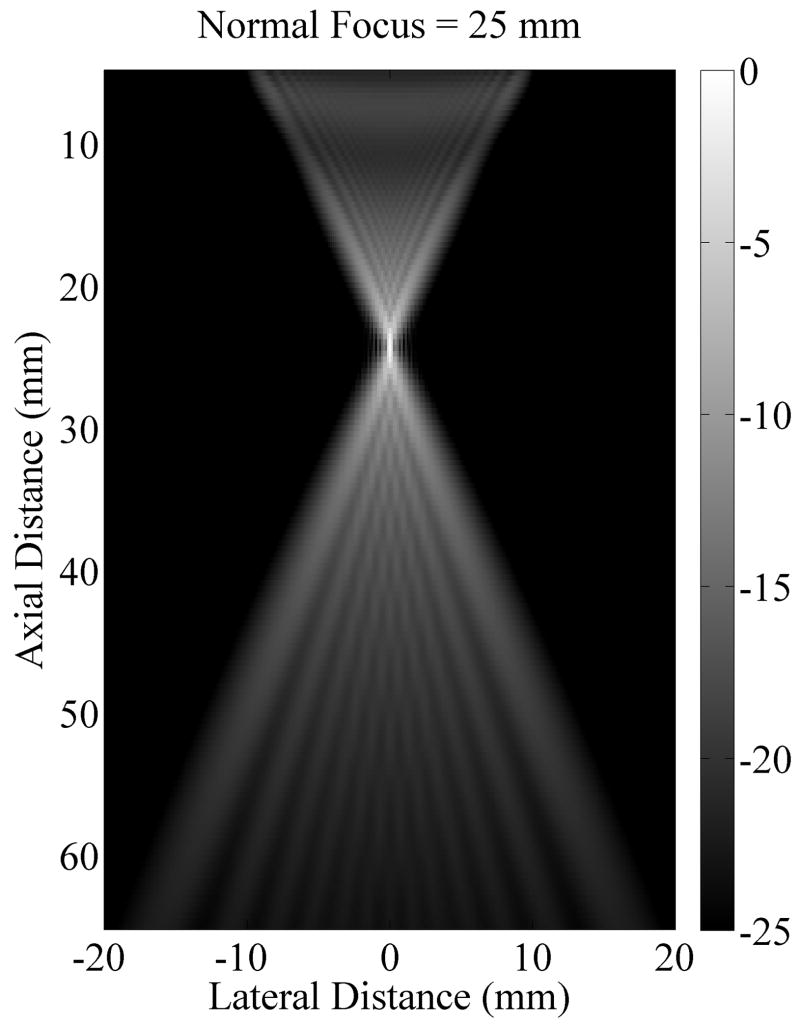
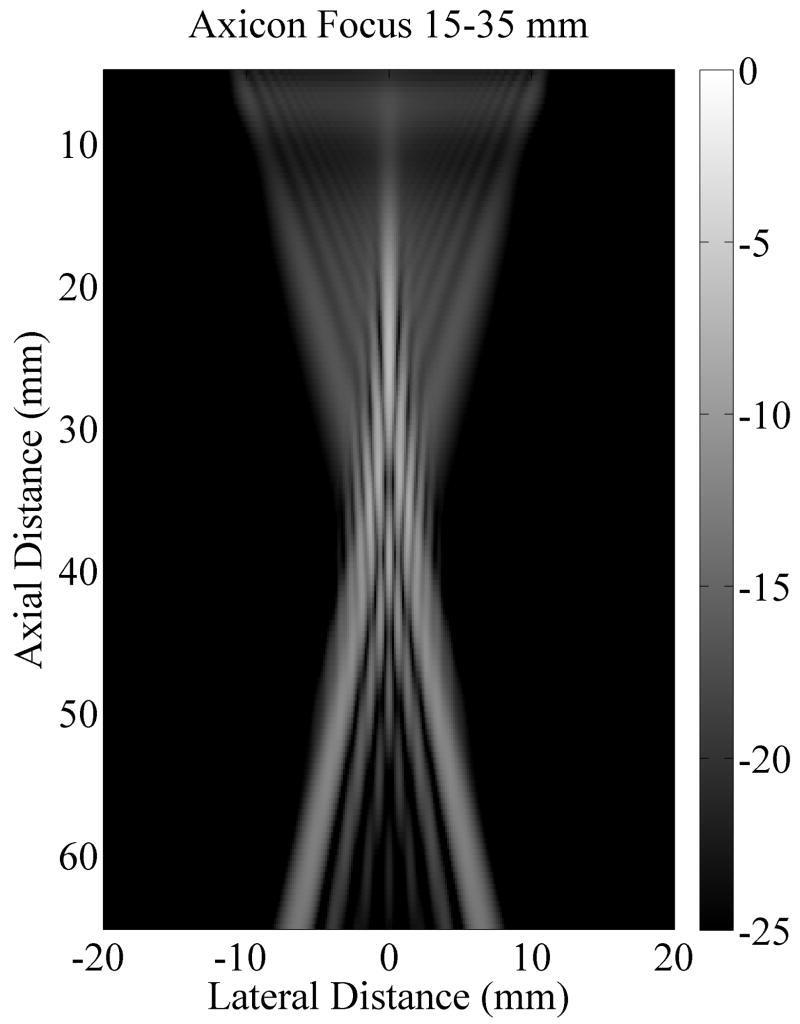
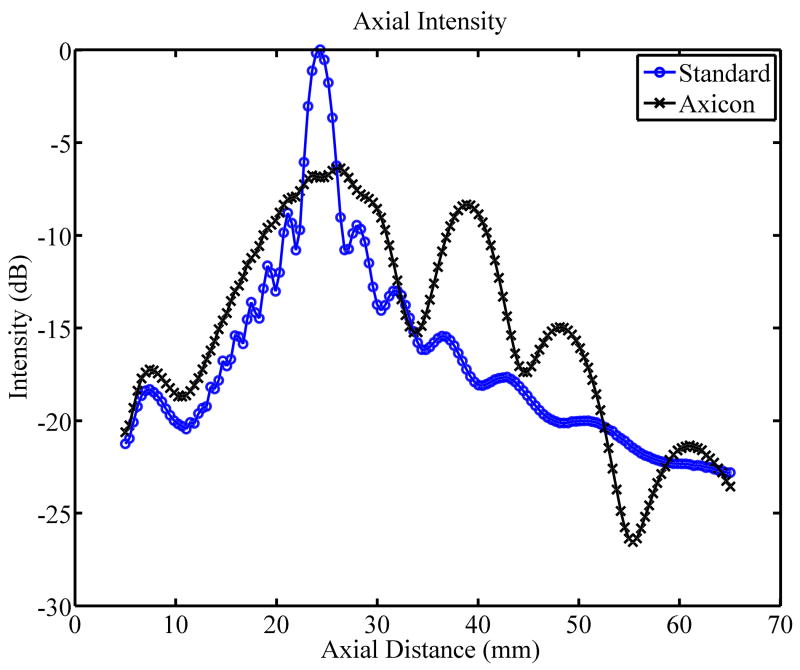
Axicon focusing provides an elongated focal region which may generate a more uniform push over depth. The trade-off is a loss of peak intensity. A Field II (Jensen, 1996; Jensen and Svendsen, 1992) simulation of the standard focusing beam and the axicon focus beam shows that the peak intensity for the axicon focus is 6.4 dB lower than for the standard focusing. Fig. 10(a) and Fig. 10(b) show the simulated field for the standard and axicon focus beams respectively. Fig. 10(c) shows the field values along the axis for both types of beamforming. The decreased peak intensity for the axicon focus and the increased depth of field is seen. The axicon beam has a more complicated structure. In the far field the beam is narrower, but in the region of the focus the beam is slightly wider. There is more sidelobe structure in the axicon beam. The sidelobes can act as a wider pushing source and may dampen higher frequency shear responses. However, for techniques which solve the wave equation the multiple sidelobes should not effect the estimated shear speed. More simulation and measurement will be required to understand and optimize the transmit field for the shear push generation.
Figure 10.
Comparison of the radiation patterns for the axicon and standard focusing. (a) Simulated radiation pattern for a standard focus beamforming scheme with the focus at 25 mm. (b) Simulated radiation pattern for an axicon focus beamforming scheme with the near focus at 15 mm and the far focus at 35 mm. Gray scale indicates intensity in dB for (a) and (b). (c) Axial profiles for standard and axicon focusing.
The experimental effects of the axicon focus on the displacements can be seen in Fig. 7, where the axicon focusing does result in slightly reduced curvature. There is however, an overall reduction in the displacement amplitudes, which could be compensated with increased transmit pressure for a system without the thermal limitations of our experimental platform. The normalized axial profiles in Fig. 7, show a slight increase in the depth of field for the axicon shear wave excitation. The experimental improvements of the axicon focusing are not dramatic, but the concept does allow for a trade-off between the depth of field and the peak pressures. Future work will involve more study of the actual parameters of the axicon focus.
Challenges for radiation force based crawling waves
The advantages of radiation force sources over mechanical sources do not come without cost. The size of the induced displacements is typically smaller for the radiation force based methods. The amount of displacement induced by radiation force is proportional to both the amplitude and length of the pushing waveform. To increase the displacements, the pressure or the pulse duration must increase. The high pressures and long pulses also increase the burden on the ultrasound system and probe. Typical ultrasound pulsers are designed for the low duty cycle (<1%) operation that occurs in standard B-mode and color-flow imaging. High voltage multiplexing switch circuitry is also designed for low duty cycle operation. Pulse sequences that involve repeated use of radiation force may push the limits of the thermal design of these devices. Heating in the lens of the transducer can also be a problem for such modes.
Acoustic power is a major concern for any radiation force based method. The amount of heat generated by an ultrasonic wave in an absorbing medium is
| (2) |
where Q is the time rate of the heat generated per volume (W/m3), α is the absorption coefficient (Np/m), and I is the intensity of the ultrasonic wave. Not coincidently, the radiation force is proportional to the heat generated. This means there is a trade-off between displacement signal-to-noise ratio, collection time, and tissue heating (Bouchard et al., 2009). Care must be taken not only to protect the imaging system itself but also to avoid harming the tissue. Herman and Harris (2002) further address the safety issues posed by radiation force pulse sequences.
ISPTA is defined as the value of the temporal-average intensity at the point in the acoustic field where the temporal-average intensity is a maximum (U.S. Department of Health and Human Services, 2008). For sinusoidal tone bursts, ISPTA can be estimated using the following expression (Deffieux et al., 2009a)
| (3) |
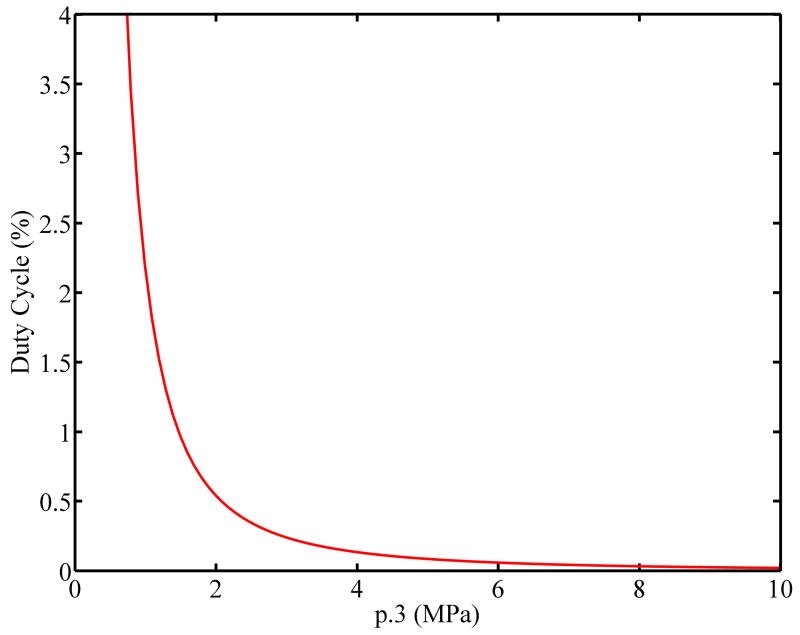
where psp.3 is the spatial peak pressure derated by 0.3 dB/cm/MHz, ρ is the density of tissue (≈1000 kg/m3), and c is speed of sound (≈1500 m/s). The duty cycle is the ratio of the length of the pushing tone burst to the total time. The value of ISPTA calculated using Eq. 3 for our experimental data would be slightly different because the experimental pressure waveform is not a perfect sinusoid and the measured peak pressure is larger than the amplitude of the best fit sinusoidal wave-form. Fig. 11 illustrates the trade-off between the derated peak positive pressure and duty cycle for an idealized tone burst push pulse in light of the FDA limit on ISPTA of 720 mW/cm2. As the peak positive pressure increases, the allowable duty cycle decreases. The trade-off leads to a frame rate limitation for radiation force based systems, and highlights the need for massively parallel acquisition to avoid motion artifacts. This simple analysis does not take into account the non-linear propagation effects.
Figure 11.
Graph showing the trade-off between peak pressure and duty cycle for ideal tone burst radiation force systems. As pressure increases the maximum allowable duty cycle becomes smaller.
The Mechanical Index (MI) index and spatial peak temporal average of the intensity (ISPTA) were also measured. MI is a parameter that limits the ultrasound pressures to avoid acoustic cavitation and the resultant risk of tissue damage. The MI is defined as
| (4) |
where pr.3 is the peak rarefactional pressure derated by 0.3 dB/cm/MHz at the location of the spatial peak pressure, zsp, and fc is the center frequency of acoustic waveform. The FDA guidelines state that MI should be lower than 1.9 (NEMA, 2004; U.S. Department of Health and Human Services, 2008). However, it should be noted that the MI was designed for very short pulses and may be less applicable to the very long pulses required for radiation force based methods (Church, 2005). Still, the pulses used to generate radiation force are not likely to produce significant cavitational damage.
While falling short of a complete acoustic power analysis, this measurement data shows that the ARC wave sequences, as implemented on our current system, can be operated within the FDA guidelines and still produce meaningful data. Future studies will show results in more relevant excised tissues. Additionaly, the system will be limited to prevent the contact temperature of the probe from rising above the required limits. (IEC, 2007).
Many of the challenges and trade-offs discuss are related to the experimental platform used for this study. A system designed with separate pushing transducers, with well known geometries and frequencies outside the band of the imaging transducer could allow for true radiation force generated crawling waves. A high frame rate imaging system such as that described by Bercoff et al. (2004b) would allow for more efficient use of the acoustic power. Similarly, increased parallel receive beams would also have the same effect. Redesigned multiplexer switching or the elimination of the multiplexer would allow for higher duty cycles. Dedicated or redesigned power supplies and transmitter boards would also be required for increased duty cycles.
Conclusions
A clinical ultrasound system was modified to produce a set of shear waves generated by radiation force pulses on the right and left side of a region of interest and traveling in opposite directions. Shear wave displacements are generally below 2 μm and benefit from some averaging and noise reduction, including removing the effects of ambient tissue motion. A synthetic interference pattern can be calculated using the measured shear displacement. This data can be used to calculate a quantitative estimate of the Young’s modulus, or stiffness, of the tissue, which is further described in a companion paper. The synthetic method was a compromise that allowed study of the interference phenomenon using a standard ultrasound system. This method is not ideal for clinical use because of the low frame rate and reduced SNR, but the synthetic method can still provide insight into the interference methods. The advantages and disadvantages of the synthetic crawling wave processing compared to more standard shear wave processing will be the subject of future study.
Measurements of the acoustic intensities and temperatures around the source and focus demonstrates that the modified probe can be operated below FDA guidelines, specifically below an MI of 1.9 and with temperature increases that are below 0.7 °C. The result is an integrated system capable of imaging and assessing the biomechanical properties of tissue regions. The configuration is suitable for imaging the prostate or for other small parts.
Acknowledgments
This work was supported by NIH Grant 5R01AG016317-07. Its contents are solely the responsibility of the authors and do not necessarily represent the official views of the NIH. We are grateful to Kai Thomenius, PhD and our co-investigators at Rensselaer Polytechnic Institute for many helpful suggestions.
Footnotes
This document is a collaborative effort
Publisher's Disclaimer: This is a PDF file of an unedited manuscript that has been accepted for publication. As a service to our customers we are providing this early version of the manuscript. The manuscript will undergo copyediting, typesetting, and review of the resulting proof before it is published in its final citable form. Please note that during the production process errors may be discovered which could affect the content, and all legal disclaimers that apply to the journal pertain.
References
- Bercoff J, Tanter M, Fink M. Sonic boom in soft materials: The elastic Cerenkov effect. Applied Physics Letters. 2004a;8412:2202–2204. [Google Scholar]
- Bercoff J, Tanter M, Fink M. Supersonic shear imaging: a new technique for soft tissue elasticity mapping. Ultrasonics, Ferroelectrics and Frequency Control, IEEE Transactions on. 2004b;514:396–409. doi: 10.1109/tuffc.2004.1295425. [DOI] [PubMed] [Google Scholar]
- Bouchard R, Dahl J, Hsu J, Palmeri M, Trahey G. Image quality, tissue heating, and frame rate trade-offs in acoustic radiation force impulse imaging. IEEE UFFC. 2009;56:63–76. doi: 10.1109/TUFFC.2009.1006. [DOI] [PMC free article] [PubMed] [Google Scholar]
- Burckhardt C, Hoffman H, Grandchamp P. Ultrasound axicon: a device for focusing over a large depth. J Acous Soc Am. 1973;54:1628–1630. [Google Scholar]
- Castaneda B, An L, Wu S, Baxter LL, Yao JL, Joseph JV, Hoyt K, Strang J, Rubens DJ, Parker KJ. Prostate cancer detection using crawling wave sonoelastography. SPIE. 2009;7265:726513. [Google Scholar]
- Castaneda B, Hoyt K, Zhang M, Pasternack D, Baxter L, Nigwekar P, Sant’Agnese A, Joseph J, Strang J, Rubens DJ, Parker KJ. Prostate cancer detection based on three dimensional sonoelastography. Proc IEEE Ultrasonics Symp. 2007:1353–1356. [Google Scholar]
- Chen S, Fatemi M, Greenleaf J. Quantifying elasticity and viscosity from measurement of shear wave speed dispersion. Journal of the Acoustical Society of America. 2004;1156:2781–2785. doi: 10.1121/1.1739480. [DOI] [PubMed] [Google Scholar]
- Chen S, Urban M, Pislaru C, Kinnick R, Zheng Y, Yao A, Greenleaf J. Shear-wave dispersion ultrasound vibrometry (SDUV) for measuring tissue elasticity and viscosity. Ultrasonics, Ferroelectrics and Frequency Control, IEEE Transactions on. 2009;561:55–62. doi: 10.1109/TUFFC.2009.1005. [DOI] [PMC free article] [PubMed] [Google Scholar]
- Church C. Frequency, pulse length, and the mechanical index. Acoustic Research Letters Online. 2005:162–168. [Google Scholar]
- Deffieux T, Montald G, Tanter M, Fink M. Shear wave spectroscopy for in vivo quantification of human soft tissues visco-elasticity. IEEE Trans Med Imaging. 2009a;28:313–322. doi: 10.1109/TMI.2008.925077. [DOI] [PubMed] [Google Scholar]
- Deffieux T, Montaldo G, Tanter M, Fink M. Shear wave spectroscopy for in vivo quantification of human soft tissues visco-elasticity. Medical Imaging, IEEE Transactions on. 2009b;283:313–322. doi: 10.1109/TMI.2008.925077. [DOI] [PubMed] [Google Scholar]
- Evans A, Whelehan P, Thomson K, McLean D, Brauer K, Purdie C, Jordan L, Baker L, Thompson A. Quantitative shear wave ultrasound elastography: Initial experience in solid breast masses. Breast Cancer Research. 2010:126. doi: 10.1186/bcr2787. [DOI] [PMC free article] [PubMed] [Google Scholar]
- Fatemi M, Greenleaf JF. Ultrasound-stimulated vibro-acoustic spectrography. Science. 1998;280(5360):82–85. doi: 10.1126/science.280.5360.82. [DOI] [PubMed] [Google Scholar]
- Gallippi CM, Nightingale KR, Trahey GE. BSS-based filtering of physiological and arfi-induced tissue and blood motion. Ultrasound in Medicine & Biology. 2003;2911:1583–1592. doi: 10.1016/j.ultrasmedbio.2003.07.002. [DOI] [PubMed] [Google Scholar]
- Gao L, Parker KJ, Lerner RM, Levinson SF. Imaging of the elastic properties of tissue–a review. Ultrasound in Medicine & Biology. 1996;228:959–977. doi: 10.1016/s0301-5629(96)00120-2. [DOI] [PubMed] [Google Scholar]
- Greenleaf JF, Fatemi M, Insana M. Selected methods for imaging elastic properties of biological tissues. Annual Review of Biomedical Engineering. 2003;51:57–78. doi: 10.1146/annurev.bioeng.5.040202.121623. [DOI] [PubMed] [Google Scholar]
- Hah Z, Hazard C, Cho Y, Rubens D, Parker K. Crawling waves from radiation force excitation. Ultrasonic Imaging. 2010;32:177–189. doi: 10.1177/016173461003200305. [DOI] [PubMed] [Google Scholar]
- Herman BA, Harris GR. Models and regulatory considerations for transient temperature rise during diagnostic ultrasound pulses. Ultrasound in Medicine & Biology. 2002;289:1217–1224. doi: 10.1016/s0301-5629(02)00558-6. [DOI] [PubMed] [Google Scholar]
- Hoyt K, Castaneda B, Parker KJ. Muscle tissue characterization using quantitative sonoelastography: preliminary results. Proc IEEE Ultrasonics Symp. 2007a:365–368. [Google Scholar]
- Hoyt K, Castaneda B, Parker KJ. Two-dimensional sonoelastographic shear velocity imaging. Ultrasound Med Biol. 2008a;34:276–288. doi: 10.1016/j.ultrasmedbio.2007.07.011. [DOI] [PubMed] [Google Scholar]
- Hoyt K, Kneezel T, Castaneda B, Parker KJ. Quantitative sonoelastography for the in vivo assessment of skeletal muscle viscoelastography. Phys Med Biol. 2008b;53:4063–4080. doi: 10.1088/0031-9155/53/15/004. [DOI] [PMC free article] [PubMed] [Google Scholar]
- Hoyt K, Parker KJ, Rubens DJ. Sonoelastographic shear velocity imaging: experiments on tissue phantom and prostate. Proc IEEE Ultrasonics Symp. 2006:1686–1689. [Google Scholar]
- Hoyt K, Parker KJ, Rubens DJ. Real-time shear velocity imaging using sonoelastographic techniques. Ultrasound Med Biol. 2007b;33:1086–1097. doi: 10.1016/j.ultrasmedbio.2007.01.009. [DOI] [PubMed] [Google Scholar]
- IEC. Medical electrical equipment - Part 2-37: Particular requirements for the basic safety and essential performance of ultrasonic medical diagnostic and monitoring equipment. IEC 60601-2-37 ED 2. 2007 [Google Scholar]
- Jensen J. Field: A program for simulating ultrasound systems. 10th Nordic-Baltic Conference on Biomedical Imaging Published in Medical & Biological Engineering & Computing. 1996;34(Supplement 1, Part 1):351–353. [Google Scholar]
- Jensen J, Svendsen N. Calculation of pressure fields from arbitrarily shaped, apodized, and excited ultrasound transducers. Ultrasonics, Ferroelectrics and Frequency Control, IEEE Transactions on. 1992;392:262–267. doi: 10.1109/58.139123. [DOI] [PubMed] [Google Scholar]
- Kasai C, Namekawa K, Koyano A, Omoto R. Real-time two-dimensional blood flow imaging using an autocorrelation technique. Sonics and Ultrasonics, IEEE Transactions on. 1985;323:458–464. [Google Scholar]
- Konofagou E, Hynynen K. Localized harmonic motion imaging: theory, simulations and experiments. Ultrasound Med Biol. 2003;29:1405–1413. doi: 10.1016/s0301-5629(03)00953-0. [DOI] [PubMed] [Google Scholar]
- Lin K, McLaughlin J, Renzi D, Thomas A. Shear wave speed recovery in sonoelastography using crawling wave data. Journal of the Acoustical Society of America. 2010;1281:88–97. doi: 10.1121/1.3442575. [DOI] [PMC free article] [PubMed] [Google Scholar]
- Lin K, McLaughlin J, Thomas A, Hazard C, Thomenius K, Hah Z, Parker K, Rubens D. A complex elastographic hyperbolic solver (CEHS) to recover frequency dependent complex shear moduli in viscoelastic models utilizing one or more displacement data sets. Sumbitted to Inverse Problems. 2011 [Google Scholar]
- Madsen E, Frank G, Krouskop T, Varghese T, Kallel F, Ophir J. Tissue-mimicking oil-in-gelatin dispersions for use in heterogeneous elastography phantoms. Ultrasonic Imaging. 2003;25:17–38. doi: 10.1177/016173460302500102. [DOI] [PubMed] [Google Scholar]
- Mariappan YK, Rossman PJ, Glaser KJ, Manduca A, Ehman RL. Magnetic resonance elastography with a phased-array acoustic driver system. Magnetic Resonance in Medicine. 2009;613:678–685. doi: 10.1002/mrm.21885. [DOI] [PMC free article] [PubMed] [Google Scholar]
- McAleavey S, Menon M, Orszulak J. Shear-modulus estimation by application of spatially-modulated impulsive acoustic radiation force. Ultrason Imaging. 2007;29:87–104. doi: 10.1177/016173460702900202. [DOI] [PubMed] [Google Scholar]
- McLaughlin J, Parker KJ, Renzi D, Wu Z. Shear wave speed recovery using interference patterns obtained in sonoelastography experiments. J Acoust Soc Am. 2007;121:2438–2446. doi: 10.1121/1.2534717. [DOI] [PubMed] [Google Scholar]
- Muller M, Gennisson JL, Deffieux T, Tanter M, Fink M. Quantitative viscoelasticity mapping of human liver using supersonic shear imaging: Preliminary in vivo feasability study. Ultrasound in Medicine & Biology. 2009;352:219–229. doi: 10.1016/j.ultrasmedbio.2008.08.018. [DOI] [PubMed] [Google Scholar]
- NEMA. Standard for real-time display of thermal and mechanical acoustic output indices on diagnostic ultrasound equipment. Tech Rep UD 3-2004, FDA. 2004 [Google Scholar]
- Nightingale K, Kornguth P, Walker W, Glasgow S, Jett E, Trahey G. Generation and detection of acoustic streaming to differentiate between solid and cystic breast lesions. Proceedings of the IEEE Ultrasonics Symposium. 1994;3:1653–1656. [Google Scholar]
- Nightingale K, McAleavey S, Trahey G. Shear-wave generation using acoustic radiation force: in vivo and ex vivo results. Ultrasound in Medicine & Biology. 2003;2912:1715–1723. doi: 10.1016/j.ultrasmedbio.2003.08.008. [DOI] [PubMed] [Google Scholar]
- Nightingale K, Palmeri M, Nightingale R, Trahey G. On the feasibility of remote palpation using acoustic radiation force. J Acoust Soc Am. 2001;110:625–634. doi: 10.1121/1.1378344. [DOI] [PubMed] [Google Scholar]
- Nightingale K, Soo MS, Nightingale R, Trahey G. Acoustic radiation force impulse imaging: in vivo demonstration of clinical feasibility. Ultrasound in Medicine & Biology. 2002;282:227–235. doi: 10.1016/s0301-5629(01)00499-9. [DOI] [PubMed] [Google Scholar]
- Ophir J, Alam SK, Garra B, Kallel F, Konofagou E, Krouskop T, Varghese T. Elastography: Ultrasonic estimation and imaging of the elastic properties of tissues. Proceedings of the Institution of Mechanical Engineers, Part H: Journal of Engineering in Medicine. 1999;2133:203–233. doi: 10.1243/0954411991534933. [DOI] [PubMed] [Google Scholar]
- Parker KJ, Doyley MM, Rubens DJ. Imaging the elastic properties of tissue: the 20 year perspective. Physics in Medicine and Biology. 2011;561:R1. doi: 10.1088/0031-9155/56/1/R01. [DOI] [PubMed] [Google Scholar]
- Sandrin L, Catheline S, Tanter M, Hennequin X, Fink M. Time-resolved pulsed elastography with ultrafast ultrasonic imaging. Ultrasonic Imaging. 1999;214:259–272. doi: 10.1177/016173469902100402. [DOI] [PubMed] [Google Scholar]
- Sarvazyan A, Rudenko O, Swanson S, Fowlkes B, Emelianov S. Shear wave elasticity imaging: A new ultrasonic technology of medical diagnosis. Ultrasound Med Biol. 1998;24:1419–1435. doi: 10.1016/s0301-5629(98)00110-0. [DOI] [PubMed] [Google Scholar]
- Sarvazyan AP, Rudenko OV, Nyborg WL. Biomedical applications of radiation force of ultrasound: Historical roots and physical basis. Ultrasound in Medicine & Biology. 2010;369:1379–1394. doi: 10.1016/j.ultrasmedbio.2010.05.015. [DOI] [PubMed] [Google Scholar]
- Sugimoto T, Ueha S, Itoh K. Tissue hardness measurement using the radiation force of focused ultrasound. Proc IEEE Ultrasonic Symp. 1990:1377–80. [Google Scholar]
- Tanter M, Bercoff J, Sandrin L, Fink M. Ultrafast compound imaging for 2-d motion vector estimation: application to transient elastography. IEEE trans UFFC. 2002;49:1363–1374. doi: 10.1109/tuffc.2002.1041078. [DOI] [PubMed] [Google Scholar]
- U.S. Department of Health and Human Services. Information for manufacturers seeking marketing clearance of diagnostic ultrasound systems and transducers. Tech rep, FDA. 2008 [Google Scholar]
- Wu Z, Hoyt K, Rubens DJ, Parker KJ. Sonoelastographic imaging of interference patterns for estimation of shear velocity distribution in biomaterials. J Acoust Soc Am. 2006;120:535–545. doi: 10.1121/1.2203594. [DOI] [PubMed] [Google Scholar]
- Wu Z, Taylor LS, Rubens DJ, Parker KJ. Sonoelastographic imaging of interference patterns for estimation of shear velocity of homogeneous biomaterials. Phys Med Biol. 2004;49:911–922. doi: 10.1088/0031-9155/49/6/003. [DOI] [PubMed] [Google Scholar]
- Zhang M, Castaneda B, Wu Z, Nigwekar P, Joseph J, Rubens DJ, Parker KJ. Congruence of imaging estimators and mechanical measurements of viscoelastic properties of soft tissues. Ultrasound Med Biol. 2007;33:1671–1631. doi: 10.1016/j.ultrasmedbio.2007.04.012. [DOI] [PMC free article] [PubMed] [Google Scholar]


