Abstract
This paper introduces methods to generate crawling wave interference patterns from the displacement fields generated from radiation force pushes on a GE Logiq 9 scanner. The same transducer and system is providing both the pushing pulses to generate the shear waves and the tracking pulses to measure the displacements. Acoustic power and system limitations result in largely impulsive displacement fields. Measured displacements from pushes on either side of a region of interest (ROI) are used to calculate continuously varying interference patterns. This technique is explained along with a brief discussion of the conventional mechanical source-driven crawling waves for comparison. We demonstrate the method on three example cases: a gelatin based phantom with a cylindrical inclusion, an oil-gelatin phantom, and mouse livers. The oil-gelatin phantom and the mouse livers demonstrate not only shear speed estimation, but the frequency dependence of the shear wave speeds.
Keywords: Crawling wave, Sonoelasticity, Radiation force, Crawling wave movie synthesis, Local shear speed estimation, Shear speed dispersion
Introduction
The fundamental idea behind crawling waves is to use the interference pattern of two shear waves traveling in opposite directions to gain insight into the mechanical properties of tissue. Some of the challenges associated with generating such an interference pattern using radiation force have been reported previously (Hah et al., 2010b,c,a), and in the companion paper, Part 1. This paper will discuss some of the major applications. The technique described here allows exploration of some of the properties of the interference pattern without burdening the system or heating the tissue excessively. The basic idea is to generate the two shear waves separately and record the displacements for each independently. Using these independently gathered displacement data sets, a whole family of crawling wave interference patterns can be synthesized. This assumes that interference between the shear waves is a linear process. For the very small displacements typical of these experiments, the assumption of linearity is valid (Hah et al., 2010b). The idea of linearly super-imposing displacements from multiple sources has also been used to improve the illumination and even to allow crude beamforming of the transient shear waveforms in MR (magnetic resonance) elastography (Mariappan et al., 2009).
Crawling waves require two sources that generate shear waves at specific frequencies in the range of 40–1000 Hz. Many earlier crawling wave (CrW) experiments utilized mechanical continuous wave (CW) excitations which developed characteristic interference patterns. Generating CW shear waves is more difficult with radiation force methods, requiring either repeated pushing pulse excitations or amplitude modulated CW acoustic excitation (Fatemi and Greenleaf, 1998; Konofagou and Hyn ynen, 2003). This can result in tissue heating and a need for more thermal capacity in the pulsing and switching electronics. A more sparing approach is synthetic calculation of crawling waves utilizing short duty-cycle push pulses which generate impulsive displacement waveforms.
This paper, which complements Part 1, focuses on the theory, methods, and applications of CrW synthesis from radiation forces to generate ARC (Acoustic Radiation force Crawling) waves. The methods are verified in phantoms, both homogeneous and inhomogeneous. The frequency selective synthesis of CrW will be applied to extract dispersion characteristics of media including a fatty phantom and ex-vivo of mouse livers. Comparisons are made between results obtained from mechanical shear wave sources run in sinusoidal steady state, and the synthesized crawling waves from radiation force pushes. Measurements on phantoms and mouse livers are found to be closely comparable.
Signal Processing
Review of crawling waves
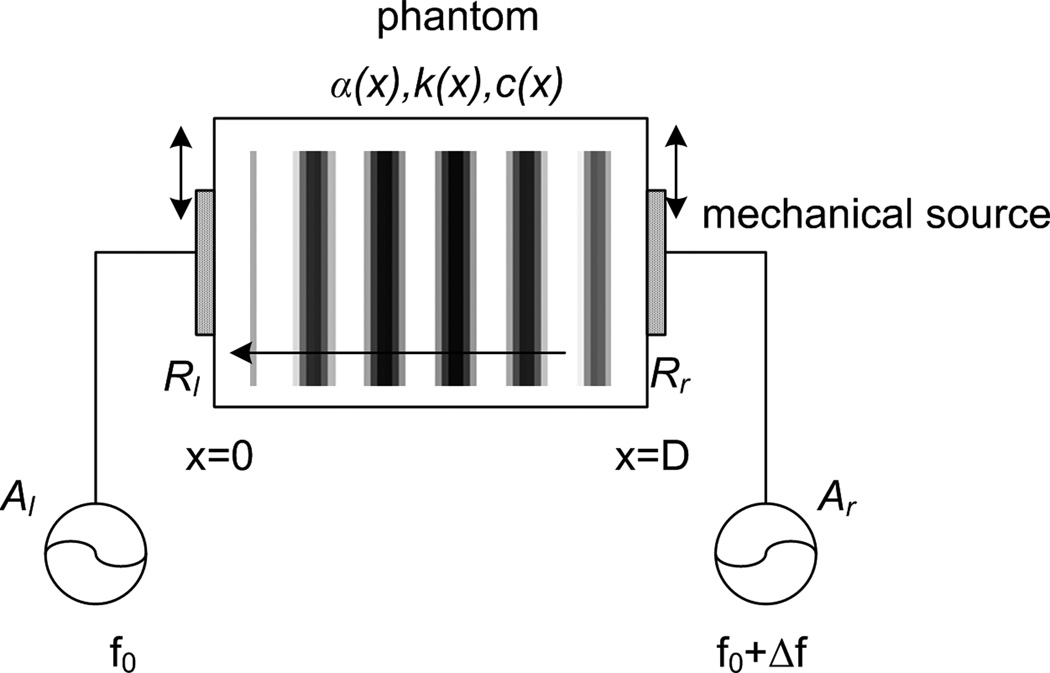
A typical CrW setup is shown in Fig. 1. Two sinusoidal sources, D apart, vibrate with frequencies ω0 and ω0 + Δω and amplitudes Al(left) and Al(right), respectively. A one-dimensional medium can be defined by distribution functions for shear speed c(x) and attenuation α(x). We can also define a local wave propagation vector or wave number k(x) = ω0/c(x), and shear wave amplitude factor A(x) to account for the decrease of the amplitude of the waves in the stiffer region (Gao et al., 1995). For simplicity, A(x) is considered to be a correlated parameter. Therefore, the CW signal coming from the left L(x, t), and the right R(x, t) source can be written as
| (1) |
where ϕ0 is the difference in the initial phase between the sources that generate the L(x, t) and R(x, t) waves.
Figure 1.
A diagram showing the basic configuration for crawling waves (CrW). Two sources with frequency of f and f + Δf, and amplitude of Al, Ar respectively are vibrating continuously. The medium can be defined with distribution function of shear speed c(x), attenuation α(x), wave number k(x), and reflection coefficients Rl and Rr at the left and right boundaries, respectively.
Our main objective is to recover the shear speed distribution of c(x), or k(x), and possibly α(x) and A(x) as well, in Eq. (1). Since both of the sources are vibrating simultaneously, the observed signal is given by O(x, t) = L(x, t) + R(x, t), a sum of harmonic signals. To extract the magnitude of the shear waves, the square of the amplitude (or variance) of the observed signal is calculated as
| (2) |
As seen in Eq. (2), this CrW signal has a baseline term that depends on the attenuation and amplitude distribution, and a time dependent sinusoidal term that describes the moving interference pattern. For small difference frequencies, Δω ≪ 2π, the pattern moves slowly, which allows tracking at low frame rate. For example, for Δf=0.2 Hz, a frame rate of 5 Hz will generate 25 frames for each period of CrW. The baseline term, containing the α(x) component, is steady and can be fitted into the formula to estimate the attenuation of the medium. The crawling wave term, including k(x), is the term that moves slowly, due to Δωt term, and will provide the information of the shear wave speed or the stiffness of the medium. These output parameters are generally a function of the frequency. Changing the driving frequency and subsequent estimation will provide the dispersion characteristics of the medium.
Extracting the shear speed from the crawling wave term of Eq. (2) can take many forms. For simplicity, we will explain phase-based estimation. Filtering and other methods can be used on the crawling wave term to recover the phase, θ(x), of the cosine term in Eq. (2), from the measured displacement field as
| (3) |
The wave number, k(x), and the shear velocity, c(x), can then be calculated by taking a numerical derivative as
| (4) |
Estimation the phase θ(x) can be done pixel by pixel through a slow-time filter (Castaneda et al., 2007) utilizing the knowledge of Δω, or frame by frame though Hilbert transform (Hoyt et al., 2008). In reality, the CrW data is often contaminated by noise and therefore, some degree of smoothing is required to make θ′ (x) smooth and well-behaved. There are many reports of methods used to extract shear speeds from CrW experiments on phantoms, ex-vivo and in-vivo specimens, including a local spatial frequency estimator, estimation of pattern arrival times, and local autocorrelation (McLaughlin and Renzi, 2006; McLaughlin et al., 2007; Wu et al., 2006; Hoyt et al., 2008; Castaneda et al., 2007; Hoyt et al., 2007, 2006; Castaneda et al., 2009).
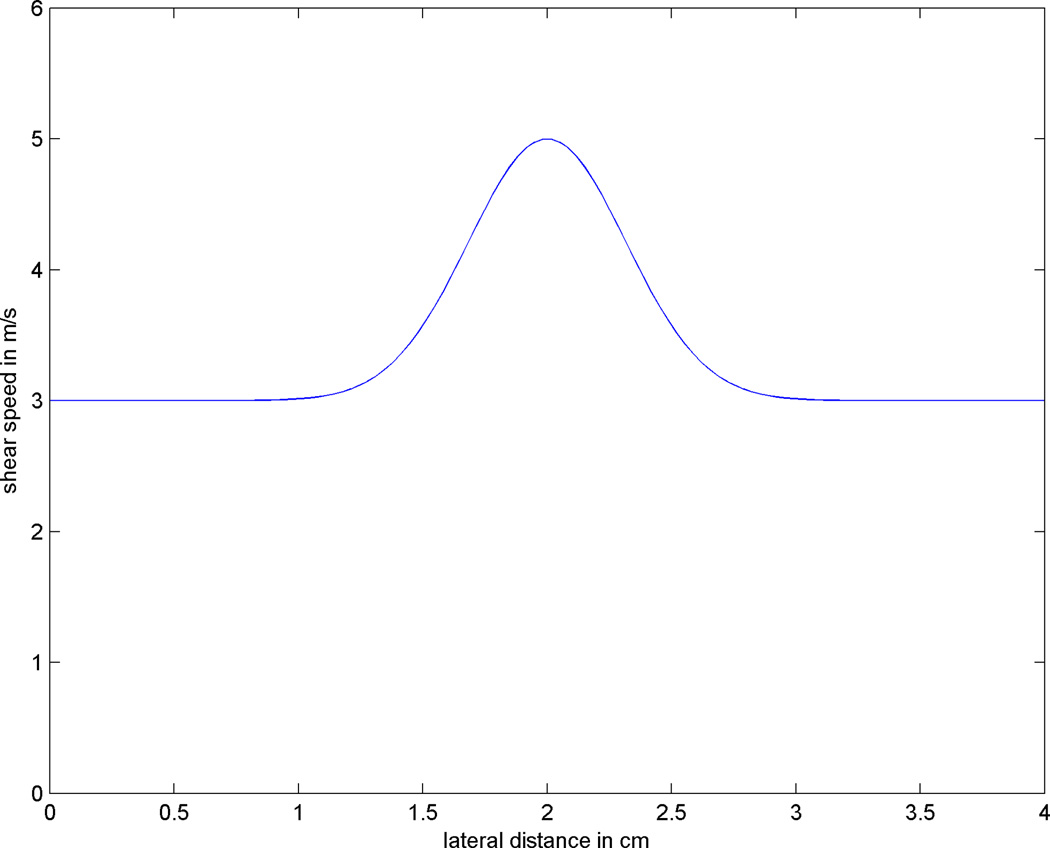
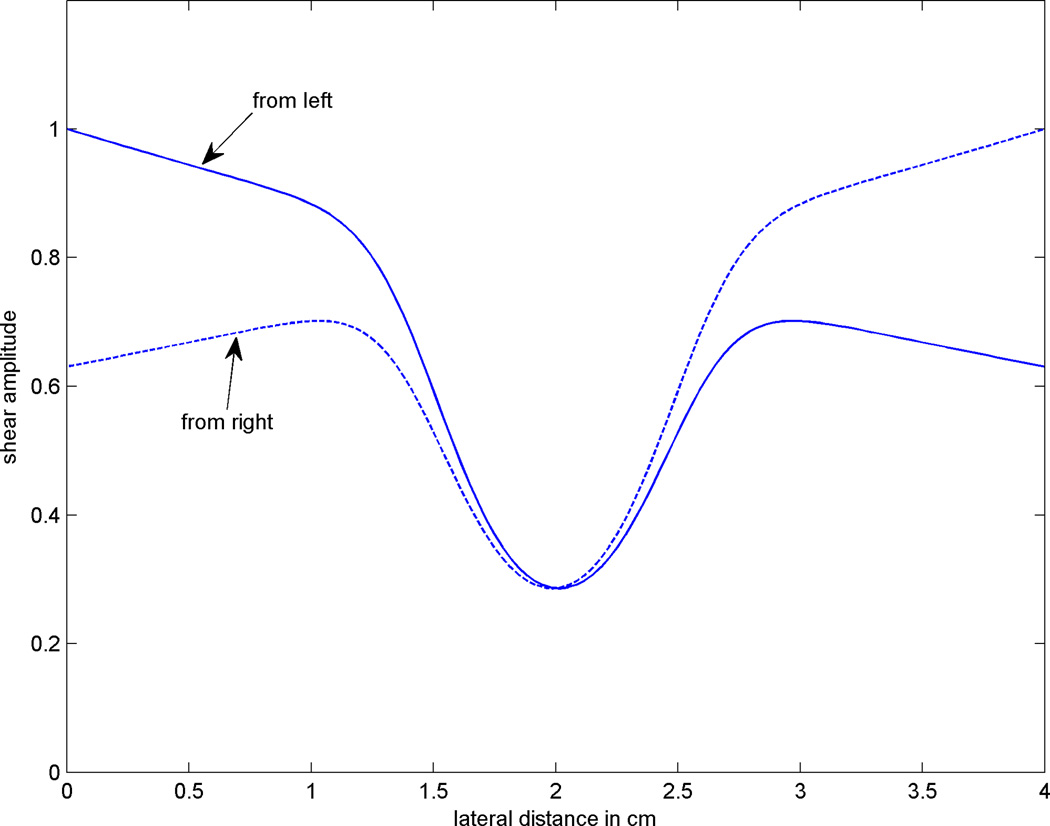
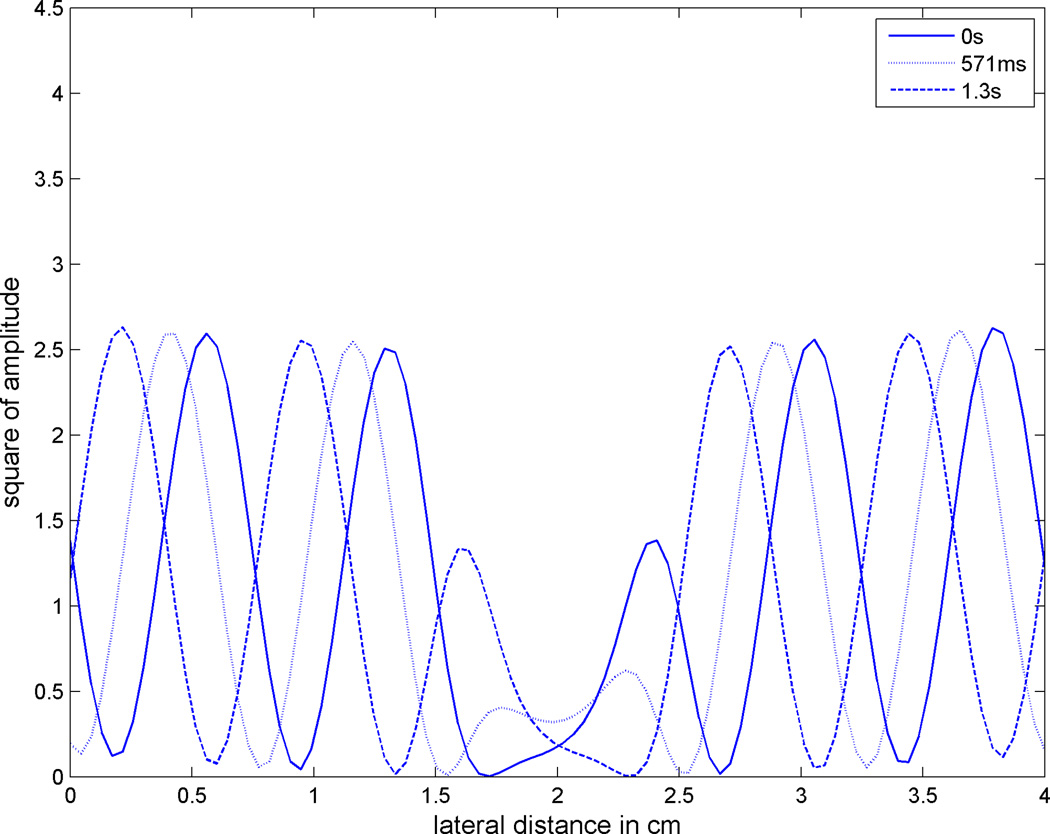
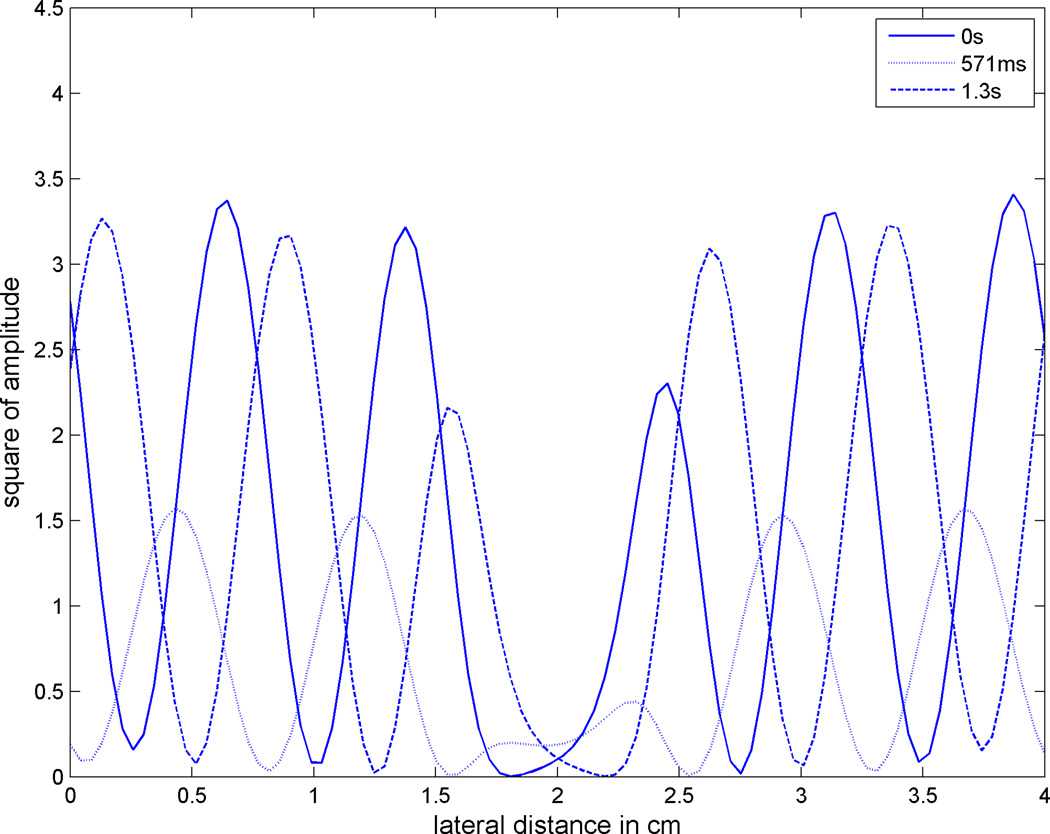
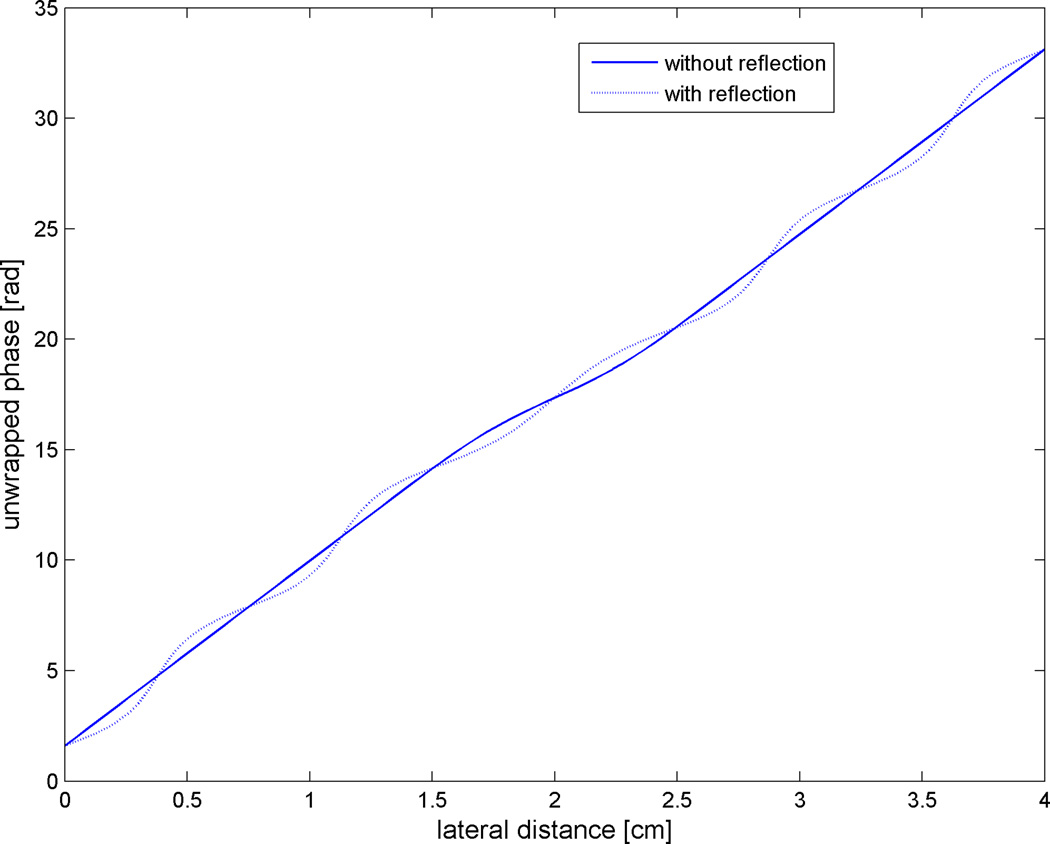
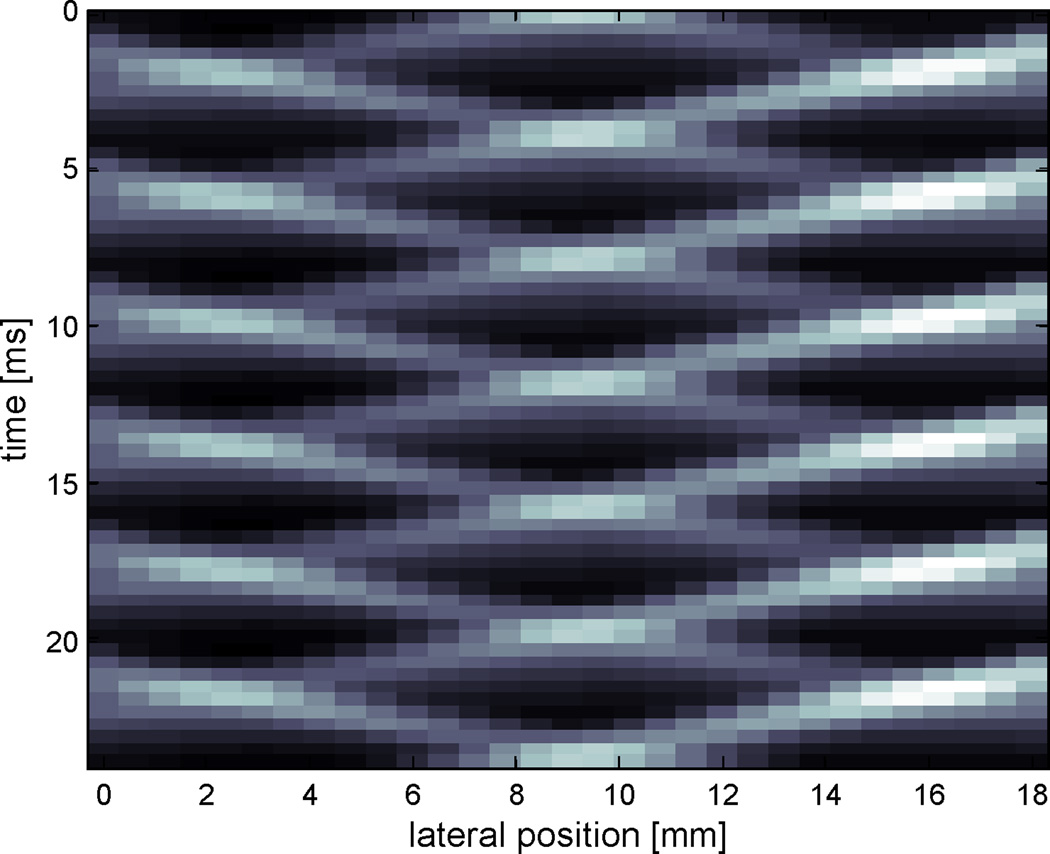
There are factors to consider when performing experiments in phantoms and specimens. First, the amplitudes of the driving signal Al, Ar should be comparable to avoid one source dominating the field. Second, the boundary should be properly modified to minimize reflections, denoted in Fig. 1 as Rl and Rr for the boundary reflection at left and right source, respectively. Fig. 2 shows results from a simulation with a 1 cm inclusion with peak shear speed of 5 m/s in a background medium of 3 m/s of speed and 1 dB/cm of attenuation. Both the inclusion and the background medium are assumed to have the same density of 1 g/cm3. The shear speed distribution and shear wave amplitude profile, given from source amplitude, attenuation and amplitude factor, are shown in Fig. 2 (a) and Fig. 2(b), respectively. Some frames of the CrW movies, with and without boundary reflections, are shown in Fig. 2(c) and Fig. 2(d), respectively. As seen in Fig. 2(d), calculated with Rl = Rr =0.5, reflections cause amplitude variation ‘pulsating’ with a regular pattern. The effect of reflections on the phase, and the speed estimation therefrom, is illustrated in Fig. 2(e) and in Fig. 2(f). The phase of the homogeneous phantom is unwrapped and shown in the solid line for no reflection and in the dotted line with boundary reflection, respectively in Fig 2(e). The slope of the curve is inversely proportional to the shear speed as formulated in Eq. (4). Indeed, the slope is smaller near the inclusion. With reflections, however, the phase, θ(x), shows a sinusoidal fluctuation as the dotted line of Fig. 2(e) shows. Thus, the shear speed estimation, c(x), would vary similarly as shown in Fig. 2(f). A detailed description of the reflection effect on CrW is beyond the scope of this paper.
Figure 2.
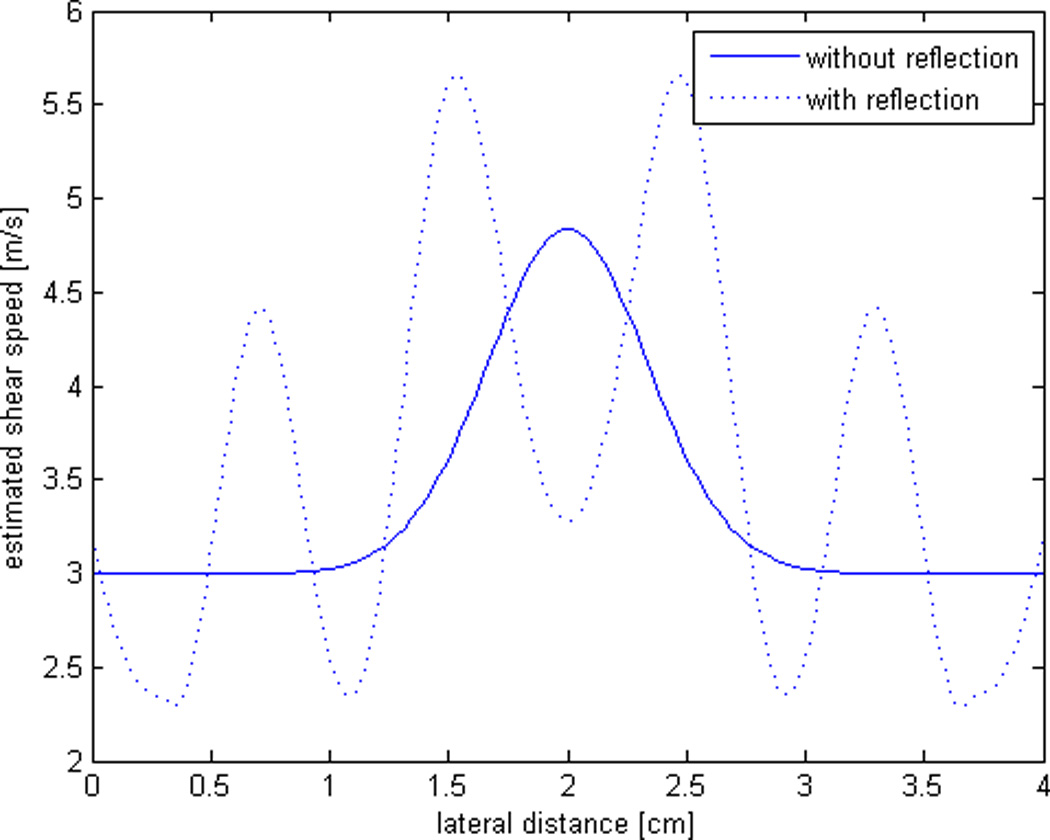
A simulation result showing the behavior of crawling waves. (a) shows the shear speed distribution having a 1 cm inclusion inside a background medium of 3m/s. (b) shows the amplitude distribution of the left and right signal without boundary reflection as a product of source magnitude, attenuation and amplitude factor. (c) displays the crawling wave movement without reflection while (d) shows the same movement with boundary reflection of 0.5 at both sides, causing the amplitude variation pulsating in a regular pattern. The unwrapped phase distribution is shown in (e), where it is clear that the phase for (d) is corrupted with a sinusoidal component. The estimated shear speed for phase distribution of (e) is shown in (f).
Reflection removal
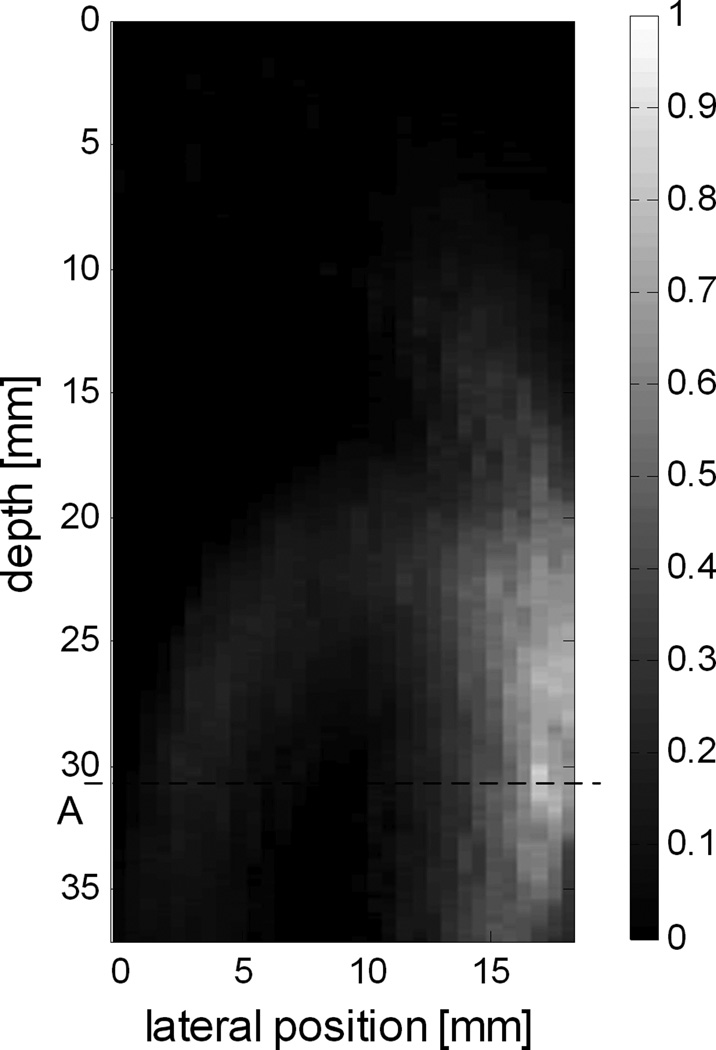
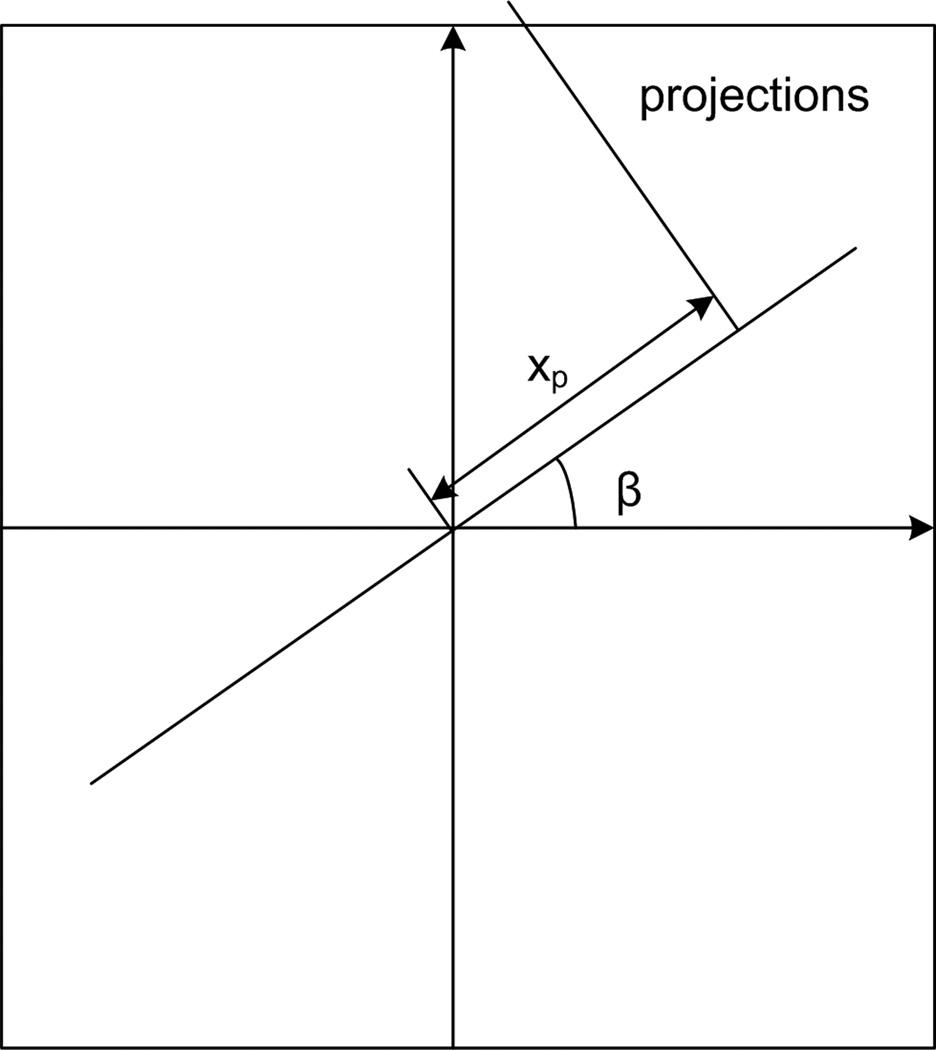
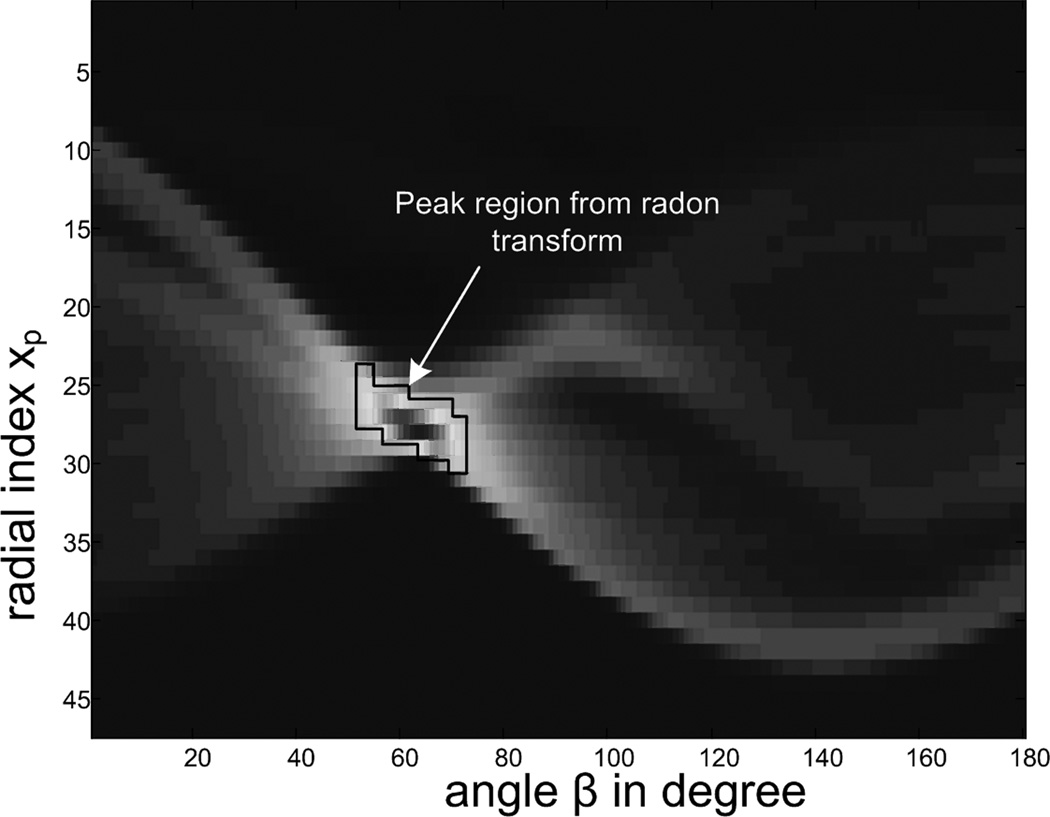
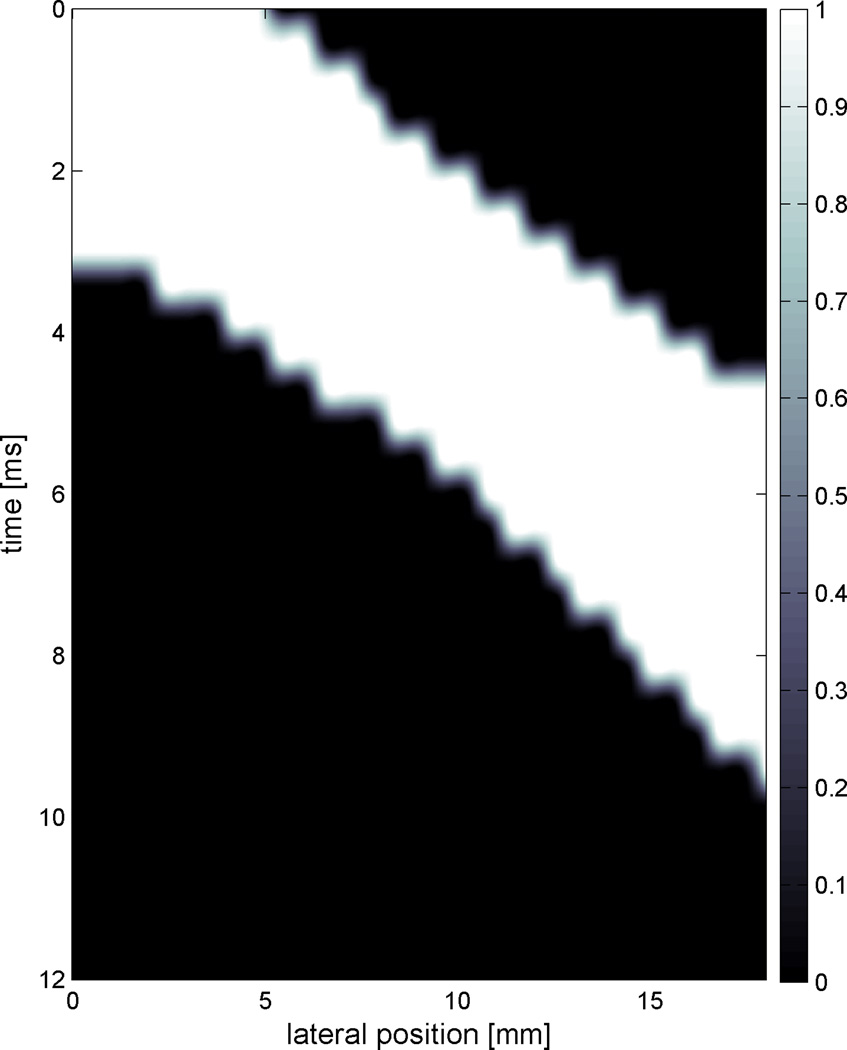
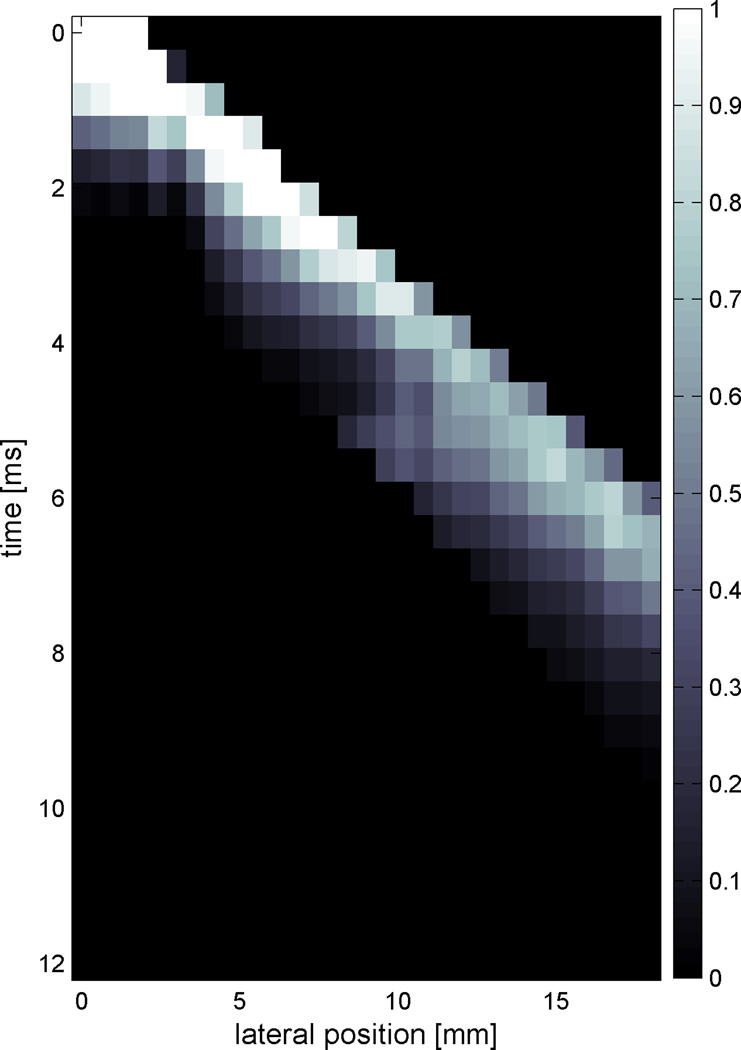
Shear waves generated with radiation force can exhibit reflections that can corrupt the shear speed estimation algorithms. Since the shear waves in this study are impulsive, the reflections can be removed with a motion filter. Fig. 3(a) illustrates an example of an impurity inside an oil-gelatin phantom which generated a reflection. The displacement data is acquired with the parameters explained in the part 1 paper with ROI of 4cm deep and 18mm wide. Fig. 3(b) is an image of the displacements at a fixed depth, indicated as line A in Fig. 3(a), as a function of time vs. the lateral location. The reflection is clearly seen in both Fig. 3(a) and 3(b). A filter or mask based on the peak Radon Transform (Rouze et al., 2010) of the data can be applied to track the motion of the main shear wave as shown in Fig. 3(c)–3(e). Each of the points inside the peak region of the Radon transformation shown in Fig. 3(d) will construct a line in the original image of Fig. 3(b), and collecting all those lines and smoothing will produce a motion mask shown in Fig. 3(e). Although the motion mask shown in Fig. 3(e) is a simple 2D filter, a 3D filter is actually constructed by combining all of the 2D filters at each depth and smoothing them. Fig. 3(f) shows the motion filtered image of Fig. 3(b) with estimated shear speed of 2.9 m/s. As explained in Fig. 2, the reflection causes distortion of the phase and resultant shear speed estimation, as illustrated in Fig. 3(g) and Fig. 3(h), respectively, with and without the motion filter. The detailed procedure of calculating the phase from the synthesis will be discussed in the next section. This approach removes the reflected components of shear waves because their displacements do not follow the time history of the forward propagating shear wave. If the reflections are not removed the shear speeds estimated from the synthesized patterns can be affected.
Figure 3.
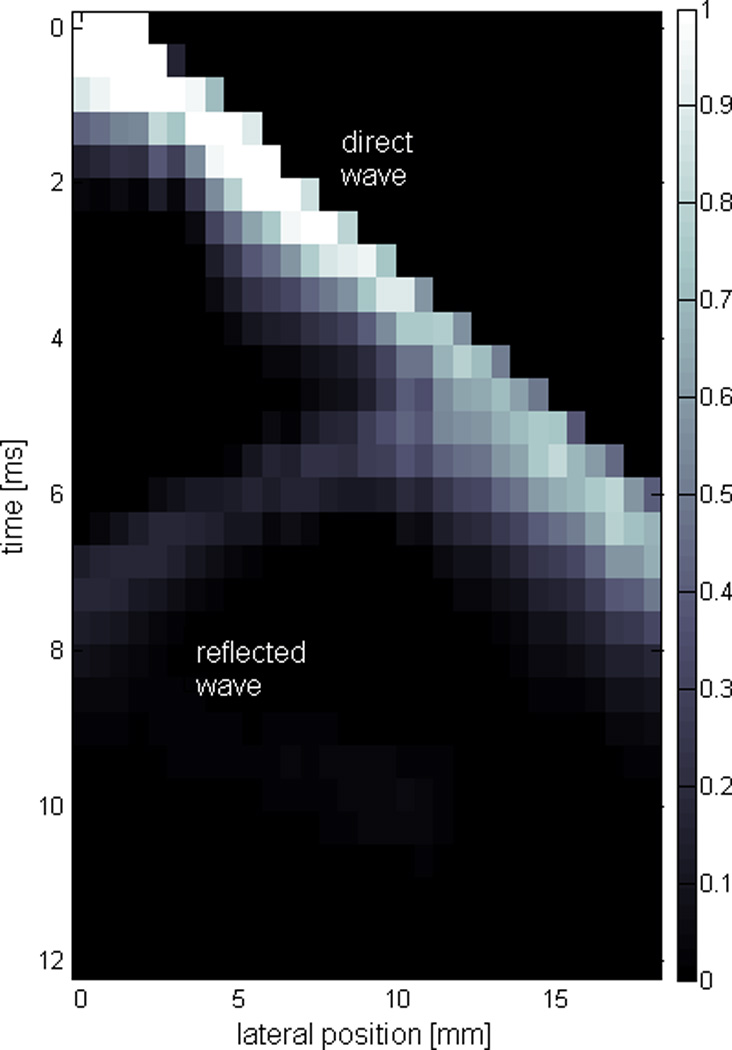
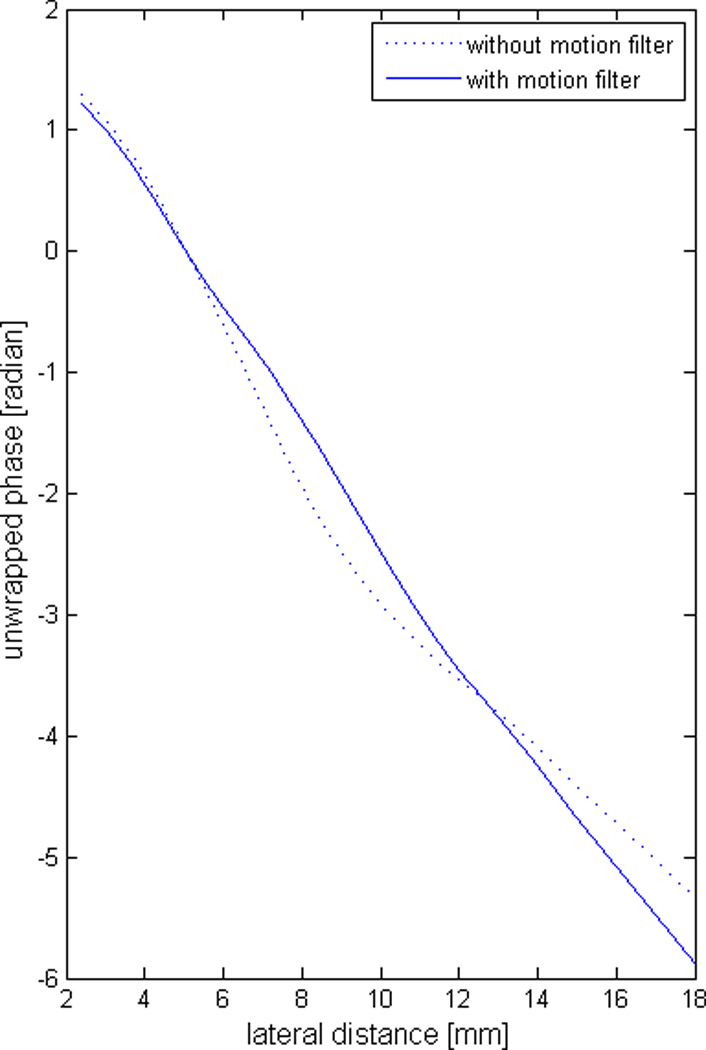
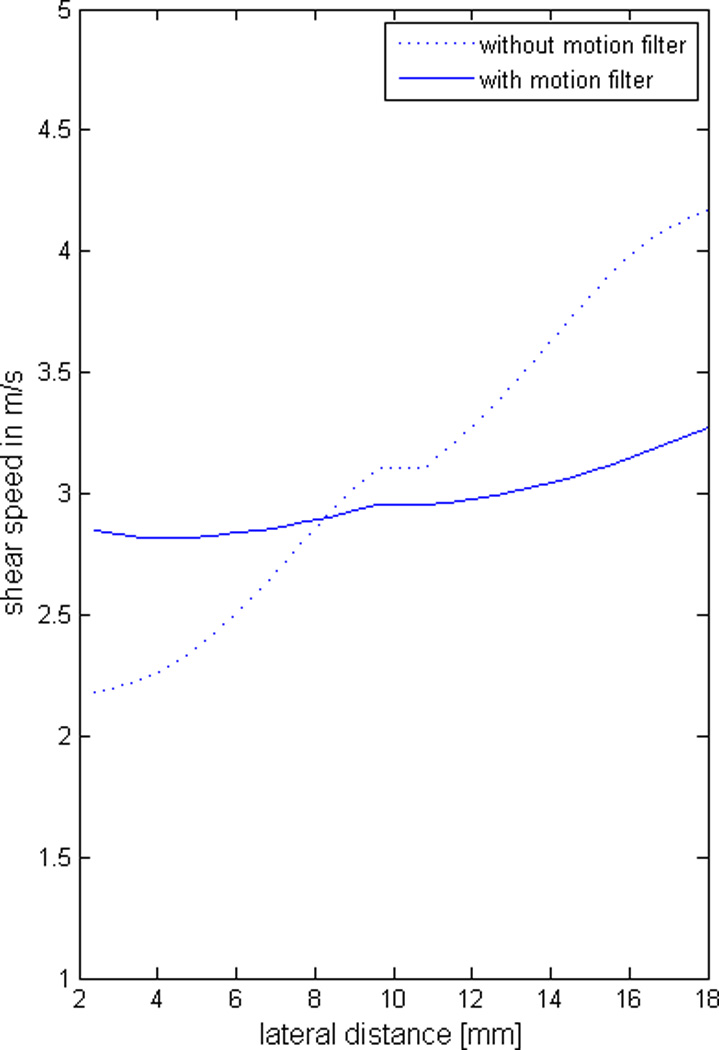
An example of shear wave displacements from radiation force with reflection. (a) A frame of the shear wave displacements shows a reflected wave. An image slice at depth A of (a) is shown in (b), where the direct wave is clearly discernible from the reflected wave. (c) illustrates the concept of Radon transformation with angle β and radial distance xp. (d) displays the result of radon transform. The peak region is marked. Each of the points inside the peak region converts to a single line in the original image. Combining these lines and smoothing produces a final motion mask shown in (e). (f) shows the motion-filtered image. The phase distribution and the estimated shear speed are shown in (g) and (h), respectively, with and without motion filtering.
Synthesis of Crawling Waves from displacements generated from radiation force
With the displacement data filtered to remove ambient noise, vibrations, and reflections, the left and right data sets can be used to generate ARC (Acoustic Radiation force Crawling) wave sequences (Hah et al., 2010c,a). It should be noted that the ARC synthesis schemes presented here are aimed at producing CrW that can be closely compared to mechanically driven, continuous wave CrW. For that reason, we focus on direct synthesis methods in this section in preference over the FFT. Moreover, the inherent assumption of periodicity of FFT can modify the estimation results.
The delay-add method, graphically depicted in Fig. 4, illustrates an intuitively straightforward procedure to synthesize the continuous waveform, which is also simple to implement. Let the displacement from the left push be given by L(x, t) at position x and time t. The displacement field that would occur if the system had transmitted a series of push pulses can be calculated by convolving the displacements for a single push with a train of discrete impulses spaced at Tυ = 1/fυ. The resulting delay-added version, Lda(x, t), is given by
| (5) |
Figure 4.
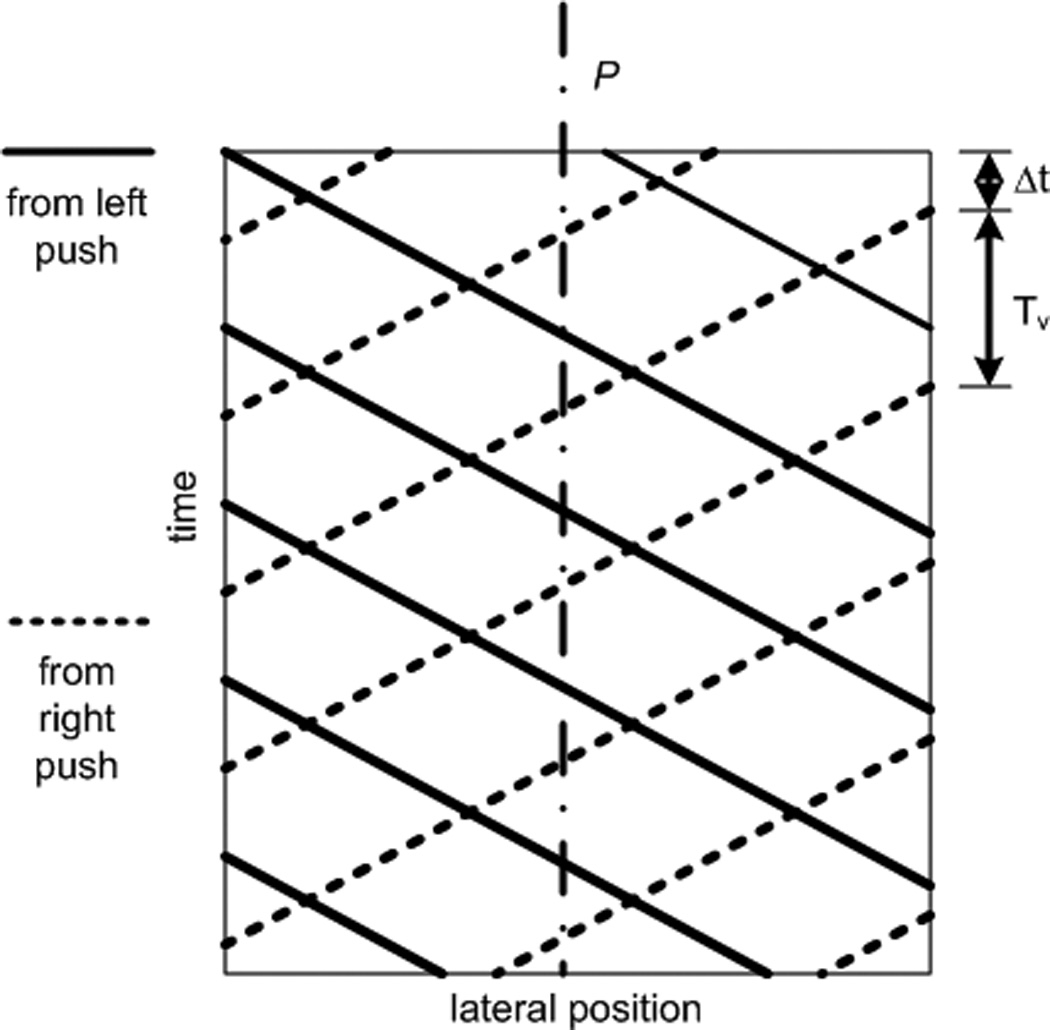
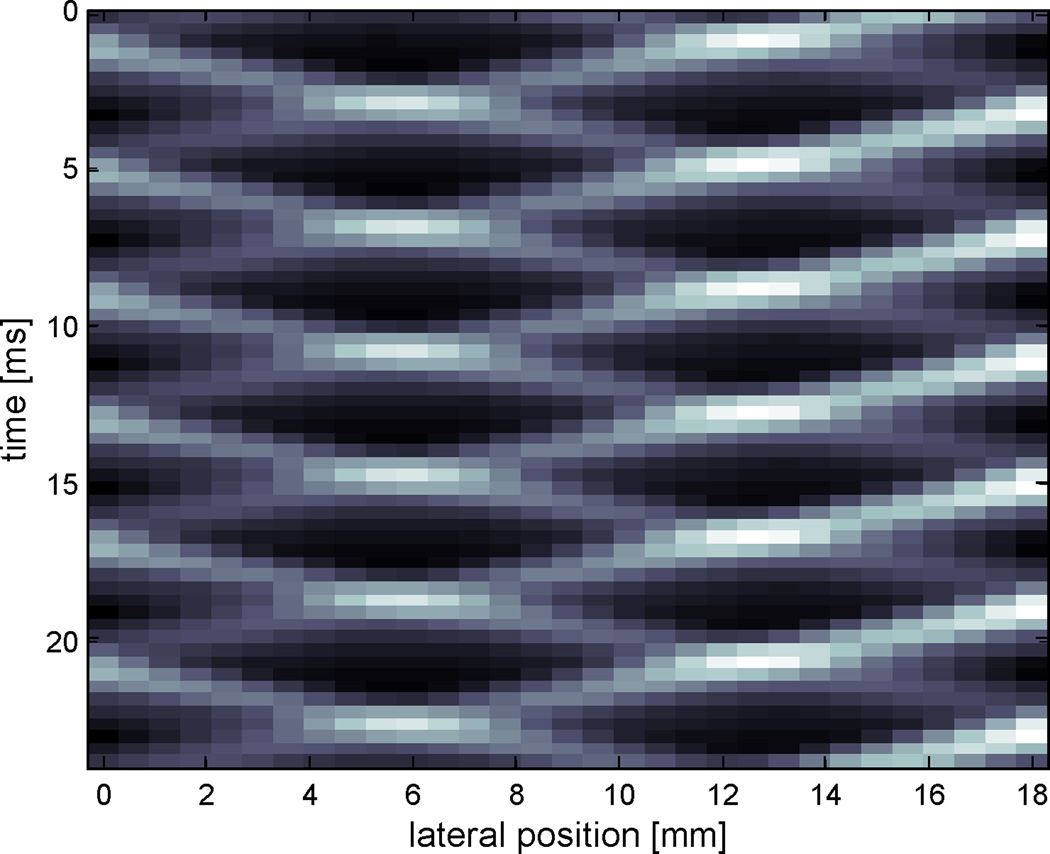
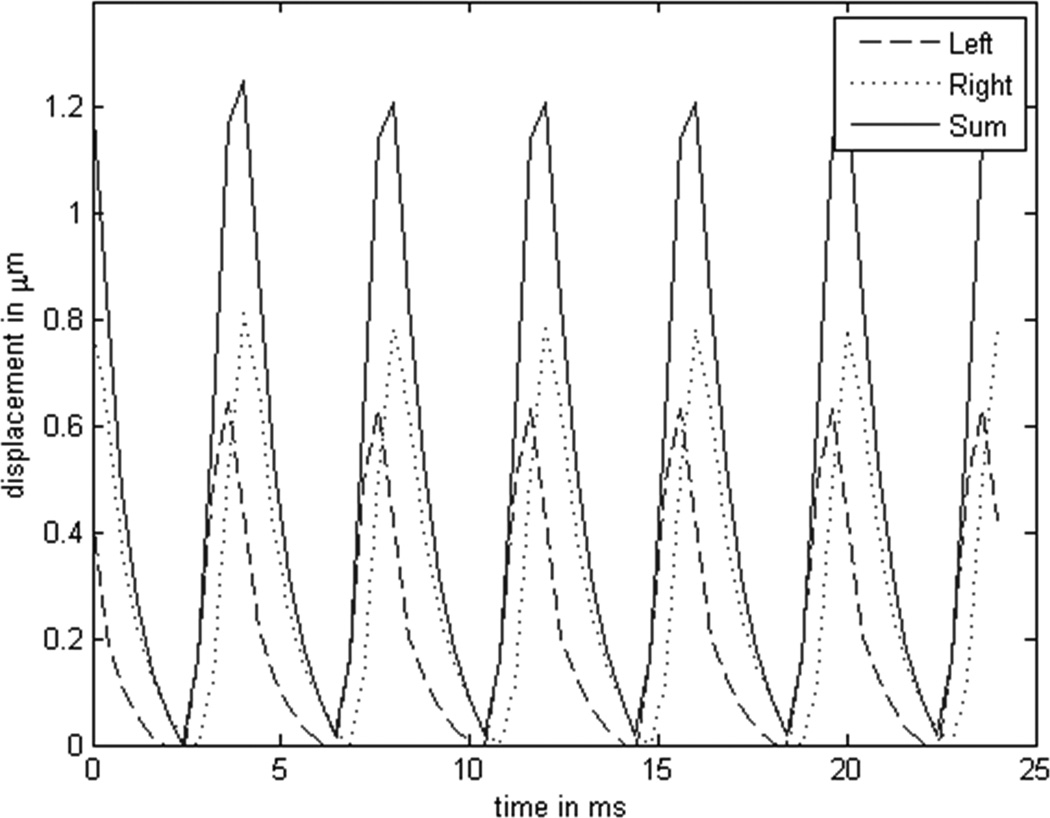
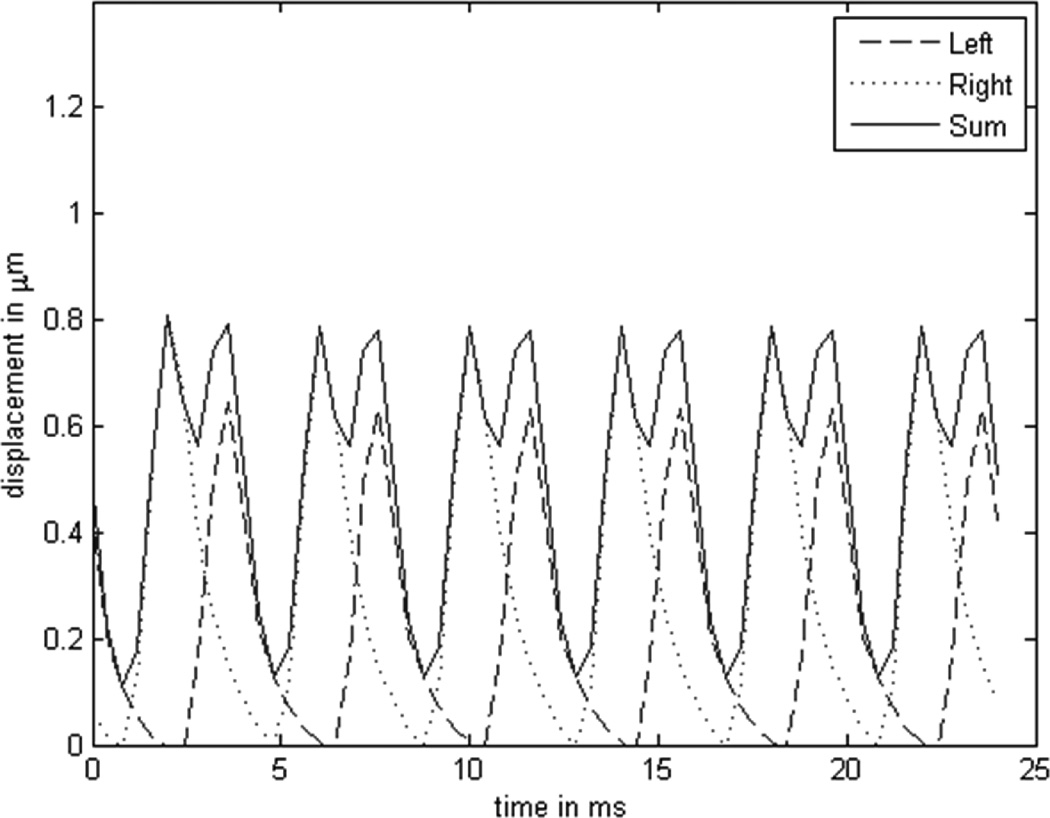
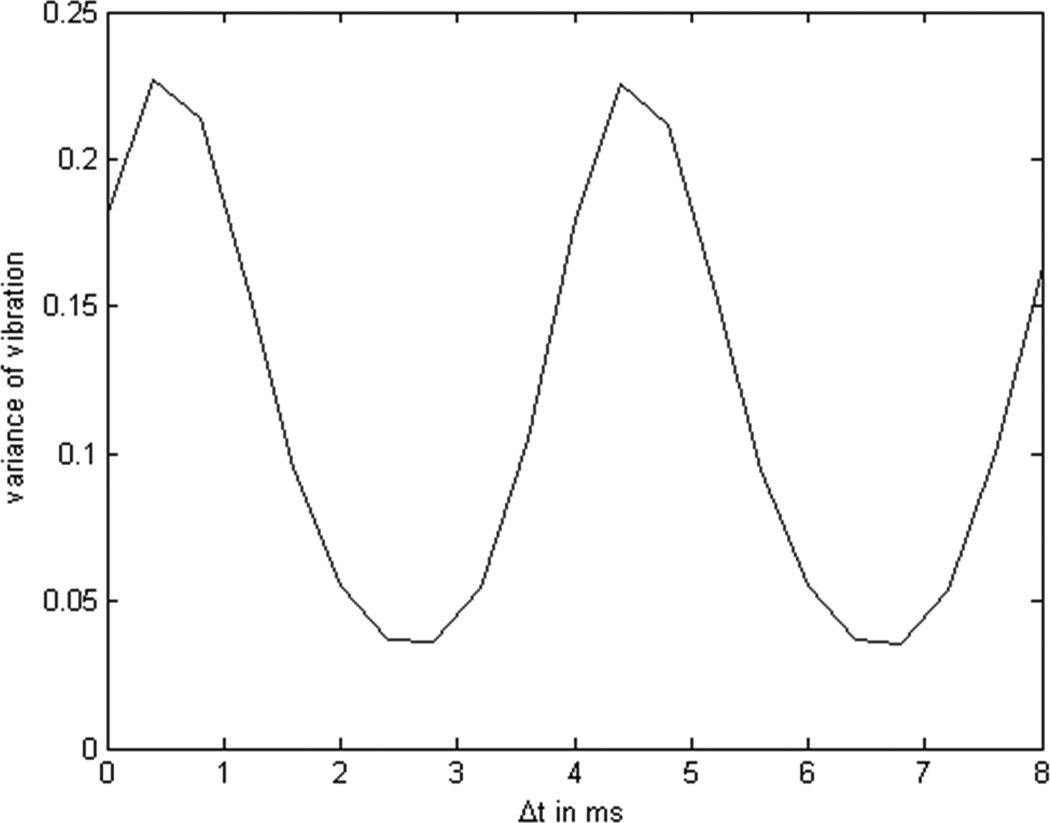
(a) Concept of delay-add where the waveform from the left and the right push are repeated with the rate of fυ=1/Tυ. Δt is the time shift of the one side firing relative to the other side firing. (b) A slice image of motion with fυ=250Hz, Δt=0ms. (c) A slice image of motion with fv=250Hz, Δt=2ms. (d) Displacements at the depth of 25mm, 9mm from the left edge with fυ=250Hz, Δt=0ms for the left push, the right push, and the sum of the left and the right, respectively. (e) Displacements at the depth of 25mm, 9mm from the left edge with fυ=250Hz, Δt=2ms for the left push, the right push, and the sum of the left and the right respectively. (f) Derived interference pattern from variance as a function of the slow time at the depth of 25mm, and 9mm from the left edge.
There is an initial transient portion of the displacement field during which the residual displacements from the previous pushes are building, but eventually the system reaches a steady state and the displacements oscillate over the period Tυ. A single period of the steady state Ldas of the Lda(x, t)can be isolated by
| (6) |
The parameter M in Eq.(6) is chosen such that Lda(x, t) has reached the steady state. The same can be done for the right side push. Let Δt be the difference in time between simulated pushes on the left and right side. Then the crawling waves CrW (x, Δt) are synthesized as
| (7) |
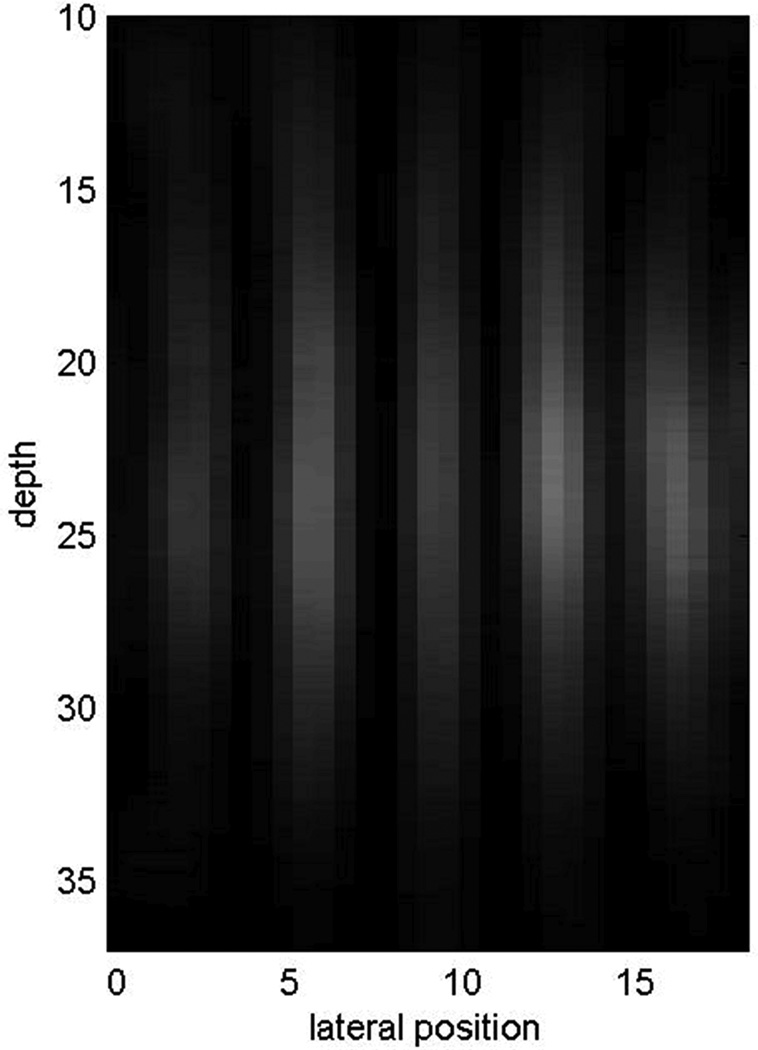
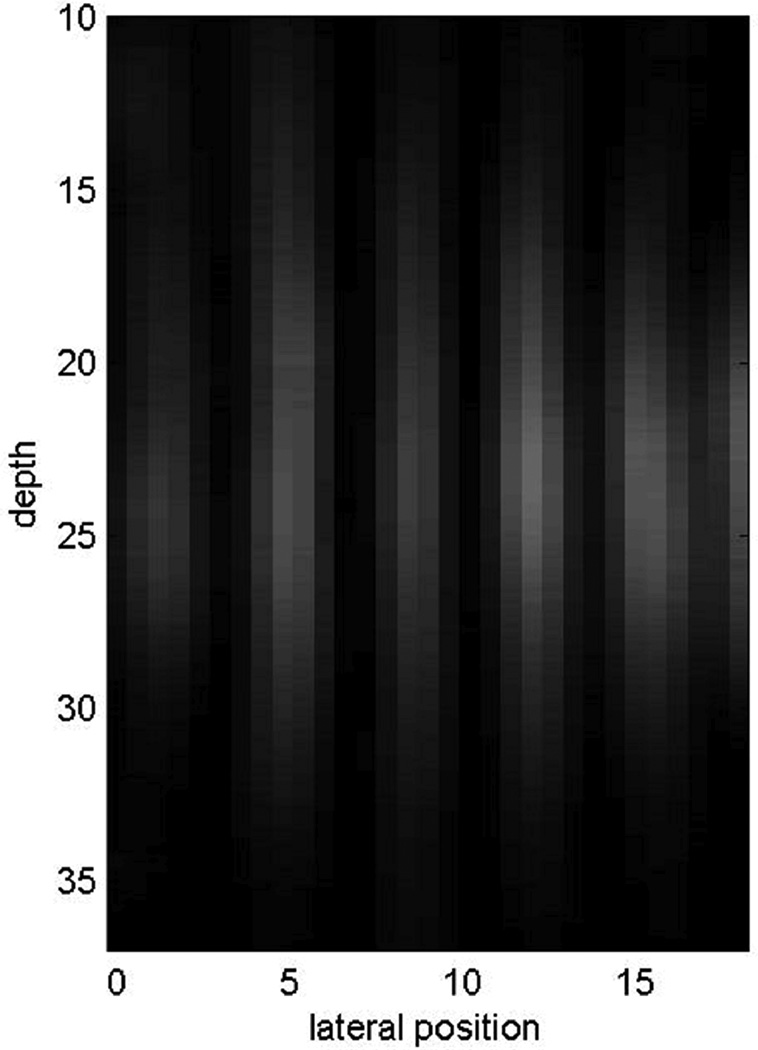
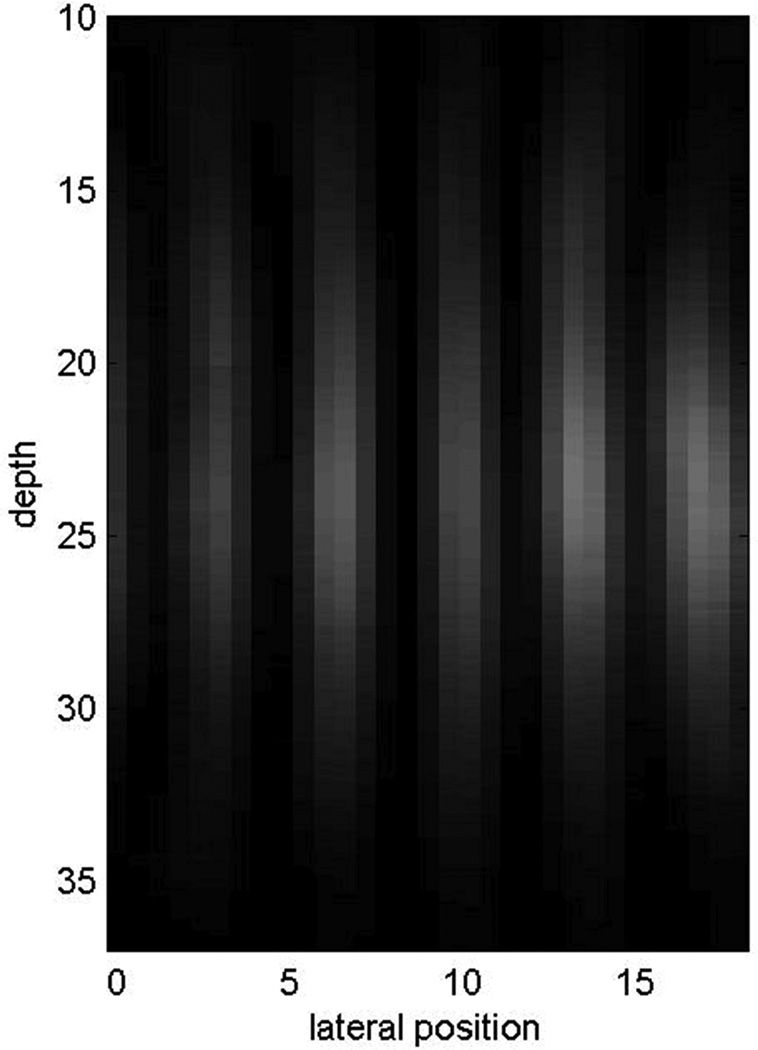
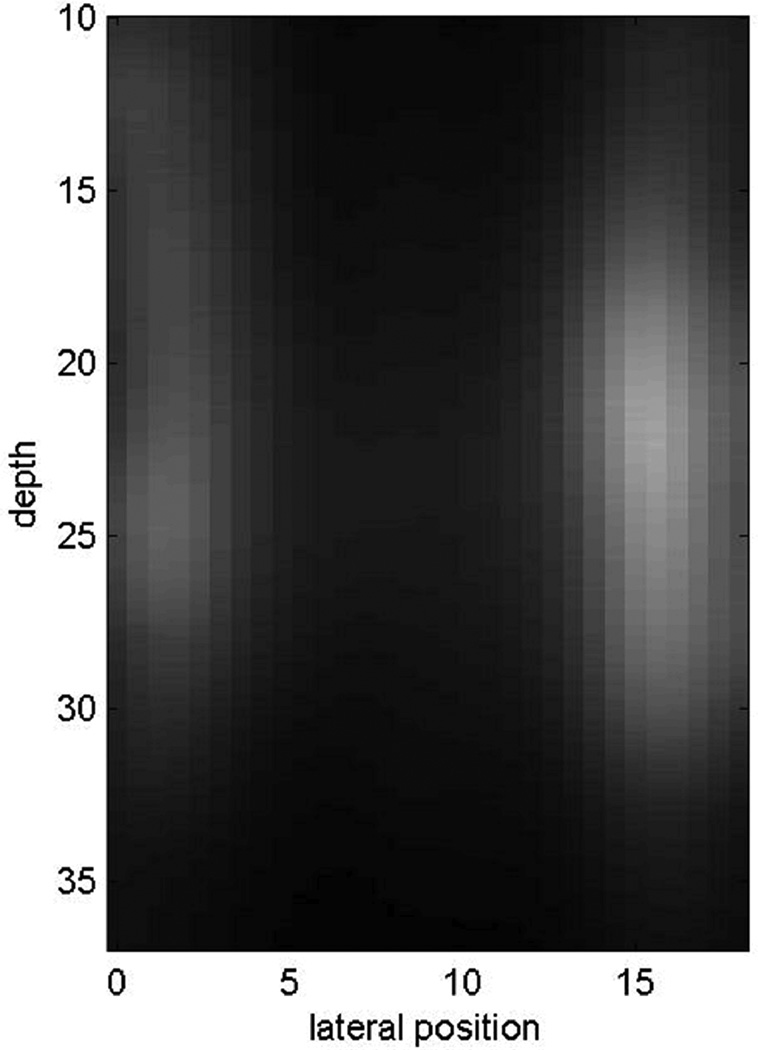
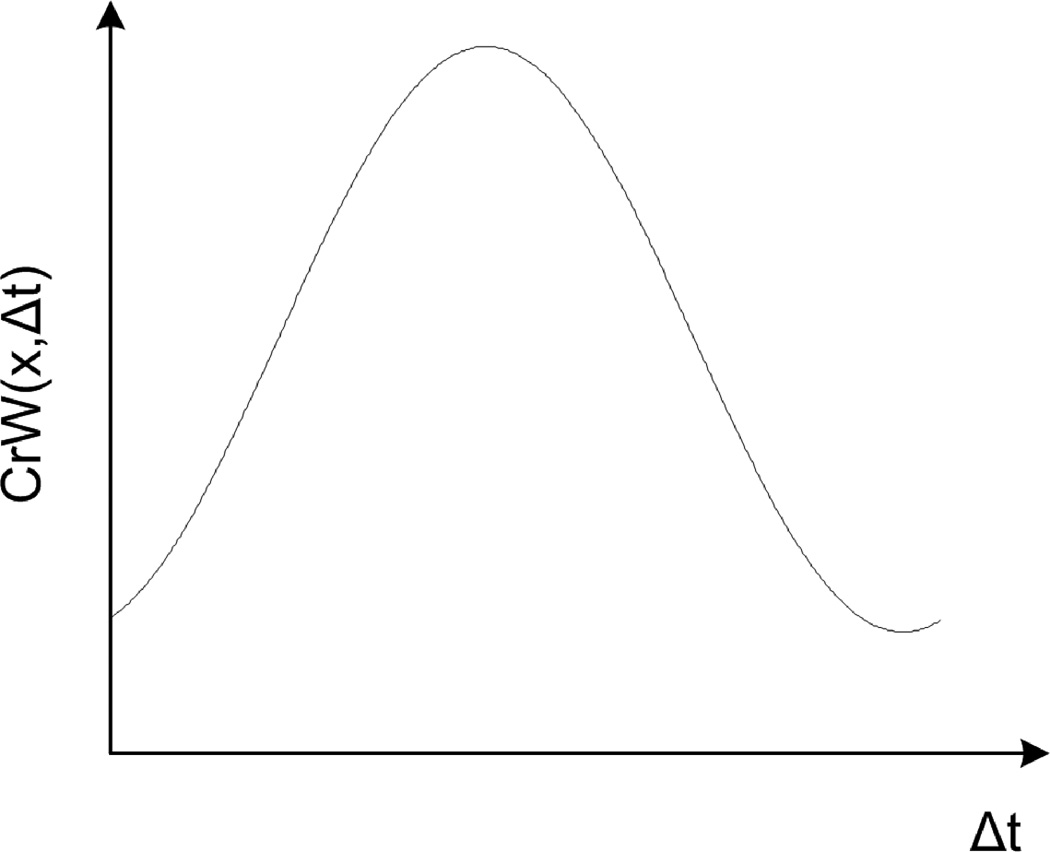
where var indicates taking the variance of the signal over one period. By varying the time, Δt, between left and right pulse trains, a series of crawling wave frames can be synthesized and the shear velocity can be extracted from that data. Fig. 4(a) is a pictorial representation of this interference phenomenon. The solid lines represent the wavefronts of the shear displacement created by the left push, traveling through the ROI from the left to right. The dotted lines represent the waves traveling from right to left and generated by the push on the right side of the ROI. The multiple lines correspond to the synthetically created multiple pushes, with Tυ seconds between the simulated pushes. The point of intersection between the solid and dotted lines represents the points of maximum constructive interference between the two waves. The delay between the left and right waveforms, Δt, is also illustrated in Fig. 4(a). Figs. 4(b) and 4(c) show the resulting displacement images for two particular Δt values: 0 ms and 2 ms respectively. The depth at which these displacements are calculated is 25 mm and Tυ = 4 ms (fυ = 250 Hz). Fig. 4(d) and 4(e) show profiles from the center of the ROI for the same two values of Δt. The waves from each side and the sum of the waves are shown on the figures. For each spatial point, the sum of the left and the right signal changes as a function of Δt. Calculating the variance of the sum, over one period, as a function of Δt provides a type of crawling wave interference pattern as shown for one spatial location in Fig. 4(f). A curve similar to that shown in Fig. 4(f) can be created for each spatial location. The variance at each location for a given value of Δt can be displayed as an image, and a stack of these images for varying values of Δt can be shown as a movie. In such a movie the interference pattern can be seen to move or ‘crawl’ across the ROI. Fig. 5 demonstrates the ability to create ARC waves using the displacement data. Figs. 5(a)–(c) are frames of a crawling wave interference movie for three different values of Δt and for Tυ = 2 ms (fυ = 500 Hz). The ‘fingers’ of the interference pattern can be seen to move through the ROI. Figs. 5(d) and 5(e) show interference patterns for a single value of Δt for lower frequencies, fυ = 125 Hz and 250 Hz respectively. The interference movies can be further analyzed with a group of local shear speed estimators.
Figure 5.
Derived interference patterns of the left and the right push using the delay-add method. (a)–(c) show the movement of the interference pattern at fυ=500Hz. (d) and (e) show the interference pattern at fυ=125Hz and 250Hz, respectively.
While the delay-add method provides a synthesized CrW movie, the movie contains the harmonic components of the fundamental frequency at which the movie was synthesized. Filtering around the frequency band of interest can allow one to extract the parameters for that frequency. However, an alternative method of synthesis would be a more direct way to achieve the filtering: convolution with a sinusoid. This method assumes that the displacement obtained from the left and the right push has sufficient energy in the frequency band of interest. For the impulsive excitations used in the experiments described here, the duration of the push is very small relative to the period, Tυ, of the synthesis. For a reasonable choice of frequencies, there will be an ample signal and the displacements measured approximate an impulse response. The steady state response at fυ due to the left and the right push would then be
| (8) |
The convolution of the impulse response with the sine wave can viewed as a filter in the frequency domain. In the frequency domain, the sine wave’s transform is a delta function at the frequency of the sine wave which is multiplied by the frequency response of the shear wave. Because the length is truncated, there is broadening of the frequencies extracted by the convolution with a sinc function. However, the harmonic components present in the standard delay-add method would be suppressed. The crawling wave would then be generated as
| (9) |
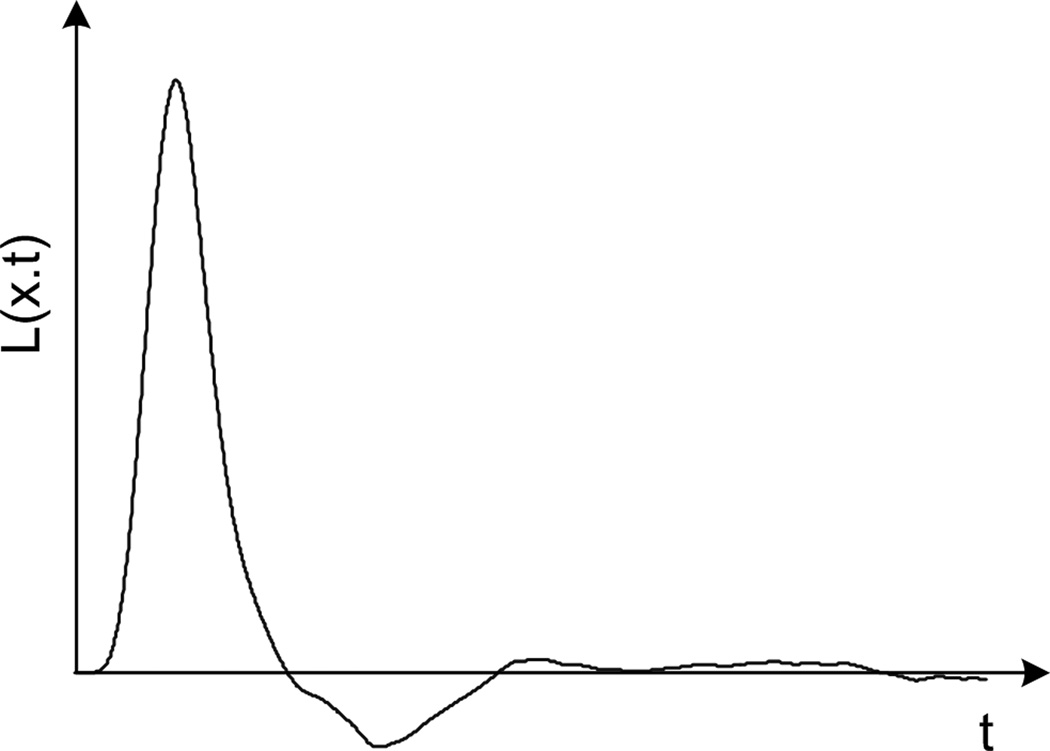
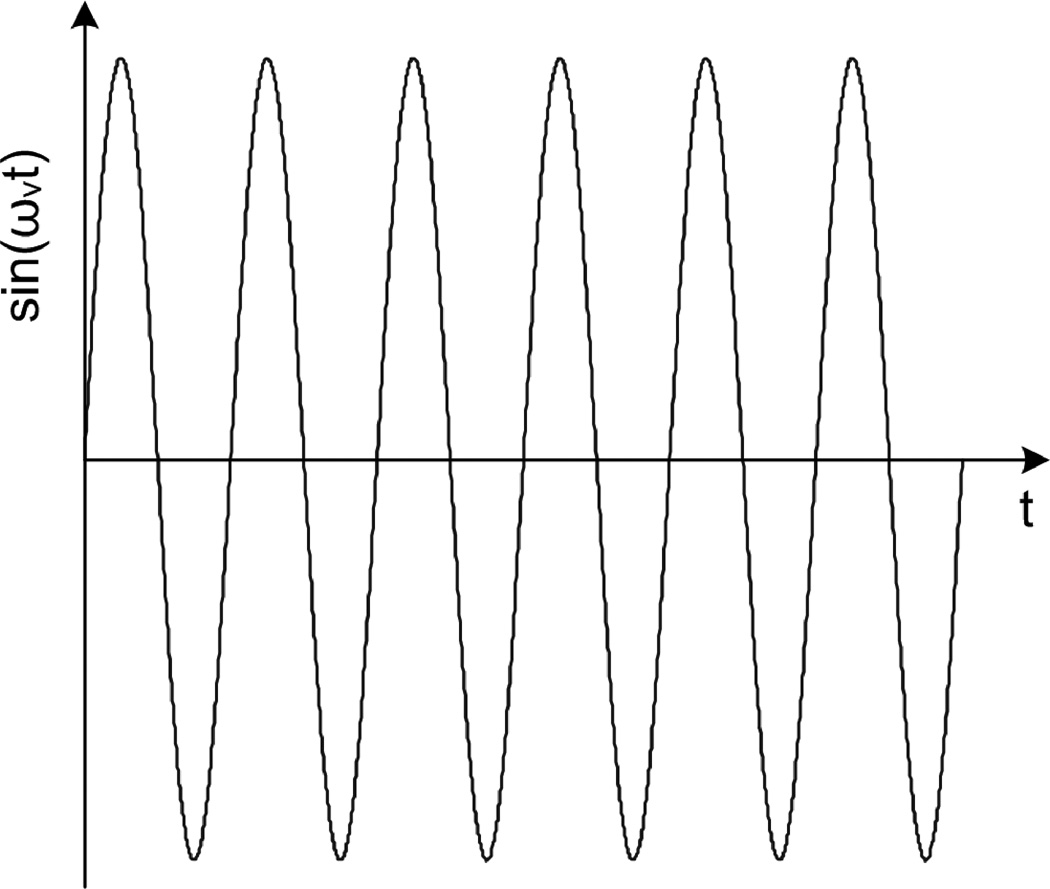
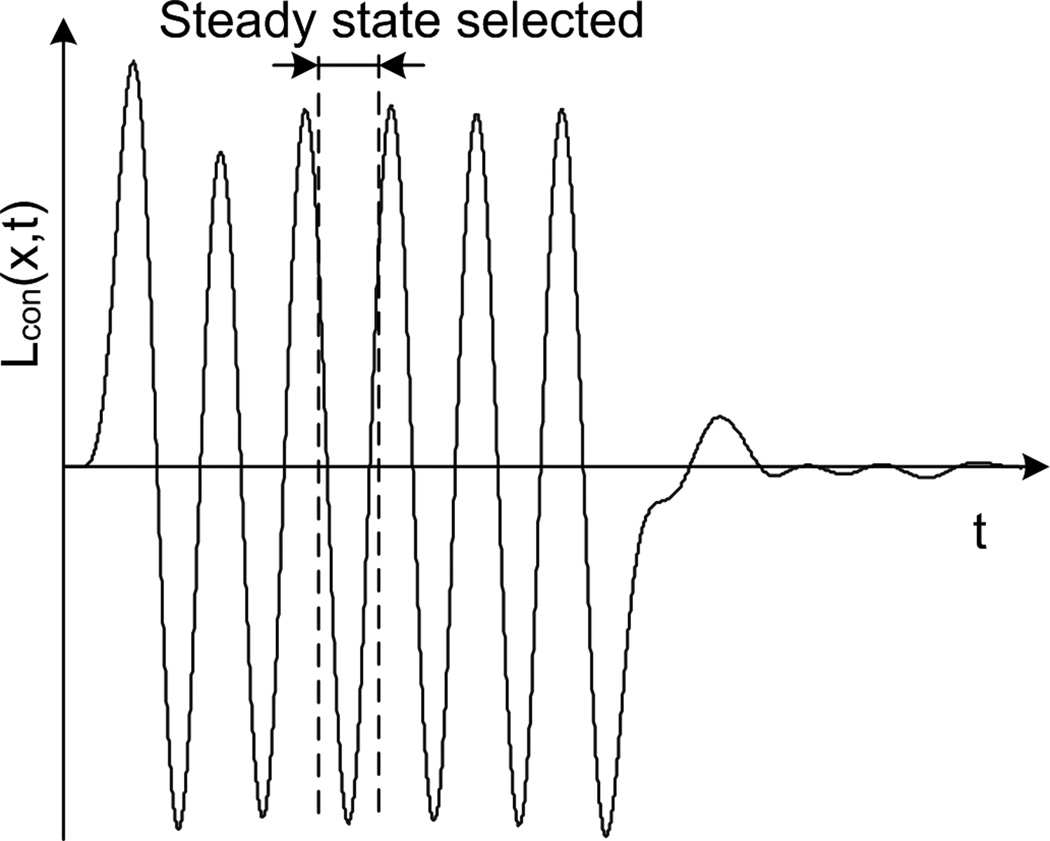
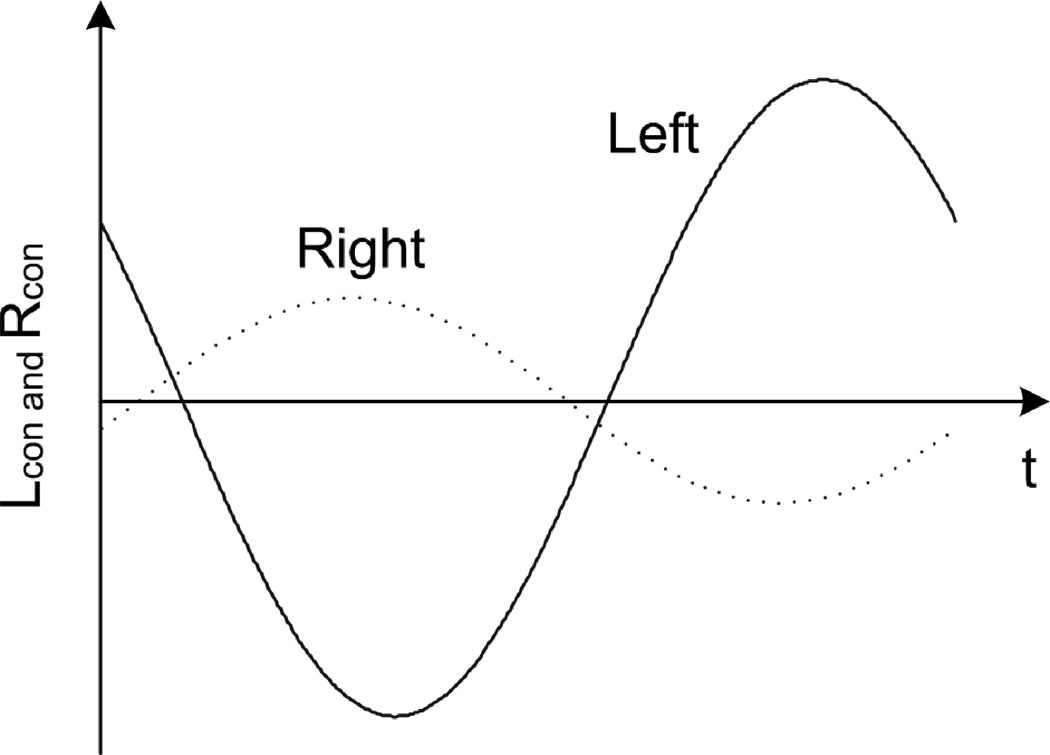
Fig. 6 illustrates the procedure of the sine wav e convolution-based synthesis method. The displacement from the left push, shown in Fig. 6(a), is convolved with a sinusoidal tone burst (Fig. 6(b)) of frequency fυ =150 Hz resulting in Fig. 6(c). One period of the steady state is shown in Fig. 6(d) for both the left and right push. By varying the time between the left and right pushes, Δt, the variance as a function of this delay can be calculated over an entire period, as shown in Fig. 6(e). Using this method at multiple frequencies allows one to determine the dispersion, and ultimately to fit to models of the shear speed, shear modulus, and viscosity parameters.
Figure 6.
Procedure of crawling wave (CrW) synthesis based upon convolution. A displacement recorded from the left push (a) is convolved with a sinusoid (b) to synthesize the CrW movie to produce the waveform shown in (c). Selecting a period of the steady state produces Lcon and Rcon shown in (d). By shifting one relative to the other, a complete cycle is generated as shown in (e).
Experimental materials
Three experiments are described. In each of the experiments, displacement data was collected from the left and right radiation force push. The axicon focus described in the companion paper (Part 1) was selected to lower the peak intensity while creating a longer axial source, as compared to conventional focus. The displacement data was used to create crawling wave movies by using the convolution method, and the crawling wave movie was analyzed to extract the shear wave speed for the vibration frequency. The constructed phantoms include a gelatin phantom with a cylindrical inclusion, an oil-gelatin phantom, and two mouse livers ex-vivo.
A gelatin phantom (an ‘inclusion’ phantom) with a cylindrical inclusion was fabricated with an inclusion, 6mm in diameter, of 16% gelatin against a background of 8% gelatin. The procedure to fabricate the phantom is as follows: 51.5g gelatin (300 Bloom Pork Gelatin, Gelatin Innovations Inc., Schiller Park, IL, USA), 4.5 g NaCl and 0.75 g of agar were added to 500 mL of de-ionized water, and the mixture was heated to 55 °C. After all the components dissolved, the mixture was further cooled to approximately 30 °C, and poured into cylindrical molds and allowed to rest at 4 °C overnight. Once formed, the inclusion was removed from the mold and suspended in a cubic phantom mold. An 8% gelatin background was created by heating a mixture of 1.8 L de-ionized water, 148.3 g gelatin, 16.2 g NaCl, and 2.7 g agar to 55 °C. The mixture was then cooled in an ice water bath to approximately 30 °C and poured into the cubic gelatin mold containing the cylindrical inclusion. The mold was then allowed to rest at 4 °C overnight. The 8% gelatin background was also used to suspend the mouse livers as will be discussed in the next section.
Another phantom, an oil-based gelatin phantom, was created to check the dispersion. It consisted of 11% gelatin and 25% castor oil. 110g gelatin (300 Bloom Pork Gelatin, Gelatin Innovations Inc., Schiller Park, IL, USA) and 1 g antibacterium (Germall Plus, Lotioncrafter, Olga, WA, USA) were added to 1 L of de-ionized water, and the mixture was heated to 90 °C (molten gelatin). The molten gelatin was placed in an ice water bath and cooled to roughly 55 °C at which point 30mL castor oil and 7.7mL surfactant (Ultra Ivory, Procter & Gamble, Cincinnati, OH, USA) were emulsified into the mixture. The mixture was further cooled to approximately 30 °C, poured in a cubic mold and allowed to rest at 4 °C overnight.
A third phantom, mouse phantom, is a gelatin phantom containing mouse livers. The livers, obtained by hepatectomy, were suspended in a cube-shaped mold of dimension 8.5 cm × 10cm × 19cm. Two mo use livers were suspended in the mold and the 8% gelatin phantom previously described was poured into the cubed gelatin mold containing the mouse livers. The mold was then placed in an ice water bath for roughly 90 minutes, cooling it from 35 °C to 15 °C. The size of the liver in the scanning cross-section was approximately 2 cm × 3cm for the fatty liver, and 1.5 cm × 1.4 cm for the normal liver.
Results and discussions
Crawling waves synthesized from the displacement fields generated from the short push on the left and the right side were utilized to estimate the elastic properties of each medium. Data was acquired with the setup and parameters explained in the part 1 of this paper, ROI (region of interest) of 4cm depth and 18mm width, a push tone burst of 5MHz 250µs long, PRF (pulse repetition frequency) of 2.5kHz, and 48 tracking vectors firings in the packet.
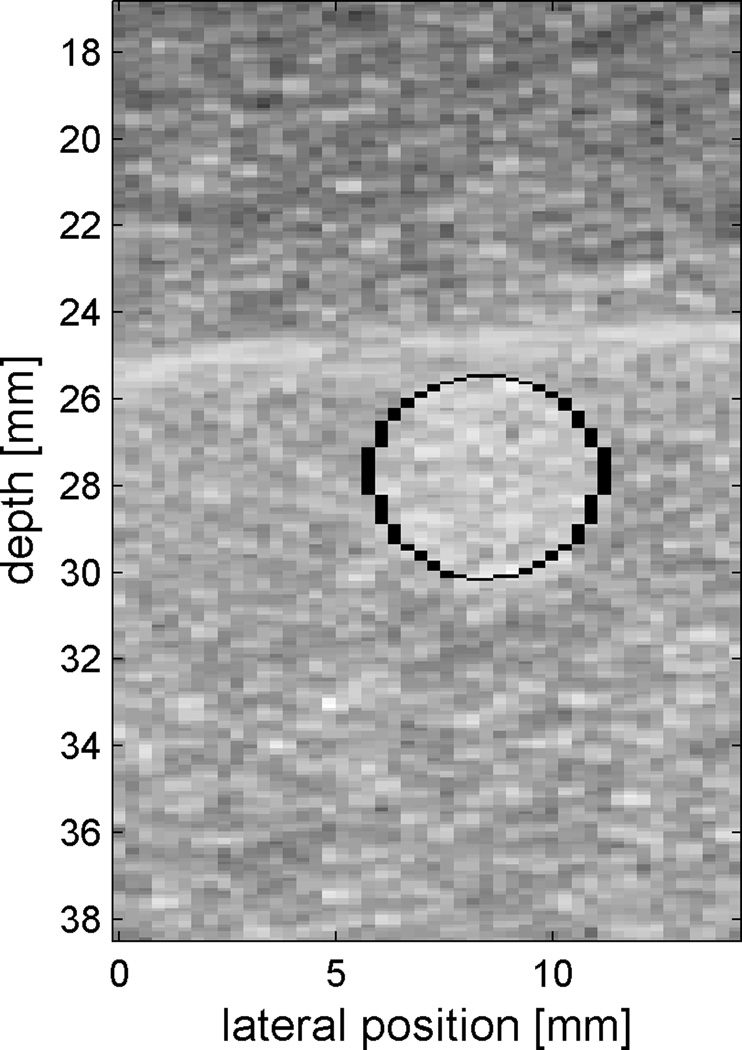
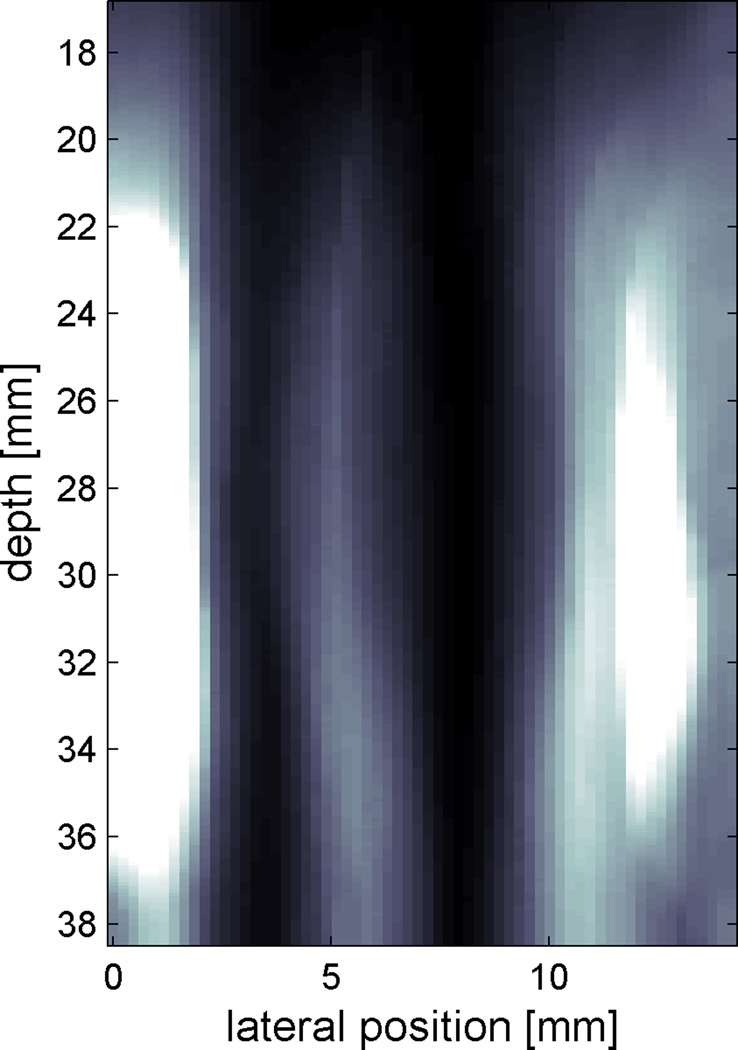
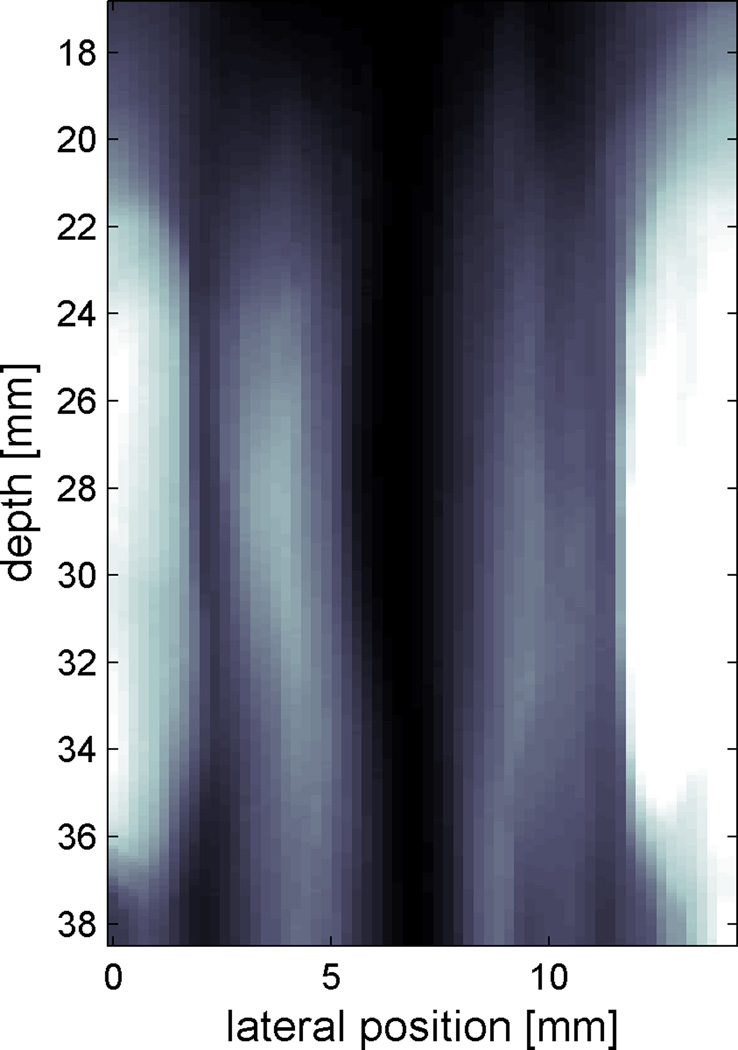
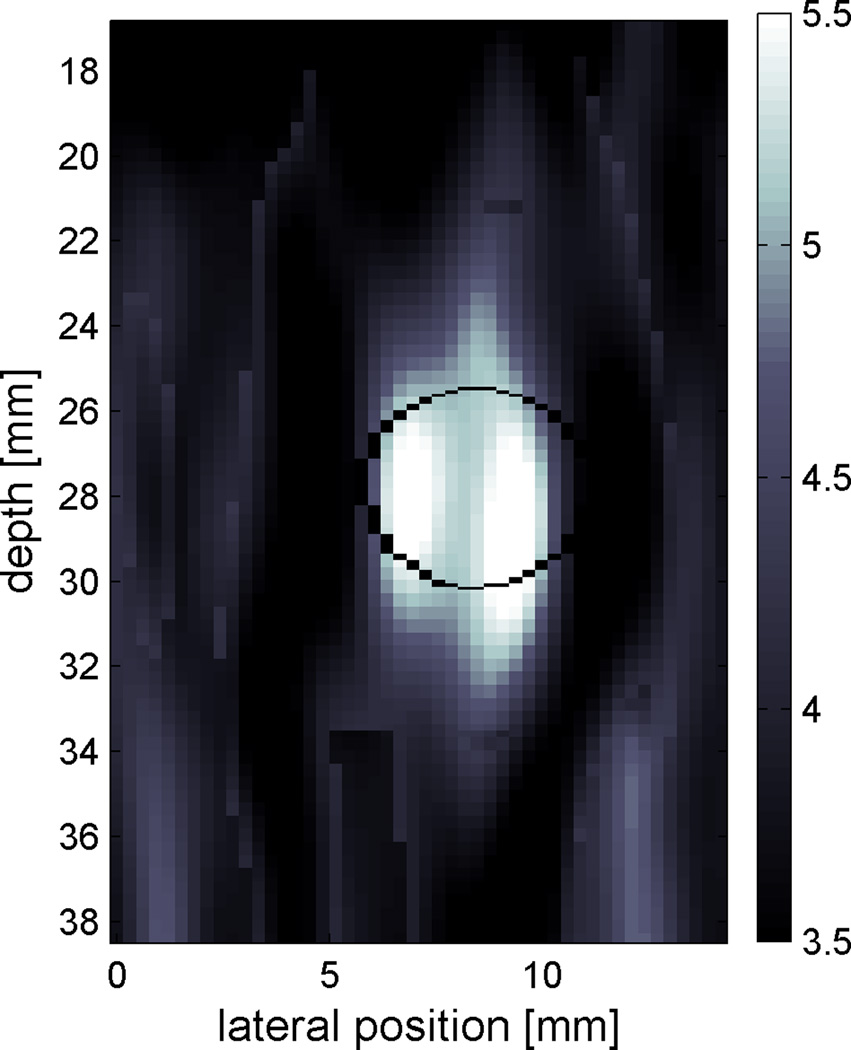
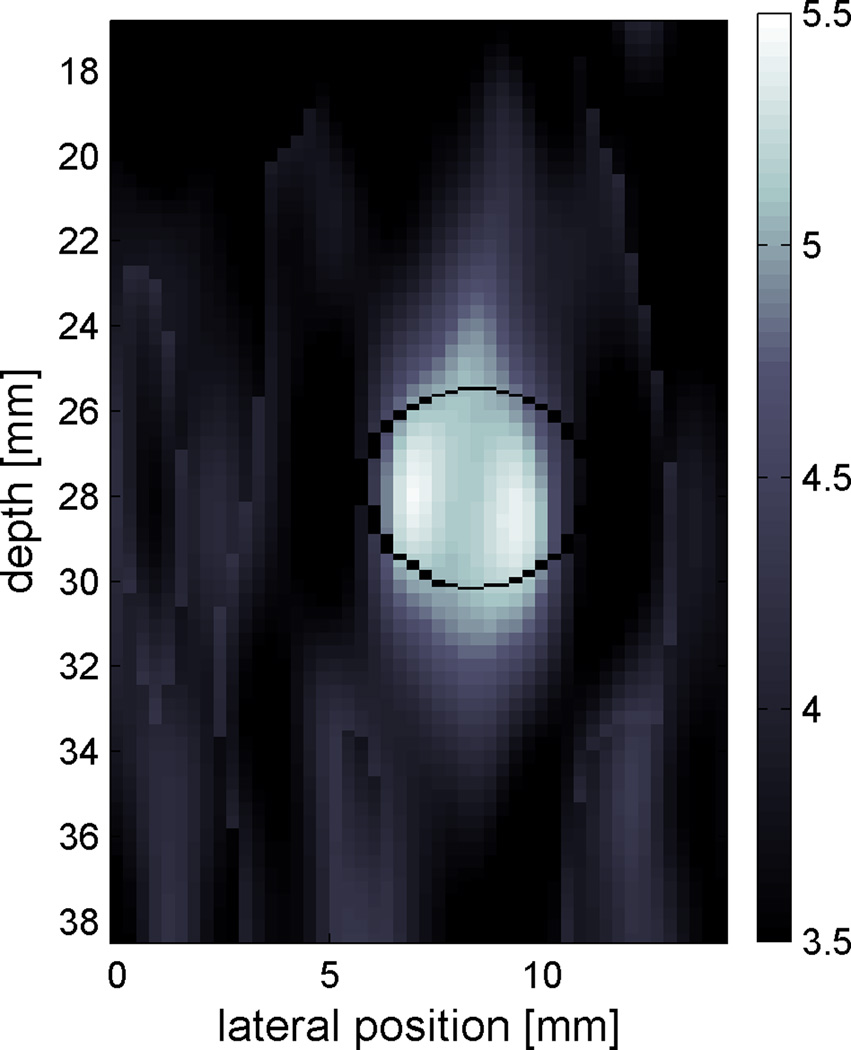
Fig. 7 shows a B-mode image of the inclusion phantom, two sample images of the synthesized ARC wave movies at 250 Hz and 300Hz respectively using Eq. (9), and shear speed estimation results at the two frequencies of CrW synthesis. The shear speed estimation results of Figs. 7(d) – (e) are shown with the outline of the inclusion. The estimated shear speed was approximately 3.5 m/s for the 8% background and 5.4 m/s for the inclusion. It should be noted that shear speed is sensitive to temperature of the phantom, the lower temperature the higher the estimated speed. The data of Fig. 7 was obtained at about 16 °C, lower than room temperature. That is why the estimated speed is a little higher than previous estimation of similar phantoms by Hoyt et al. (2008). The resolution increases with the synthesis frequency, as can be seen comparing Figs. (d) – (e). Since the propagation direction of crawling waves is horizontal, the horizontal resolution is better than the vertical resolution.
Figure 7.
A B-mode image of the phantom with a 6mm inclusion is shown in (a) with an outline of the inclusion. Two frames of the CrW movie synthesized at 250Hz and 300Hz are shown in (b) and (c) respectively. Gray scale is relative variance of displacement over time. The estimated shear speed images are shown in (d) and (e) for the frequency of synthesis at 250Hz (d), and 300Hz (e), respectively.
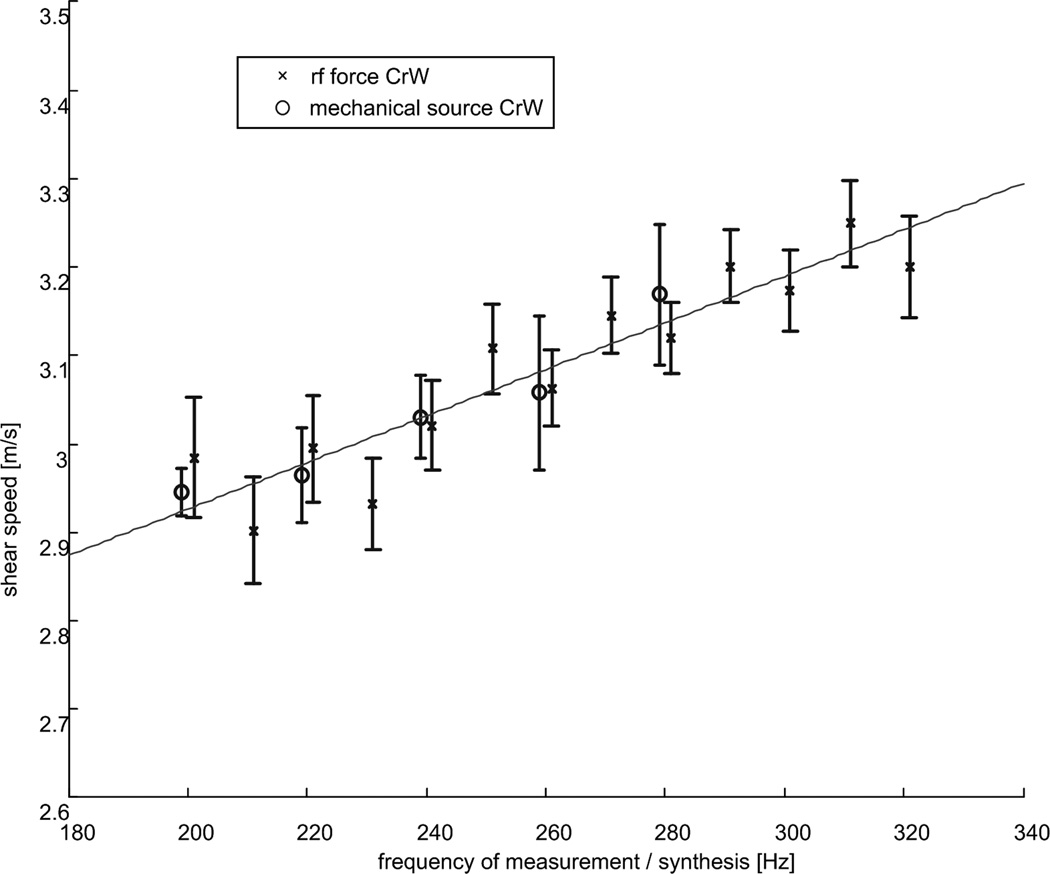
It is known that the shear wave speed of a viscoelastic medium is a function of frequency (Chen et al., 2009; Deffieux et al., 2009; Oestreicher, 1951; Blackstock, 2000). The oil-gelatin phantom described in the previous section was scanned both with mechanical vibrators at different frequencies ranging from 200 Hz to 280 Hz and with radiation force pushes, from which crawling waves were synthesized for frequencies from 200 Hz to 320 Hz according to Eq. (9). The results are shown in Fig. 8. Due to the viscosity provided by the oil, the phantom should exhibit dispersion and this is seen in the resulting data. Both the results from the mechanical and the synthesized crawling waves show a good match, both displaying change of shear speed with frequency. The dispersion shown in Fig. 8 was calculated to have the slope of 0.26 m/s per 100 Hz. This example demonstrates the additional use of crawling waves to assess dispersion over a range of accessible shear wave frequencies.
Figure 8.
Dispersion measurement for the oil-gelatin phantom. The phantom consists of 11% gelatin and 30% castor oil. Due to the viscosity provided by the oil, the phantom is expected to have significant dispersion as this result verifies. The results from the CrW with mechanical CW vibrators and the synthesized CrW from radiation force pushes are shown. The error bars indicate the standard deviation of the processed region of interest. The dispersion shows the slope of 0.26m/s per 100Hz.
This approach was further applied to two mouse livers ex-vivo: one normal and one fatty liver. A Leptin-deficient mouse is a well characterized model of morbid obesity, type 2 diabetes, and marked with the hepatic steatosis (Pelleymounter et al., 1995). The mice were purchased (Jackson Laboratories, Bar Harbor, ME, USA) and housed in a vivarium (University of Rochester, Rochester, NY, USA) at least for a week before they were sacrificed1. The livers were embedded in gelatin and were scanned using both mechanical vibration sources and radiation force pushes. The shear wave speed estimation results are shown in Fig. 9 for frequencies from 220 Hz to 310 Hz. The shear speed of the normal mouse liver (shown as a circle in Fig. 9, shows mean speed of about 2.55 m/s. On the other hand, shear speed for the fatty liver, shown as a square for radiation force crawling wave and as a star for mechanical source crawling wave respectively) is lower, in the range of 2.2 m/s – 2.37 m/s. It is hypothesized that the increased fat content of mouse liver gives rise to higher viscosity, which contributes to the dispersion of shear speed as was also shown for the oil-gelatin phantom shown in Fig. 8. Different viscoelastic models could be fit to the data, however, a larger frequency band would be required to have high confidence in the parameter fit (Sridhar and Insana, 2007; Sridhar et al., 2007; Caputo, 1967).
Figure 9.
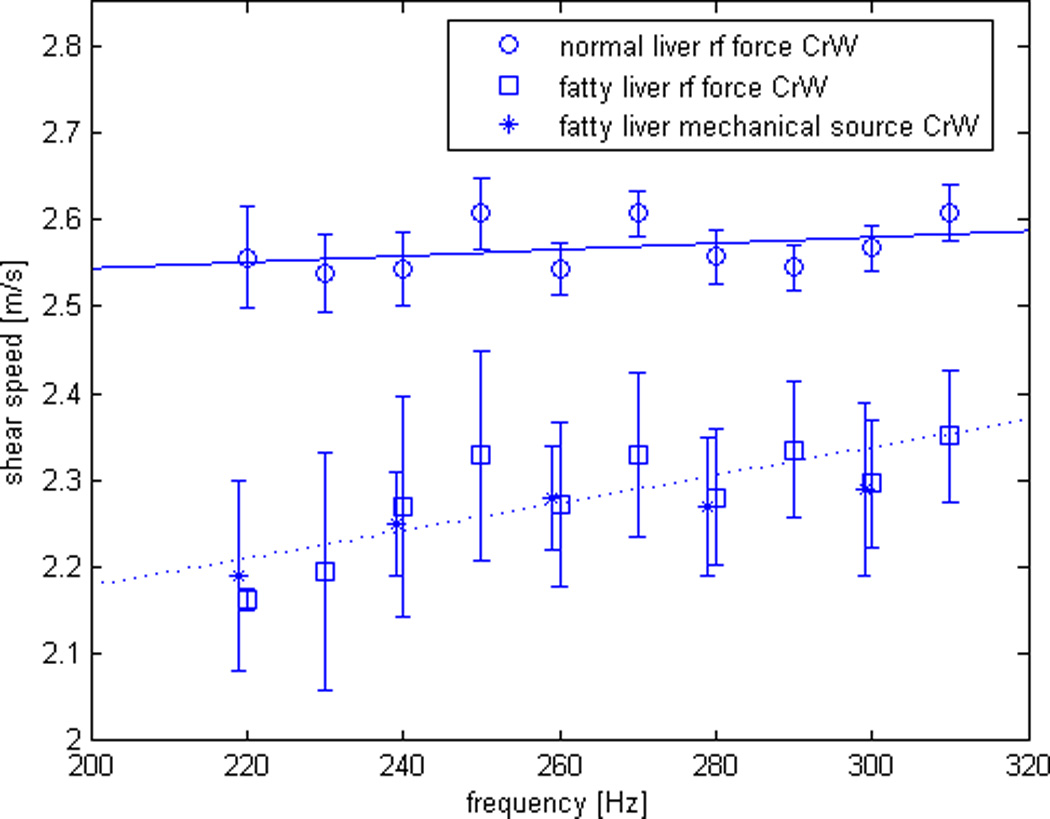
Shear speeds estimated from the synthesized crawling wave movies at different frequencies. Two mouse livers, one normal and one fatty, were chosen. The normal mouse liver shows higher shear speed than fatty mouse liver. The fatty mouse liver shows larger dispersion.
The results from synthetic crawling waves are found to be closely comparable to those derived from the use of mechanical shear wave sources, in phantoms and mouse livers. This suggests that either method (radiation force push or mechanical shear wave sources) can be employed to create crawling waves. However, in phantoms, the use of mechanical crawling waves produce a larger displacement (higher SNR), over a larger region of interest, and without any significant heating concerns.
Conclusion
Crawling waves can be created from radiation force pulses on the right and left sides of a ROI that generate opposing shear waves. The shear waves can be created by a long series of pulses on each side, or equivalently they can be calculated from the response to a single pulse from each of the right and left side of the ROI. The calculated crawling waves can be derived for a set of frequencies within the bandwidth of the original propagating shear waves.
This has the advantage of separating out the phase velocities at discrete frequencies, and leads to a measurement of the dispersion, or change in velocity over frequency. The dispersion in tissues is related to the lossy or viscoelastic behavior of tissues, and therefore is a potentially valuable parameter to assess. The crawling waves produced by this integrated system are also capable of resolving small inhomogeneities on the order of 3mm in radius.
Acknowledgments
This work was supported by NIH Grant 5R01AG016317-07 in a partnership with GE and Rensselaer Polytechnic Institute.
Footnotes
Publisher's Disclaimer: This is a PDF file of an unedited manuscript that has been accepted for publication. As a service to our customers we are providing this early version of the manuscript. The manuscript will undergo copyediting, typesetting, and review of the resulting proof before it is published in its final citable form. Please note that during the production process errors may be discovered which could affect the content, and all legal disclaimers that apply to the journal pertain.
This document is a collaborative effort
All animal protocols are approved by the University of Rochester Committee on Animal Resources (IACUC Approval Date 1/4/2010, Animal Welfare Assurance Number A329201)
Its contents are solely the responsibility of the authors and do not necessarily represent the official views of the NIH.
References
- Blackstock D. Fundamentals of physical acoustics. New York: 2000. [Google Scholar]
- Caputo M. Linear models of dissipation whose q is almost frequency independent-ii. Geophys J R Astr Soc. 1967;13:529–539. [Google Scholar]
- Castaneda B, An L, Wu S, Baxter L, Yao J, Joseph J, Hoyt K, Strang J, Rubens D, Parker K. Prostate cancer detection using crawling wave sonoelastography. Proc of SPIE. 2009;7265:726513–1–726513–10. [Google Scholar]
- Castaneda B, Hoyt K, Zhang M, Pasternack D, Baxter L, Nigwekar P, Sant’Agnese A, Joseph J, Strang J, Robens D, Parker K. Prostate cancer detection based on three dimensional sonoelastography; Proc IEEE Ultrasonics Symp; 2007. pp. 1353–1356. [Google Scholar]
- Chen S, Urban M, Pislaru C, Kinnick R, Zheng Y, Yao A, Greenleaf J. Shearwave dispersion ultrasound vibrometry (sduv) for measuring tissue elasticity and viscosity. IEEE Trans. Ultrason. Ferroelectr. 2009;56:55–62. doi: 10.1109/TUFFC.2009.1005. [DOI] [PMC free article] [PubMed] [Google Scholar]
- Deffieux T, Montaldo G, Tanter M, Fink M. Shear wave spectroscopy for in vivo quantification of human soft tissues viscoelasticity. IEEE Trans. Med. Imaging. 2009;28:313–322. doi: 10.1109/TMI.2008.925077. [DOI] [PubMed] [Google Scholar]
- Fatemi M, Greenleaf J. Ultrasound-stimulated vibro-acoustic spectrography. Science. 1998;280:82–85. doi: 10.1126/science.280.5360.82. [DOI] [PubMed] [Google Scholar]
- Gao L, Parker K, Alam S, Lerner R. Sonoelasticity imaging: Therory and experimental verification. J Acoust Soc Am. 1995;97:3875–3886. doi: 10.1121/1.412399. [DOI] [PubMed] [Google Scholar]
- Hah Z, Cho Y, An L, Hazard C, Rubens D, Parker K. Methods for generating crawling waves with radiation force from ultrasonic beams. J Ultrasound Med. 2010a;29:S60. [Google Scholar]
- Hah Z, Hazard C, Cho Y, Rubens D, Parker K. Crawling waves from radiation force excitation. Ultrasonic Imaging. 2010b;32:177–189. doi: 10.1177/016173461003200305. [DOI] [PubMed] [Google Scholar]
- Hah Z, Hazard C, Rubens D, Parker K. Synthesis and analysis of crawling waves generated from radiation force. Proc. of the ninth international conference on the ultrasonic measurement and imaging of tissue elasticity. 2010c;058:119. [Google Scholar]
- Hoyt K, Castaneda B, Parker K. Two-dimensional sonoelastographic shear velocity imaging. Ultrasound Med Biol. 2008;34:276–288. doi: 10.1016/j.ultrasmedbio.2007.07.011. [DOI] [PubMed] [Google Scholar]
- Hoyt K, Parker K, Rubens D. Sonoelastographic shear velocity imaging: experiments on tissue phantom and prostate; Proc IEEE Ultrasonics Symp; 2006. pp. 1686–1689. [Google Scholar]
- Hoyt K, Parker K, Rubens D. Real-time shear velocity imaging using sonoelastographic techniques. Ultrasound Med Biol. 2007;33:1086–1097. doi: 10.1016/j.ultrasmedbio.2007.01.009. [DOI] [PubMed] [Google Scholar]
- Konofagou E, Hynynen K. Localized harmonic motion imaging: theory, simulations and experiments. Ultra sound Med Biol. 2003;29:1405–1413. doi: 10.1016/s0301-5629(03)00953-0. [DOI] [PubMed] [Google Scholar]
- Mariappan Y, Rossman P, Glaser K, Manduca A, Ehman R. Magnetic resonance elastography with a phased-array acoustic driver system. Magnetic Resonance in Medicine. 2009;61:678–685. doi: 10.1002/mrm.21885. [DOI] [PMC free article] [PubMed] [Google Scholar]
- McLaughlin J, Parker K, Renzi D, Wu Z. Shear wave speed recovery using interference patterns obtained in sonoelastography experiments. J Acoust Soc Am. 2007;121:2438–2446. doi: 10.1121/1.2534717. [DOI] [PubMed] [Google Scholar]
- McLaughlin J, Renzi D. Shear wave speed recovery in transient elastography and supersonic imaging using propagating fronts. Inverse Problems. 2006;22:681–706. [Google Scholar]
- Oestreicher L. Field and impedance of an oscillating shpere in a viscoelastic medium with an application to biophysics. J Acoust Soc Am. 1951;23:707–714. [Google Scholar]
- Pelleymounter M, Cullen M, Baker M, Hecht R, Winters D, Boone T. Effects of the obese gene product on body weight regulation in ob/ob mice. Science. 1995;269:540–543. doi: 10.1126/science.7624776. [DOI] [PubMed] [Google Scholar]
- Rouze N, Wang M, Palmeri M, Nightingale K. Robust estimation of time-of-flight shear wave speed using a radon sum transformation. IEEE Trans. Ultrason. Ferroelectr. 2010;57:2662–2670. doi: 10.1109/TUFFC.2010.1740. [DOI] [PMC free article] [PubMed] [Google Scholar]
- Sridhar M, Insana M. Ultrasonic measurements of breast elastography. Med Phys. 2007;34:4757–4767. doi: 10.1118/1.2805258. [DOI] [PMC free article] [PubMed] [Google Scholar]
- Sridhar M, Liu J, Insana M. Viscoelastic imaging using ultrasound: parameters and error analysis. Phys Med Biol. 2007;52:2425–2443. doi: 10.1088/0031-9155/52/9/007. [DOI] [PMC free article] [PubMed] [Google Scholar]
- Wu Z, Hoyt K, Rubens D, Parker K. Sonoelastographic imaging of interference patterns for estimation of shear velocity distribution in biomaterials. J Acoust Soc Am. 2006;120:535–545. doi: 10.1121/1.2203594. [DOI] [PubMed] [Google Scholar]


