Abstract
Purpose
The Patient and Observer Scar Assessment Scale (POSAS) is a questionnaire that was developed to assess scar quality. It consists of two separate six-item scales (Observer Scale and Patient Scale), both of which are scored on a 10-point rating scale. After many years of experience with this scale in burn scar assessment, it is appropriate to examine its psychometric properties using Rasch analysis.
Methods
Cross-sectional data collection from seven clinical trials resulted in a data set of 1,629 observer scores and 1,427 patient scores of burn scars. We examined the person–item map, item fit statistics, reliability, response category ordering, and dimensionality of the POSAS.
Results
The POSAS showed an adequate fit to the Rasch model, except for the item surface area. Person reliability of the Observer Scale and Patient Scale was 0.82 and 0.77, respectively. Dimensionality analysis revealed that the unexplained variance by the first contrast of both scales was 1.7 units. Spearman correlation between the Observer Scale Rasch measure and the overall opinion of the clinician was 0.75.
Conclusion
The Rasch model demonstrated that the POSAS is a reliable and valid scale that measures the single-construct scar quality.
Keywords: Quality of life, Scar quality, POSAS, Rasch, Scar assessment, Burn scar
Introduction
Burn scars are known for their impact on the quality of life due to an array of functional, cosmetic, and psychological problems, related to scarring [1–3]. Several appropriate instruments are available that have been tested and validated to evaluate scar quality [4–6]. Scar assessment scales are often used because they are easily accessible and free of charge [7, 8].
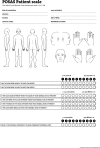
In 2004, the Patient and Observer Scar Assessment Scale (POSAS) was introduced [9], which aimed at measuring the quality of scar tissue. The POSAS consists of an Observer and a Patient Scale and includes a comprehensive list of items, based on clinically relevant scar characteristics [10]. The observer scores six items: vascularization, pigmentation, thickness, surface roughness, pliability, and surface area. The patient scores six items: pain, pruritus, color, thickness, relief, and pliability (see “Appendix”) [10].
All included items are scored on the same polytomous 10-point scale, in which a score of 1 is given when the scar characteristic is comparable to ‘normal skin’ and a score of 10 reflects the ‘worst imaginable scar’. All items are summed to give a total scar score, and therefore, a higher score represents a poorer scar quality.
Studies that compared the POSAS with the widely used Vancouver Scar Scale revealed that the former was more reliable than the latter [9, 11]. At present, the POSAS is being used to evaluate the rehabilitation process in different types of injury [11–19] and has been advocated by many for scar assessment [2, 8, 11, 20].
Currently, all available scar assessment scales, including the POSAS, have been constructed and tested following principles of the classical test theory (CTT). However, modern test theories are considered superior to the CTT as it makes stronger assumptions and provides stronger findings. For this reason, the Rasch measurement model, one of the item response theory (IRT) models, is nowadays frequently applied in quality-of-life research [21–26]. Use of Rasch methodology involves a rigorous and extensive analysis of the data and provides additional psychometric information that cannot be obtained through the CTT approach. The data are tested for fit into the Rasch model, allowing for a detailed examination of the internal construct validity of the scale, including properties such as reliability and ordering of the categories. It also determines whether a scale is unidimensional, which is required to justify summation of scores and can linearly transform raw scores from their original scale to an interval scale to allow application of parametric statistics.
After several years of using the POSAS for burn scar evaluation, it became appropriate to subject this tool to modern test theories. For this reason, we decided to apply the Rasch model [27] to our data.
Materials and methods
Data collection
Observer and Patient Scale scores were collected from a large database including five single-center and two multicenter clinical trials involving burn scars. All scores were obtained by clinical evaluation of the scars. In these trials, the scars were usually scored by multiple observers and also on multiple time points. These scores were all included in the analysis because Rasch analyzes the measurement scale and not the scar outcomes of the different treatment strategies.
Data analysis
The POSAS data were transferred into the Rasch rating scale model using the Winsteps measurement software [28] (Winsteps® Rasch Measurement Version 3.69.1, Chicago, Illinois, USA). The following analyses were performed:
Constructing the person–item map (Wright map);
Testing of (mis)fit between the data and the model;
Estimating the person and item reliability and separation coefficient;
Testing the ordering of the categories;
Analyzing the dimensionality;
Predictive validity;
Converting the logit scale to more meaningful units.
Person–item map
A map was constructed of the hierarchy of the person and item measures for both the Observer and Patient Scales to examine item and person performances. At the bottom of the map, the lower estimates of the person and item can be found, with increasing estimates represented higher up the map. On the left side, the patient performances are represented and on the right side the items. For a well-targeted measure, the mean location for the person should be around zero logits.
Test of (mis)fit to the model
To determine how well the empirical data fit the Rasch model, chi-square fit statistics were calculated. These fit statistics are the infit mean square (infit MNSQ) and the outfit mean square (outfit MNSQ). The infit MNSQ represents the information-weighted mean square residual difference between observed and expected responses. The infit statistics are sensitive to unexpected responses near the person’s ability level. The outfit statistic is the usual unweighted mean square residual and is more sensitive to outliers. The expected infit or outfit mean square values are 1.0. A mean square greater than 2.0 indicates more misinformation than information. Values should range between 0.5 and 1.7 for clinical observations [29]. High infit and outfit reflect underfit, which means lack of predictability of an item. Low infit and outfit reflect overfit, which means over-predictability of an item.
Reliability and separation statistics
In the Rasch model, reliability is estimated both for persons and for items. Person reliability in Winsteps is equivalent to the test reliability (Cronbach’s alpha) in the classical test theory. The person reliability reports how reproducible the person’s ability order is in this sample of persons for this set of items. The item reliability reports how reproducible the item’s difficulty order is for this set of items for this sample of persons. The higher the separation, the better the instrument is at differentiating person ability and item difficulty. Separation is measured on a continuous scale bounded by zero and infinity, which is an advantage over psychometric reliability which only ranges between zero and one. The person separation index can be used to calculate the number of distinct levels of scar quality (strata) that the items can distinguish [Strata = (4 × person separation index + 1)/3] [30, 31].
Category function
Category functioning is examined by analyzing category frequencies, mean measures, thresholds, and category fit statistics [32]. The items of the both the Observer and the Patient Scale have ten categories. The category frequencies indicate how many observers chose a particular response category. The recommended minimal number of responses per category is ten for stable rating scale–structure threshold parameter estimates [32]. The mean measures and the thresholds should increase when moving from lower to higher categories. Guidelines recommend that thresholds should increase by at least 1.4 logits, to show distinction between categories, but not more than 5 logits. When there are ordered categories, the category probability curves show that each category is the most probable category at some point on the latent variable. The partial credit model can be used when the rating scale is specific for each, which is not the case in the POSAS. Nevertheless, this model also allows you to examine different category functioning in individual items.
Dimensionality investigation
According to the Rasch methodology, when the data fit the Rasch model, the Rasch dimension is the only dimension in the data. Rasch factor analysis is a factor analysis of the residuals that remain after the linear Rasch measure has been extracted from the data set. A secondary dimension in the data must explain at least 2 items worth of variance: unless a component has the strength of at least 2 items, it may merely be due to an idiosyncratic item.
Predictive validity
All observers gave their overall opinion on the quality of the scar by assessing the item ‘overall opinion’. This item does not contribute to the total score and was shown to have a single ICC of 0.81 (95% CI: 0.75–0.86) [10]. It was used to calculate the Spearman correlation with the Observer Scale Rasch measure indicating the predictive validity of Observer Scale. The same method was performed with the patient’s overall opinion (single ICC: 0.84 (95% CI: 0.77–0.89)) on the scar and the Patient Scale Rasch measure.
Converting the logit scale to more meaningful units
The item measures in logits were rescaled to the user-friendly range of zero to 100 of the Observer and Patient Scale.
Results
The data collection resulted in the use of 1,629 Observer Scale scores and 1,427 Patient Scale scores taken from 707 patients of whom 393 were men and 314 were women. The mean age of the patients at the time of the measurement was 28 years (median 24 years and range 0.4–86 years). One hundred and eighty patients were under 6 years whereby the parents or caregiver completed the Patient Scale for the child. The measured scars had a mean age of 1.8 years (median 0.3 years and range 0.1–40 years).
The person–item maps
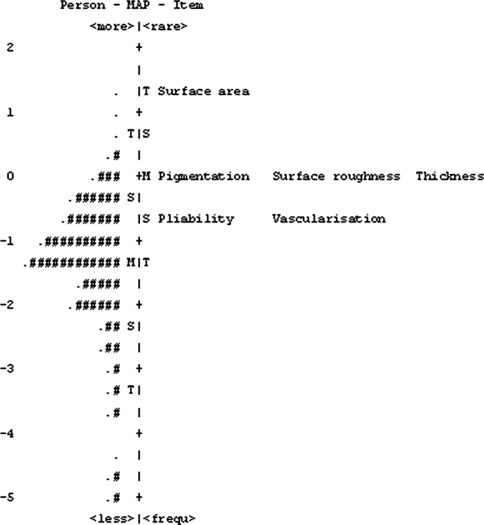
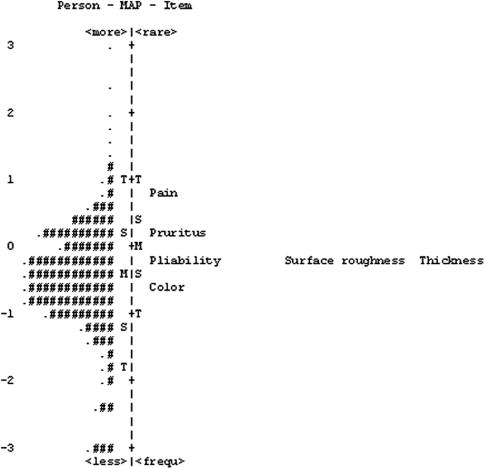
Figures 1 and 2 present the person–item maps. The items on the right side are located against the logit scale in the order of measurement. The default mean difficulty is set at zero. The Observer Scale map covers 11.4 logits (range −5.90; 5.51). In the Observer Scale, most persons are located at the middle of the map below the items. Mean scar quality Observer Scale measure is −1.47 (SD 1.22) logits, which is more than 1 logit below the average difficulty of the items (=local origin, which is set at 0). The Patient Scale map covers about 7.4 logits (range −3.43; 3.94). Mean scar quality Patient Scale measure is −0.52 (SD 0.89) logits, i.e., about 1/2 logit below the average difficulty of the items.
Fig. 1.
Person (n = 1,629) and item (6 items) or Wright map for the Observer Scale. Positive scores indicate poorer scar quality, whereas negative scores demonstrate better scar quality. Items from the scale are shown on the right-hand side of the figure, and person measures are highlighted by a ‘#’ or ‘.’ Each ‘#’ represents 24 subjects, and each ‘.’ represents 1–23. M mean, S 1 SD from the mean, T 2 SD from the mean
Fig. 2.
Person (n = 1,427) and item (6 items) or Wright map for the Patient Scale. Positive scores indicate poorer scar quality, whereas negative scores demonstrate better scar quality. Items from the scale are shown on the right-hand side of the figure, and person measures are highlighted by a ‘#’ or ‘.’ Each ‘#’ represents 13 subjects, and each ‘.’ represents 1–12. M mean, S 1 SD from the mean, T 2 SD from the mean
The item statistics table
Table 1 shows the items of the POSAS that are placed according to the hierarchy of the item difficulties. The measures are the item difficulty estimates. In the Observer Scale, the items thickness, surface roughness, and pigmentation have the values −0.05, −0.10, and −0.11 logits, respectively, which is nearly the same difficulty measure. The items vascularization and pliability have the values −0.56 and −0.58 logits, respectively, which is also nearly the same item difficulty measure. The inter-item separation of these items with the same difficulty and with surface area was larger than 0.15 logits, indicating no overlap between these items.
Table 1.
Item statistics Observer Scale
| Entry number-items | Count | Measure | Infit MNSQ | Outfit MNSQ |
|---|---|---|---|---|
| 6-Surface area | 424 | 1.39 | 2.02* | 1.94* |
| 4-Thickness | 1,628 | −.05 | 0.83 | 0.74 |
| 5-Surface roughness | 1,628 | −.10 | 1.01 | 0.92 |
| 2-Pigmentation | 1,622 | −.11 | 1.30 | 1.40 |
| 1-Vascularization | 1,628 | −.56 | 1.08 | 1.09 |
| 3-Pliability | 1,596 | −.58 | 0.69 | 0.68 |
MNSQ mean square
* Infit or outfit outside reasonable range of 0.5–1.7
All the items of the Observer Scale, except surface area, have mean square infit or outfit values between 0.5 and 1.7. Surface area has large infit and outfit values of 2.02 and 1.94, respectively, indicating underfit. In the Patient Scale (Table 2), the items thickness, surface roughness, and pliability have inter-item separation less than 0.15 logits, which indicates overlap between these three items. The inter-item separation of the other items was larger than 0.15 logits, indicating no overlap between these items. All the items of the Patient Scale have mean square infit or outfit values between 0.5 and 1.7.
Table 2.
Item statistics Patient Scale
| Entry number-items | Count | Measure | Infit MNSQ | Outfit MNSQ |
|---|---|---|---|---|
| 1-Pain | 1,417 | 0.88 | 1.55 | 1.40 |
| 2-Pruritus | 1,421 | 0.21 | 1.45 | 1.33 |
| 5-Thickness | 1,384 | −0.12 | 0.74 | 0.71 |
| 6-Surface roughness | 1,385 | −0.16 | 0.84 | 0.80 |
| 4-Pliability | 1,395 | −0.25 | 0.78 | 0.77 |
| 3-Color | 1,400 | −0.56 | 1.06 | 1.12 |
MNSQ mean square
* Infit or outfit reasonable range of 0.5–1.7
Reliability and separation statistics
Reliability analyses of the POSAS are shown in Table 3. The strata that the Observer and Patient Scale distinguish are 3.2 and 2.8, respectively, indicating that about three ranges in both scales can be confidentially differentiated. Removal of items such as thickness, surface roughness, and pigmentation or vascularization and pliability, which could be identified as redundant in the Wright table, lowered the person reliability.
Table 3.
Reliability of the POSAS
| O-SAS | P-SAS | |
|---|---|---|
| Person reliability | 0.82 | 0.77 |
| Person separation coefficient | 2.16 | 1.83 |
| Item reliability | 1.00 | 1.00 |
| Item separation coefficient | 19.57 | 26.96 |
Category function
Table 4 presents the functioning of the ten categories of the Observer Scale. All categories are well represented except for the tenth category, which has a low frequency of 14 observations. The observed average measures advance monotonically in a smooth distribution from −2.74 to 0.84. The threshold of the categories increases monotonically, with less than 1.4 logits. None of the categories show a misfit.
Table 4.
Summary of category structure of the Observer Scale
| Category label | Observed count | Observed count % | Observed average | Outfit MNSQ | Threshold |
|---|---|---|---|---|---|
| 1 | 1,220 | 14 | −2.74 | 1.01 | None |
| 2 | 1,900 | 22 | −1.66 | 0.96 | −2.77 |
| 3 | 1,852 | 22 | −1.16 | 1.00 | −1.36 |
| 4 | 1,421 | 17 | −0.78 | 1.05 | −0.68 |
| 5 | 814 | 10 | −0.43 | 0.93 | −0.07 |
| 6 | 600 | 7 | −0.19 | 0.96 | −0.04 |
| 7 | 386 | 5 | 0.01 | 1.08 | 0.35 |
| 8 | 191 | 2 | 0.26 | 1.14 | 0.86 |
| 9 | 66 | 1 | 0.44 | 1.22 | 1.47 |
| 10 | 14 | 0 | 0.84 | 0.98 | 2.24 |
Outfit reasonable range of 0.5–1.7
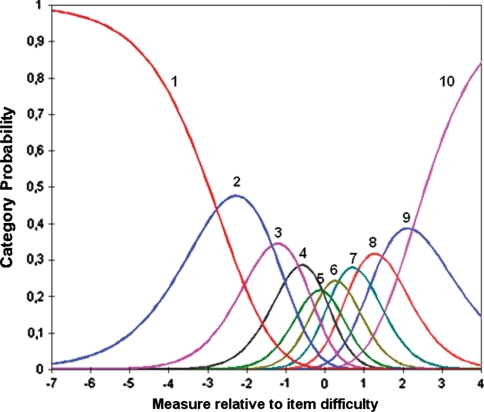
Figure 3 shows the category probability curves of the categories with a smooth distribution. Thresholds are ordered. Only the threshold between fifth and sixth category is unclear. In this Rasch-Andrich model (one of the polytomous models), the rating scale structure is defined to be equal for all items. The category rating scale is working well. In the partial credit Rasch-Masters model, the rating scale is specific for each item. An analysis of the items with this model showed ordered category probability curves except for the item surface area, which showed moderate disordered thresholds (analysis not shown).
Fig. 3.
Category probability curve of the Observer Scale showing the probability of assigning to any particular category (y-axis), given the difference in estimates between any patient scar quality and any item difficulty. The threshold estimates correspond to the intersection of rating scale categories
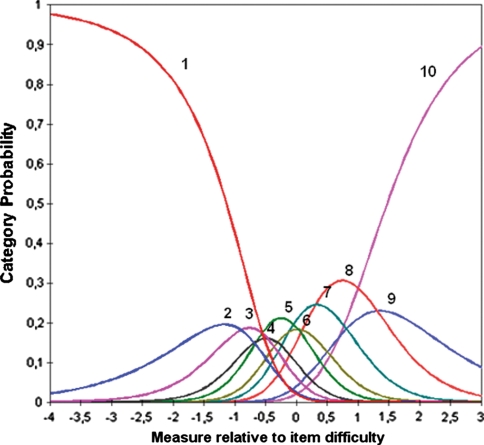
Table 5 presents the functioning of the ten categories of the Patient Scale. The observed average measures increase monotonically in a smooth distribution from 1.37 to 0.79. The threshold of the categories two, five, seven, and ten do not increase. None of the thresholds increase at least 1.4 logits. None of the categories shows misfit. Figure 4 shows the category probability curves of the Patient Scale. The categories two, three, four, six, and nine are non-modal or are never the most probable category on the latent variable, leading to disordered Rasch-Andrich thresholds.
Table 5.
Summary of category structure of the Patient Scale
| Category label | Observed count | Observed count % | Observed average | Outfit MNSQ | Threshold |
|---|---|---|---|---|---|
| 1 | 2,151 | 26 | −1.37 | 1.09 | None |
| 2 | 724 | 9 | −0.94 | 0.99 | −0.20 |
| 3 | 778 | 9 | −0.68 | 0.82 | −0.90 |
| 4 | 696 | 8 | −0.45 | 0.72 | −0.47 |
| 5 | 918 | 11 | −0.25 | 0.98 | −0.64 |
| 6 | 755 | 9 | −0.10 | 1.11 | 0.03 |
| 7 | 875 | 10 | 0.12 | 1.20 | −0.12 |
| 8 | 807 | 10 | 0.34 | 1.07 | 0.31 |
| 9 | 341 | 4 | 0.62 | 1.01 | 1.31 |
| 10 | 357 | 4 | 0.79 | 1.20 | 0.69 |
Outfit reasonable range of 0.5–1.7
Fig. 4.
Category probability curve of the Patient Scale with ten categories
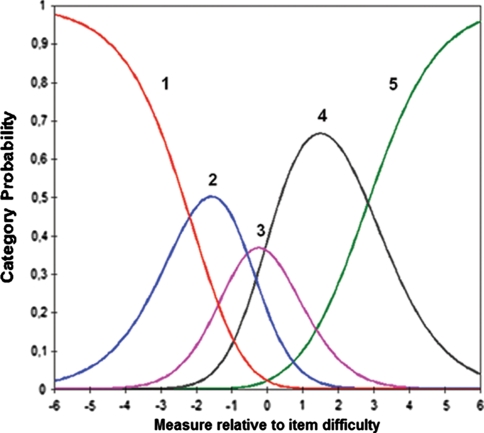
In Table 6 and Fig. 5, the category 1 remained 1; the categories 2, 3, and 4; 5 and 6; and 7, 8, and 9 were combined, and the category 10 was changed to category 5, creating five categories in total. The person reliability of the Patient Scale increased from 0.77 to 0.83 and the person separation coefficient from 1.83 to 2.19.
Table 6.
Summary of category structure of the refined Patient Scale with five categories
| Category label | Observed count | Observed count % | Observed average | Outfit MNSQ | Threshold |
|---|---|---|---|---|---|
| 1 | 2,643 | 27 | −2.78 | 1.06 | None |
| 2 | 2,574 | 26 | −1.39 | 0.87 | −2.19 |
| 3 | 1,878 | 19 | −0.39 | 0.99 | −0.57 |
| 4 | 2,218 | 23 | 0.62 | 1.04 | −0.07 |
| 5 | 409 | 4 | 1.60 | 1.19 | 2.83 |
Outfit reasonable range of 0.5–1.7
Fig. 5.
Category probability curve of the refined Patient Scale with five categories
Dimensionality investigation
The raw variance of the Observer Scale explained by Rasch measures is 56.8% (expected by model 56.7%). The unexplained variance in the first contrast is 12.5% (1.7 eigenvalue units). The raw variance of the Patient Scale explained by Rasch measures is 64.7% (expected by model 63.8%). The unexplained variance in the first contrast is 10.0% (1.7 eigenvalue units). This first contrast consists of pain and pruritus versus thickness, surface roughness and pliability.
Predictive validity
The Spearman correlation between the overall opinion of the observer on the scar and the Observer Scale Rasch measure was 0.75. The Spearman correlation between the overall opinion of the patient on the scar and the Patient Scale Rasch measure was 0.44.
Converting the logit scale to more meaningful units (user-friendly rescaling)
The range of the Rasch measures in logits was converted to the range of one to 100 (Tables 7 and 8). The formula for predicting the rescaled measure from the Observer Scale score is as follows: Measure = Score * 1.114 + 21.622. The formula for predicting the rescaled measure from the Patient Scale score with ten categories is as follows: Measure = Score * 1.052 + 18.212.
Table 7.
Observer Scale measures with the Rasch logits converted to a scale from 1 to 100
| Score | Measure | S.E. | Score | Measure | S.E. | Score | Measure | S.E. |
|---|---|---|---|---|---|---|---|---|
| 6 | 0 | 16.3 | 25 | 46.4 | 2.5 | 44 | 60.3 | 2.8 |
| 7 | 11.2 | 9.2 | 26 | 47.1 | 2.5 | 45 | 61.2 | 2.8 |
| 8 | 18.1 | 6.8 | 27 | 47.8 | 2.5 | 46 | 62.1 | 2.9 |
| 9 | 22.6 | 5.7 | 28 | 48.5 | 2.5 | 47 | 63.1 | 2.9 |
| 10 | 25.9 | 5.1 | 29 | 49.2 | 2.4 | 48 | 64.1 | 3.0 |
| 11 | 28.6 | 4.7 | 30 | 49.9 | 2.4 | 49 | 65.2 | 3.1 |
| 12 | 30.9 | 4.3 | 31 | 50.6 | 2.4 | 50 | 66.3 | 3.2 |
| 13 | 33.0 | 4.1 | 32 | 51.2 | 2.4 | 51 | 67.5 | 3.3 |
| 14 | 34.7 | 3.8 | 33 | 51.9 | 2.4 | 52 | 68.8 | 3.5 |
| 15 | 36.3 | 3.6 | 34 | 52.6 | 2.4 | 53 | 70.3 | 3.7 |
| 16 | 37.7 | 3.4 | 35 | 53.3 | 2.5 | 54 | 71.9 | 3.9 |
| 17 | 39.0 | 3.3 | 36 | 54.0 | 2.5 | 55 | 73.9 | 4.3 |
| 18 | 40.2 | 3.1 | 37 | 54.7 | 2.5 | 56 | 76.1 | 4.7 |
| 19 | 41.3 | 3.0 | 38 | 55.4 | 2.5 | 57 | 79.0 | 5.3 |
| 20 | 42.3 | 2.9 | 39 | 56.2 | 2.6 | 58 | 82.9 | 6.4 |
| 21 | 43.2 | 2.8 | 40 | 56.9 | 2.6 | 59 | 89.3 | 8.9 |
| 22 | 44.1 | 2.7 | 41 | 57.7 | 2.7 | 60 | 100.0 | 16.1 |
| 23 | 44.9 | 2.7 | 42 | 58.5 | 2.7 | |||
| 24 | 45.7 | 2.6 | 43 | 59.4 | 2.7 |
Table 8.
Patient Scale measures with the Rasch logits converted to a scale from 1 to 100
| Score | Measure | S.E. | Score | Measure | S.E. | Score | Measure | S.E. |
|---|---|---|---|---|---|---|---|---|
| 6 | .0 | 23.2 | 25 | 39.7 | 3.0 | 44 | 53.8 | 3.5 |
| 7 | 13.2 | 11.6 | 26 | 40.4 | 3.0 | 45 | 54.8 | 3.6 |
| 8 | 19.7 | 7.7 | 27 | 41.0 | 3.0 | 46 | 55.7 | 3.7 |
| 9 | 23.2 | 6.1 | 28 | 41.7 | 3.0 | 47 | 56.8 | 3.8 |
| 10 | 25.5 | 5.2 | 29 | 42.4 | 3.0 | 48 | 57.8 | 3.9 |
| 11 | 27.3 | 4.7 | 30 | 43.1 | 3.0 | 49 | 59.0 | 4.0 |
| 12 | 28.8 | 4.3 | 31 | 43.7 | 3.1 | 50 | 60.2 | 4.2 |
| 13 | 30.0 | 4.0 | 32 | 44.4 | 3.1 | 51 | 61.5 | 4.3 |
| 14 | 31.2 | 3.8 | 33 | 45.1 | 3.1 | 52 | 63.0 | 4.6 |
| 15 | 32.2 | 3.6 | 34 | 45.8 | 3.1 | 53 | 64.6 | 4.8 |
| 16 | 33.1 | 3.5 | 35 | 46.6 | 3.1 | 54 | 66.5 | 5.2 |
| 17 | 33.9 | 3.4 | 36 | 47.3 | 3.2 | 55 | 68.6 | 5.6 |
| 18 | 34.7 | 3.3 | 37 | 48.1 | 3.2 | 56 | 71.1 | 6.2 |
| 19 | 35.5 | 3.2 | 38 | 48.8 | 3.2 | 57 | 74.3 | 7.0 |
| 20 | 36.3 | 3.1 | 39 | 49.6 | 3.3 | 58 | 78.7 | 8.5 |
| 21 | 37.0 | 3.1 | 40 | 50.4 | 3.3 | 59 | 86.2 | 12.2 |
| 22 | 37.7 | 3.1 | 41 | 51.2 | 3.4 | 60 | 100.0 | 23.4 |
| 23 | 38.4 | 3.0 | 42 | 52.1 | 3.4 | |||
| 24 | 39.0 | 3.0 | 43 | 52.9 | 3.5 |
Discussion
Modern test theory analysis on a scar assessment scale is mandatory to improve the evidence base in scar treatment research. In general, the POSAS questionnaire performed adequately on burn scars, except for the item surface area, using the thorough and stringent Rasch analysis. The person reliability of the Observer Scale is just above 0.8 and of the Patient Scale nearly 0.8, which is the lower limit of reliability required for serious decision making. This can be explained by the limited range in scar quality in our sample. The item reliability for this sample of patients is very good despite the small number of items. Three statistically distinct levels of scar quality can be differentiated by both scales, for instance good, intermediate, and bad scars.
The items of the POSAS and other scar assessment scales are intended to measure a single variable (often referred to as a unidimensional variable) being ‘scar quality’. No substantial dimension could be identified by factor Rasch analysis, and therefore, the Observer and Patient Scales are suitable unidimensional questionnaires for the evaluation of burn scars. However, the dimensionality investigation of the Patient Scale did show an interesting structure (data not shown): the items pain and pruritus and the items thickness, surface roughness, and pliability can be interpreted as subdimensions in scar evaluation. The items pain and pruritus are typical neurological sensations of a scar, and thickness, surface roughness, and pliability can be considered as tactile characteristics.
The items in the Wright map of the Patient Scale show that the items pain and pruritus have a high item difficulty without overlap, meaning that the patients assess pain and pruritus as the most severe symptoms in relation to their scar. Both the item maps of the Observer and Patient Scale show some overlap of the item difficulties. Theoretically, overlapping items should be reduced, and new items should be included that may fill up the holes in the map, resulting in a more even spread of item locations. However, the selection of items has to be considered from a clinical viewpoint: from that perspective, all items appear to be relevant as they relate to the complaints and problems of patients that dictate possible interventions. Moreover, most other scar assessment scales include comparable sets of items.
Tables 4 and 5 show that the category frequencies are highly skewed to the lower end. The distribution of patient measures in the Figs. 1 and 2, however, is not skewed, probably because the lower categories of the items are uniformly used.
The most remarkable finding, from a clinical perspective, was the functioning of the item surface area in the Observer Scale. The measures of all the items of the Observer Scale fit to the Rasch model, except for this item. Many scars tend to contract, leading to a significant reduction in the surface area, which is one of the most mutilating and disturbing problems for burn patients. Surface area was implemented in the POSAS in the second version by our group because of its clinical relevance [10]. Linear regression of this item on linear scars revealed that surface area significantly influenced the general opinion of the observer. Apparently, the surface area remains difficult to assess because the scar changes over time and the original surface area can only be estimated for burn scars. For linear scars, the situation is different because usually a linear scar is a thin line immediately post-surgery. These scars may tend to broaden, which can easily be recognized. These findings suggest ‘differential item functioning’ (DIF) of the item surface area on different scar types, which could not be studied in this sample.
The Patient Scale fit statistics revealed an adequate fit for clinical observations although the items pain and pruritus did show high infit and outfit mean values, indicating that the response on these items is often erratically or is difficult to predict by the model.
The category rating scale of the Observer Scale is working well. The clinicians can discriminate the 10 levels, although the fifth category is masked by categories 4 and 6 in the category probability curves. Partial credit analyses of the item surface area showed moderate disordered category probability curves. The categories of the Patient Scale are less ordered, indicating that the patients are not able to discriminate the current 10 levels in the scale. After reducing the number of categories, ordering of the categories was restored. The use of five categories for the Patient Scale should be studied in further scar research before definitely moving away from the use of ten categories.
Predictive validity could be confirmed for the Observer Scale by a good correlation between the clinicians input and the overall opinion on the scar. For the Patient Scale however, the correlation was only moderate. We believe that this can be explained by the validity of the overall opinion on the scar by the patient. In our experience, responses on general questions are depended on the patient’s current status and influenced by other aspects such as emotions, functional impairment, or quality of life.
No other study has analyzed the POSAS using the Rasch model. Nevertheless, Lindeboom et al. studied photographs of linear scars using a modified Observer Scale, which related the category scoring to clinical descriptions of the scars [33]. For instance, the item pigmentation showed increasing category scoring with the lowest score for normal skin, followed by hypopigmentation and ending with hyperpigmentation. This implicates that hypopigmentation is less severe than hyperpigmentation. The outcome and fit of this item will be highly dependent on the ratio of darker-skinned people to Caucasians within the sample. The item pliability was excluded for further analysis because of a low reliability between the four raters. As mentioned by these authors, pliability could not be assessed adequately from photographs. They showed an overall misfit of the data to the measurement model and suggested revision of the item categories and weighting the items. However, in our large data set obtained from clinical observations, we found no disordered categories in the original Observer Scale, except for the item surface area. Our clinicians could discriminate all ten levels, and the category scale was working well. Therefore, we feel that it is premature to advise to change the Observer Scale because of a relatively small study which analyzed photographs of relatively small linear scars.
In conclusion, this study revealed several valuable insights into the psychometric properties of the POSAS. We confirmed that the scale is reliable and found that it provides a unidimensional measure for scar quality. For burn scars, all items, except surface area, showed a good fit to the stringent Rasch model. We feel that the functioning of this item is highly dependent on the type of scar being assessed. Therefore, the presence of differential item functioning should be investigated in another sample of POSAS scores obtained from different scar types. Research should also focus on category functioning of the Patient Scale. Small adjustments of the POSAS may be considered in the future only when extensive analysis has revealed that it will lead to superior clinimetrical properties of this scale.
Acknowledgments
The authors would like to thank Prof. R. W. de Haan for his insightful comments on the analyses and Dr. L. L. Damkat-Thomas for her critical review on this manuscript.
Open Access
This article is distributed under the terms of the Creative Commons Attribution Noncommercial License which permits any noncommercial use, distribution, and reproduction in any medium, provided the original author(s) and source are credited.
Abbreviations
- POSAS
Patient and Observer Scar Assessment Scale
- VSS
Vancouver Scar Scale
- MNSQ
Mean Square
Appendix
The Patient and Observer Scar Assessment Scale (EnV2.010). 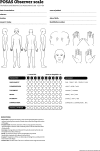
References
- 1.Van Loey NE, Van Son MJ. Psychopathology and psychological problems in patients with burn scars: Epidemiology and management. American Journal of Clinical Dermatology. 2003;4:245–272. doi: 10.2165/00128071-200304040-00004. [DOI] [PubMed] [Google Scholar]
- 2.Falder S, Browne A, Edgar D, et al. Core outcomes for adult burn survivors: A clinical overview. Burns. 2009;35:618–641. doi: 10.1016/j.burns.2008.09.002. [DOI] [PubMed] [Google Scholar]
- 3.van Baar ME, Essink-Bot ML, Oen IM, Dokter J, Boxma H, van Beeck EF. Functional outcome after burns: A review. Burns. 2006;32:1–9. doi: 10.1016/j.burns.2005.08.007. [DOI] [PubMed] [Google Scholar]
- 4.van Zuijlen PP, Angeles AP, Kreis RW, Bos KE, Middelkoop E. Scar assessment tools: Implications for current research. Plastic and Reconstructive Surgery. 2002;109:1108–1122. doi: 10.1097/00006534-200203000-00052. [DOI] [PubMed] [Google Scholar]
- 5.Brusselaers, N., Pirayesh, A., Hoeksema, H., Verbelen, J., Blot, S., & Monstrey, S. (2010). Burn scar assessment: A systematic review of objective scar assessment tools. Burns, 36, 1157–1164. [DOI] [PubMed]
- 6.Nguyen DQ, Potokar T, Price P. A review of current objective and subjective scar assessment tools. Journal of Wound Care. 2008;17(101–102):104–106. doi: 10.12968/jowc.2008.17.3.28666. [DOI] [PubMed] [Google Scholar]
- 7.Idriss N, Maibach HI. Scar assessment scales: A dermatologic overview. Skin Research Technology. 2009;15:1–5. doi: 10.1111/j.1600-0846.2008.00327.x. [DOI] [PubMed] [Google Scholar]
- 8.Durani P, McGrouther DA, Ferguson MW. Current scales for assessing human scarring: A review. Journal of Plastic, Reconstructive & Aesthetic Surgery. 2009;62:713–720. doi: 10.1016/j.bjps.2009.01.080. [DOI] [PubMed] [Google Scholar]
- 9.Draaijers, L. J., Tempelman, F. R., Botman, Y. A, et al. (2004). The patient and observer scar assessment scale: A reliable and feasible tool for scar evaluation. Plast Reconstr Surg, 113, 1960–1965 (discussion 1966–1967). [DOI] [PubMed]
- 10.van de Kar AL, Corion LU, Smeulders MJ, Draaijers LJ, van der Horst CM, van Zuijlen PP. Reliable and feasible evaluation of linear scars by the patient and observer scar assessment scale. Journal of Plastic, Reconstructive & Aesthetic Surgery. 2005;116:514–522. doi: 10.1097/01.prs.0000172982.43599.d6. [DOI] [PubMed] [Google Scholar]
- 11.Truong PT, Lee JC, Soer B, Gaul CA, Olivotto IA. Reliability and validity testing of the patient and Observer Scar Assessment Scale in evaluating linear scars after breast cancer surgery. Plastic and Reconstructive Surgery. 2007;119:487–494. doi: 10.1097/01.prs.0000252949.77525.bc. [DOI] [PubMed] [Google Scholar]
- 12.O’Connell, D. A., Diamond, C., Seikaly, H., & Harris, J. R. (2008). Objective and subjective scar aesthetics in minimal access vs conventional access parathyroidectomy and thyroidectomy surgical procedures: A paired cohort study. Archives of otolaryngology–head & neck surgery, 134, 85–93. [DOI] [PubMed]
- 13.Sardesai MG, Moore CC. Quantitative and qualitative dermal change with microfat grafting of facial scars. Otolaryngology Head and Neck Surgery. 2007;137:868–872. doi: 10.1016/j.otohns.2007.08.008. [DOI] [PubMed] [Google Scholar]
- 14.Zaal LH, van der Horst CM. Results of the early use of tissue expansion for giant congenital melanocytic naevi on the scalp and face. Journal of Plastic, Reconstructive & Aesthetic Surgery. 2009;62:216–220. doi: 10.1016/j.bjps.2007.10.045. [DOI] [PubMed] [Google Scholar]
- 15.Cromi, A., Ghezzi, F., Gottardi, A., Cherubino, M., Uccella, S., & Valdatta, L. (2010). Cosmetic outcomes of various skin closure methods following cesarean delivery: A randomized trial. American Journal of Obstetrics and Gynecology, 203, 36 e31–36 e38. [DOI] [PubMed]
- 16.Kaartinen, I. S., Valisuo, P. O., Alander, J. T., & Kuokkanen, H. O. (2010). Objective scar assessment-A new method using standardized digital imaging and spectral modelling. Burns. [DOI] [PubMed]
- 17.Bianchi FA, Roccia F, Fiorini P, Berrone S. Use of patient and Observer Scar Assessment Scale for evaluation of facial scars treated with self-drying silicone gel. The Journal of Craniofacial Surgery. 2010;21:719–723. doi: 10.1097/SCS.0b013e3181d841af. [DOI] [PubMed] [Google Scholar]
- 18.Aust MC, Fernandes D, Kolokythas P, Kaplan HM, Vogt PM. Percutaneous collagen induction therapy: An alternative treatment for scars, wrinkles, and skin laxity. Plastic and Reconstructive Surgery. 2008;121:1421–1429. doi: 10.1097/01.prs.0000304612.72899.02. [DOI] [PubMed] [Google Scholar]
- 19.van der Wal MB, van Zuijlen PP, van de Ven P, Middelkoop E. Topical silicone gel versus placebo in promoting the maturation of burn scars: A randomized controlled trial. Plastic and Reconstructive Surgery. 2010;126:524–531. doi: 10.1097/PRS.0b013e3181e09559. [DOI] [PubMed] [Google Scholar]
- 20.Roques C, Teot L. A critical analysis of measurements used to assess and manage scars. The International Journal of Lower Extremity Wounds. 2007;6:249–253. doi: 10.1177/1534734607308249. [DOI] [PubMed] [Google Scholar]
- 21.Franchignoni F, Giordano A, Ferriero G. Rasch analysis of the short form 8-item Parkinson’s Disease Questionnaire (PDQ-8) Quality of Life Research. 2008;17:541–548. doi: 10.1007/s11136-008-9341-6. [DOI] [PubMed] [Google Scholar]
- 22.Hawthorne G, Densley K, Pallant JF, Mortimer D, Segal L. Deriving utility scores from the SF-36 health instrument using Rasch analysis. Quality of Life Research. 2008;17:1183–1193. doi: 10.1007/s11136-008-9395-5. [DOI] [PubMed] [Google Scholar]
- 23.Davidson M. Rasch analysis of 24-, 18- and 11-item versions of the Roland-Morris Disability Questionnaire. Quality of Life Research. 2009;18:473–481. doi: 10.1007/s11136-009-9456-4. [DOI] [PubMed] [Google Scholar]
- 24.Ramp M, Khan F, Misajon RA, Pallant JF. Rasch analysis of the multiple sclerosis impact scale MSIS-29. Health and Quality of Life Outcomes. 2009;7:58. doi: 10.1186/1477-7525-7-58. [DOI] [PMC free article] [PubMed] [Google Scholar]
- 25.Young TA, Rowen D, Norquist J, Brazier JE. Developing preference-based health measures: Using Rasch analysis to generate health state values. Quality of Life Research. 2010;19:907–917. doi: 10.1007/s11136-010-9646-0. [DOI] [PubMed] [Google Scholar]
- 26.Tang K, Beaton DE, Lacaille D, et al. The work instability scale for rheumatoid arthritis (RA-WIS): Does it work in osteoarthritis? Quality of Life Research. 2010;19:1057–1068. doi: 10.1007/s11136-010-9656-y. [DOI] [PubMed] [Google Scholar]
- 27.Rasch G. Probalistic models for some inteligence and attainment tests. Chicago: The University of Chicago, Expanded Edition; 1960. [Google Scholar]
- 28.Linacre JM, Wright BD. A User’s Guide to WINSTEPS: Rasch model computer program. Chicago, Il: MESA Press; 2000. [Google Scholar]
- 29.Wright, B. D., & Linacre, J. M. (1994). Reasonable mean-square fit values. Rasch Measurement Transactions. p. 370. http://www.rasch.org/rmt/rmt83b.htm.
- 30.Fisher Jr, W. P. (1992). Reliability statistics. Rasch Measurement Transactions. p. 238. http://www.rasch.org/rmt/rmt63i.htm.
- 31.Wright, B. D., Masters, G. (2002). Number of person or item strata. Rasch Measurement Transactions. p. 888. http://www.rasch.org/rmt/rmt163f.htm.
- 32.Linacre JM. Investigating rating scale category utility. Journal of Outcome Measurement. 1999;3:103–122. [PubMed] [Google Scholar]
- 33.Lindeboom JA, Bruijnesteijn van Coppenraet ES, Kuijper EJ, et al. Interpretation and precision of the Observer Scar Assessment Scale improved by a revised scoring. Journal of Clinical Epidemiology. 2008;61:1289–1295. doi: 10.1016/j.jclinepi.2008.04.001. [DOI] [PubMed] [Google Scholar]


