Abstract
One of the major obstacles of immunosuppressive therapy (IST) in children with severe aplastic anemia (SAA) comes from the often months-long unpredictability of bone-marrow (BM) recovery. In this prospective study in children with newly diagnosed very severe AA (n=10), who were enrolled in the therapy study SAA-BFM 94, we found a dramatically reduced diversity of both CD4+ and CD8+ BM cells, as scored by comprehensive V-beta chain T-cell receptor (TCR) analysis. Strongly skewed TCR V-beta pattern was highly predictive for good or at least partial treatment response (n=6, CD8+ complexity scoring median 35.5, range 24–73). In contrast, IST in patients with rather moderate reduction of TCR V-beta diversity (n=4, CD8+ complexity scoring median 109.5, range 82–124) always failed (P=0.0095). If confirmed in a larger series of patients, TCR V-beta repertoire in BM may help to assign children with SAA up-front either to IST or to allogeneic stem-cell transplantation.
Keywords: aplastic anemia, T-cell receptor V-beta chain repertoire, children
Introduction
The assumption that severe aplastic anemia (SAA) clinically presenting with severe pancytopenia and extreme bone-marrow (BM) hypocellularity can be treated successfully by profound immunosuppression dates back to 1970, when a striking observation was made: Patients who were ‘myeloablatively' conditioned by high-dose chemotherapy for intended allogeneic BM transplantation but inadvertently rejected the graft and reconstituted with their own marrow subsequently remained free of disease.1
Today, there is overwhelming evidence that a pathological autoimmune response mediated by oligoclonally expanded populations of autologous T cells causes a significant decrease in the number of hematopoietic stem and progenitor cells.2, 3, 4
Fortunately, anti-T-cell treatment with cyclosporine A, prednisolone and antithymocyte globulin leads to hematological recovery in the majority of patients.
Nevertheless, 20–30% of SAA patients do not respond to these drugs, which becomes apparent after a long latency of approximately 6 months following onset of therapy. The long duration before recovery of marrow function is closely related to the risk of severe complications and thus worsens the overall outcome in this group of patients. This latency period also prevents early stratification for BM transplantation in those patients without matched sibling donor and who will subsequently fail.5 Thus, early clinical decision-making pro- or contra-allogeneic stem-cell transplantation in patients with SAA remains a challenge.
We previously showed that children with very severe AA (vSAA; all nucleated cells (ANC) <0.2 × 10⁹/l at diagnosis) show a higher rate of complete response to immunosuppressive therapy (IST) and better survival than children with ‘only' severe AA (ANC >0.2 × 10⁹/l at diagnosis).6 Although counterintuitive at first view, a more severe form responds better to therapy.
However, this simple clinical approach does not help to identify IST failures among the group of children with vSAA, which is the most predominant subset. On the basis of our clinical observation, we hypothesized that the strength of the autoimmune attack is reflected in the degree of globally restricted T-cell receptor (TCR) repertoire. BM and peripheral blood (PB) CD4+ and CD8+ T cells were therefore selectively analyzed by spectratyping (using the immunoscope technique) at diagnosis, which gives insights into the overall T-cell diversity by determining the TCR CDR3 length polymorphisms. For control purposes, we included children with refractory cytopenia (RC, n=8) and healthy age-matched control BM (n=4).
Patients and methods
Patients and controls
Pediatric vSAA patients (n=10) were diagnosed according to the criteria of the German SAA 1994 study group6 and Fanconi anemia was excluded by chromosomal fragility test. For comparison between vSAA and myelodysplastic syndrome, we also assayed children with RC (n=8) according to the EWOG MDS-98 criteria.7
Cytological evaluation and histology of BM biopsies were centrally reviewed in all cases. Informed consent prior to sampling was obtained and spectratyping was done prospectively. All children were enrolled in the multicenter BFM-SAA 94 therapy study. Treatment consisted of antithymocyte globulin (horse, 0.75 ml/kg body weight (BW)) for 8 days, CsA (5 mg/kg BW, adjusted to blood levels), prednisolone (1–2 mg/kg BW, tapered until day 28) and granulocyte-colony-stimulating factor (5 μg/kg BW).
After 6 months of therapy, vSAA patients were assigned either to the group ‘IST responder' (further subdivided into complete responder (CR): ANC >1.5 × 10⁹/l, hemoglobin according to the age-adjusted cut-off, platelets >150 × 109/l; and ‘partial responder' (PR): ANC >0.5 × 10⁹/l, independent of red-cell transfusions, platelets >20 × 109/l) or to the group ‘non-responder' (NR, neither CR nor PR).
The control group consisted of age-matched healthy children donating BM for their siblings (n=4).
Sample preparation and spectratype analysis
Mononuclear cells from BM and PB taken at diagnosis were separated by Ficoll density centrifugation. CD4+ and CD8+ lymphocytes were positively selected by using Dynabeads (Dynal, Oslo, Norway). Total RNA of 100 000 lymphocytes was extracted and complementary DNA synthesis was performed by standard procedures. For spectratyping, 26 TCR V-beta-specific forward primers and a TCR C-beta reverse primer were combined to amplify all V-beta TCR families individually. Primer sequences are provided in Supplementary Table 1. Subsequent run-off reactions with fluorescence-labelled J beta primers and analyses of resulting PCR products on a ABI 377 DNA sequencer (Applied Biosystems, Darmstadt, Germany) were done exactly as described previously.8
V-beta TCR complexity scoring
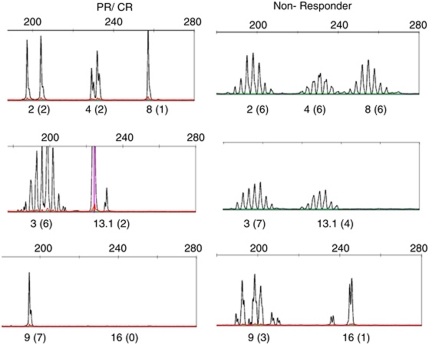
The complexity of single V-beta CDR3 was determined by counting the number of distinct peaks and graded on a score of 0–8.9 A score of 8 describes a normal CDR3 size variability of 8–10 peaks with a Gaussian distribution, a score of 1 was given to profiles showing single peaks, 0 was given in case of absence of peaks. The overall TCR complexity (complexity score) was determined by summing up all 26 individual TCR V-beta family-specific single scores (with a maximum of 26 × 8=208). Scoring was done blindly without any prior knowledge regarding which group the patient belongs to. For a representative example, see Figure 1.
Figure 1.
Illustrative example of selected TCR V-beta CDR3 spectratypes in a patient with partial response (PR)/complete response (CR) (left) and in a patient with non-response (right). The number represents the specific V-beta chain family, followed by the complexity score in parentheses. The inter-observer variability in spectratype complexity scoring was less than 5%, as determined by a blinded review of three individual cases by three different investigators.
Statistics
The distributions of scores among patients were compared using Mann–Whitney's U-test. The distributions of scores within patients (BM versus PB) were compared using two-sided Wilcoxon's test (paired samples).
Results
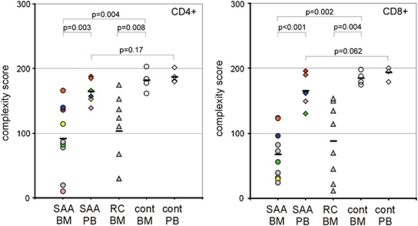
BM samples of 10 children with vSAA were examined at diagnosis. In six of them (three CR/PR, three NR) cells from the PB also could be analyzed. At first, we compared the complexity scores in BM and PB of CD4+ and CD8+ cells (Figure 2). V-beta chain complexities of BM (CD4+ cells: median 86, range: 10–166 and CD8+ cells: median 64, range 24–188) were significantly lower than those of PB (CD4+ cells: median 106, range 96–166; CD8+ cells: median 162, range 130–196; CD4+ cells: P=0.003; CD8+ cells: P<0.001).
Figure 2.
Comparison of T-cell complexity scores in CD4+ and CD8+ T cells between peripheral blood (PB) and bone marrow (BM). Each colored sign represents the overall score of a single patient. cont, healthy, age-matched controls; RC, refractory cytopenia; SAA, severe aplastic anemia.
A significant skewness in vSAA patients was observed compared with healthy controls in BM (healthy: CD4+ cells: median 181, range 162–203; CD8+ cells: median 184, range 175–198; CD4+ cells: P=0.004, CD8+ cells: P=0.002) but not in PB (healthy: CD4+ cells: median 184, range 180–202; CD8+ cells: median 198, range 179–200; CD4+ cells: P=0.17, CD8+ cells: P=0.062).
In contrast, analysis of the complexity score in the BM between patients suffering from SAA and those suffering from RC showed no significant difference between these two entities (RC: CD4+ cells: median 118, range 30–175; CD8+ cells: median 92, range 12–150; CD4+ cells: P=0.62, CD8+ cells: P=0.57).
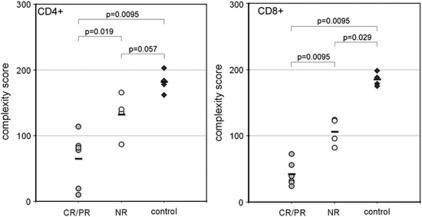
Next, we compared T-cell V-beta diversities of CD4+ and CD8+ populations isolated from the BM of patients with CR/PR (n=6) or NR (n=4). Notably, the grade of skewing in the BM of SAA patients was highly associated with the subsequent response to immunosuppressive treatment. NR had scoring points from 82 up to 166 (CD4+ cells: median 138, range 87–166; CD8+ cells: median 109, range 82–124), much higher than the CR/PR group (CD4+ cells: median 80, range 10–114; CD8+ cells median 35.5, range 24–73; CD4+ cells: P=0.019, CD8+ cells: P=0.0095; Figure 3).
Figure 3.
TCR V-beta chain diversities from bone-marrow lymphocytes according to the therapy response (response criteria as defined in the therapy study SAA-BFM 94). CR, complete remission; NR, non-responder; PR, partial remission.
Discussion
The extremely low amount of residual cells at diagnosis of vSAA complicates comprehensive molecular testing in both adults and children. Nevertheless, current research has revealed new aspects in the pathophysiology of SAA: (a) telomere length correlates with the rate of relapse, clonal evolution and overall survival10 and (b) increased Th17 cell number contributes to the pathophysiology of SAA.11 Nevertheless, there is still no valid biomarker that really predicts the response to IST and could therefore be used for justification of early donor search in patients who lack a matched sibling donor.
At first, we asked whether the complexity score between T-cells isolated from the BM differed from those isolated from PB.
V-beta chain complexities of BM CD4+ and CD8+ cells were significantly lower than those of PB (Figure 2, CD4+: P=0.003, CD8+: P⩽0.001). Thus, skewing was evident in both CD4+ and CD8+ BM cells but not in CD4+ and CD8+ cells isolated from PB in comparison with healthy controls. These results indicate that the autoimmune process with antigen-induced T-cell proliferation occurs predominantly in the BM, where the assumed target hematopoietic progenitor cells reside. In practical terms, PB cannot be used instead of BM to perform TCR V-beta complexity analysis. Skewed TCR repertoires were previously observed in CD4+ and CD8+ cell fractions of individual SAA patients in BM,12 PB,13 or by high-resolution analysis.14
There was no skewing and no difference between BM and PB when CD4+ and CD8+ cells from healthy children (n=4) were tested. The overall complexity in the healthy children was remarkably stable, with scores ranging from 162 to 202 (Figure 2, Supplementary Table 2). We also did not observe a difference in the BM TCR V-beta chain complexity between the vSAA and RC groups (n=8), neither in CD4+ nor in CD8+ cells (CD4+: P=0.62, CD8+: P=0.57). The fact that RC and vSAA patients did not significantly differ in their scoring points argues for akin pathophysiology. Along this line, IST may lead to full BM recovery in RC and SAA.
As expected, there was no difference between CR/PR and NR when only PB was analyzed (Supplementary Table 2).
Altogether, when the CD8+ compartment is considered, a cut-off complexity score of 130 separated both responders and non-responders from healthy controls and a score of 80 distinguished the CR/PR group from the NR group without any overlap between the patient groups. Besides the CD8+ cut-off values of 130 and 80, respectively, there was no relation between score, disease presentation and responsiveness. An additional drawback of our study comes from the fact that the current methodology of CDR3 polymorphism analysis is extremely laborious and time-consuming. Analyses of all-encompassing 26 TCR V-beta chain families with all 13 J-beta segments in the CD4+ and CD8+ subsets require 676 individual PCR reactions in each individual patient. Thus, we currently work on easier protocols based on 454-sequencing of PCR products that were amplified with degenerative, wobbled TCR V-beta primers. Once developed, such less-time-consuming methodology to determine TCR complexity may have the potential to become a tool for early treatment stratification in children with SAA, if confirmed by other study groups.
Acknowledgments
We thank Dr Irith Baumann for the central review of histological slides, Prof Dr Charlotte Niemeyer and her co-workers within the EWOG-MDS framework for their continuous support of the SAA study group. We are also thankful to Prof Dr Jochen Harbott and Prof Dr Brigitte Schlegelberger, who performed the central cytogenetic analysis. This work was supported by Else-Kröner Fresenius Stiftung, the European Community FP-6 grant to AB, the Elterninitiative Kinderkrebsklinik Düsseldorf e.V. and the Elterninitative Intern 3 München e.V. KD was supported by the Deutsche Forschungsgemeinschaft (SFB-571-A1).
The authors declare no conflict of interest.
Footnotes
Supplementary Information accompanies the paper on Blood Cancer Journal website (http://www.nature.com/bcj)
Supplementary Material
References
- Mathe G, Amiel JL, Schwarzenberg L, Choay J, Trolard P, Schneider M, et al. Bone marrow graft in man after conditioning by antilymphocytic serum. Br Med J. 1970;2:131–136. doi: 10.1136/bmj.2.5702.131. [DOI] [PMC free article] [PubMed] [Google Scholar]
- Young NS, Maciejewski J. The pathophysiology of acquired aplastic anemia. N Engl J Med. 1997;336:1365–1372. doi: 10.1056/NEJM199705083361906. [DOI] [PubMed] [Google Scholar]
- Young NS. Introduction: acquired aplastic anemia. Semin Hematol. 2000;37:2. doi: 10.1016/s0037-1963(00)90025-8. [DOI] [PubMed] [Google Scholar]
- Melenhorst JJ, van Krieken JH, Dreef E, Landegent JE, Willemze R, Fibbe WE. T cells selectively infiltrate bone marrow areas with residual haemopoiesis of patients with acquired aplastic anaemia. Br J Haematol. 1997;99:517–519. doi: 10.1046/j.1365-2141.1997.4353245.x. [DOI] [PubMed] [Google Scholar]
- Bacigalupo A, Socie G, Lanino E, Prete A, Locatelli F, Locasciulli A, et al. Fludarabine, cyclophosphamide, antithymocyte globulin, with or without low dose total body irradiation, for alternative donor transplants, in acquired severe aplastic anemia: a retrospective study from the EBMT-SAA working party. Haematologica. 2010;95:976–982. doi: 10.3324/haematol.2009.018267. [DOI] [PMC free article] [PubMed] [Google Scholar]
- Fuhrer M, Rampf U, Baumann I, Faldum A, Niemeyer C, Janka-Schaub G, et al. Immunosuppressive therapy for aplastic anemia in children: a more severe disease predicts better survival. Blood. 2005;106:2102–2104. doi: 10.1182/blood-2005-03-0874. [DOI] [PubMed] [Google Scholar]
- Hasle H, Baumann I, Bergstrasser E, Fenu S, Fischer A, Kardos G, et al. The International Prognostic Scoring System (IPSS) for childhood myelodysplastic syndrome (MDS) and juvenile myelomonocytic leukemia (JMML) Leukemia. 2004;18:2008–2014. doi: 10.1038/sj.leu.2403489. [DOI] [PubMed] [Google Scholar]
- Seitz S, Schneider CK, Malotka J, Nong X, Engel AG, Wekerle H, et al. Reconstitution of paired T cell receptor alpha- and beta-chains from microdissected single cells of human inflammatory tissues. Proc Natl Acad Sci USA. 2006;103:12057–12062. doi: 10.1073/pnas.0604247103. [DOI] [PMC free article] [PubMed] [Google Scholar]
- Wu CJ, Chillemi A, Alyea EP, Orsini E, Neuberg D, Soiffer RJ, et al. Reconstitution of T-cell receptor repertoire diversity following T-cell depleted allogeneic bone marrow transplantation is related to hematopoietic chimerism. Blood. 2000;95:352–359. [PubMed] [Google Scholar]
- Scheinberg P, Cooper JN, Sloand EM, Wu CO, Calado RT, Young NS. Association of telomere length of peripheral blood leukocytes with hematopoietic relapse, malignant transformation, and survival in severe aplastic anemia. JAMA. 2010;304:1358–1364. doi: 10.1001/jama.2010.1376. [DOI] [PMC free article] [PubMed] [Google Scholar]
- Peffault de Latour R, Visconte V, Takaku T, Wu C, Erie AJ, Sarcon AK, et al. Th17 immune responses contribute to the pathophysiology of aplastic anemia. Blood. 2010;116:4175–4184. doi: 10.1182/blood-2010-01-266098. [DOI] [PMC free article] [PubMed] [Google Scholar]
- Zeng W, Maciejewski JP, Chen G, Young NS. Limited heterogeneity of T cell receptor BV usage in aplastic anemia. J Clin Invest. 2001;108:765–773. doi: 10.1172/JCI12687. [DOI] [PMC free article] [PubMed] [Google Scholar]
- Risitano AM, Maciejewski JP, Green S, Plasilova M, Zeng W, Young NS. In-vivo dominant immune responses in aplastic anaemia: molecular tracking of putatively pathogenetic T-cell clones by TCR beta-CDR3 sequencing. Lancet. 2004;364:355–364. doi: 10.1016/S0140-6736(04)16724-X. [DOI] [PubMed] [Google Scholar]
- Kook H, Risitano AM, Zeng W, Wlodarski M, Lottemann C, Nakamura R, et al. Changes in T-cell receptor VB repertoire in aplastic anemia: effects of different immunosuppressive regimens. Blood. 2002;99:3668–3675. doi: 10.1182/blood.v99.10.3668. [DOI] [PubMed] [Google Scholar]
Associated Data
This section collects any data citations, data availability statements, or supplementary materials included in this article.


