Abstract
Summary
Background and objectives
Reporting of standardized patient and graft survival rates by the Scientific Registry of Transplant Recipients (SRTR) aims to influence transplant centers to improve their performance. The methodology currently used is based on calculating observed-to-expected (OE) ratios for every center. Its accuracy has not been evaluated. Here, we compare the accuracy of standardized rates across centers with the OE method to an alternative generalized mixed-effect (ME) method. We also examine the association between public reporting and center outcome improvement.
Design, setting, participants, & measurements
Accuracy was measured as the root mean square error (RMSE) of the difference between standardized rates from one time period to standardized rates from a future time period. Data from the United States Renal Data System on all kidney transplants between January 1, 1996, and September 30, 2009 were analyzed.
Results
The ME method had a 0.5 to 4.5% smaller RMSE than the OE method. It also had a smaller range between the 5th and 95th percentile centers' standardized rates: 7.5% versus 10.5% for 3-year graft survival and 4.7% versus 7.9% for 3-year patient survival. The range did not change after the introduction of public reporting in 2001. In addition, 33% of all deaths and 29% of all graft failures in the 3 years after transplant could be attributed to differences across centers.
Conclusions
The ME method can improve the accuracy of public reports on center outcomes. An examination of the reasons why public reports have not reduced differences across centers is necessary.
Introduction
Public reports of transplant center outcomes provided by the Scientific Registry of Transplant Recipients (SRTR) (1) can serve multiple audiences (2): (1) public and private payers may use them to determine which transplant centers to include in their provider networks; (2) patients and physicians can refer to them to choose centers with the best outcomes; and (3) finally, transplant centers can use them to determine corrective actions to improve their outcomes. If the information provided in these reports is perceived reliable, all stakeholders have an incentive to use them, resulting in center improvements. However, the accuracy of the information in these reports and whether this accuracy can improve have not yet been studied. In this paper, we compared the accuracy of two methods that can be used in public reporting of transplant center outcomes: the current SRTR method on the basis of observed-to-expected ratios (OE method) (1), and an alternative method on the basis of generalized mixed effect models (ME) (3).
The OE method is entrenched and widely used (2). However, it has limitations. It captures only one of the two important sources of data variation: random variation across patient outcomes, but not variations across transplant centers (2). It might also overestimate the number of centers considered to be outliers and therefore exaggerate differences between the centers with the best and worst outcomes (2, 4).
The ME method may overcome these limitations. It captures variation across transplant centers (3), and its theoretical properties suggest that it might be superior to the OE method. For example, when random effects are independent across centers and follow the same distribution, the ME method minimizes mean square errors between the estimated means for each center and the true unknown mean (3). The ME method also avoids exaggerated estimates and false classification of centers as outliers, making it the gold standard for public reporting in thoracic surgery (4–6). It has not been previously applied to transplantation.
Our analysis of the OE and ME methods compares standardized outcomes with data from one time period (“past”) to those using data from a future time period (“future”). We address four questions: (1) How large is outcome variability across centers? (2) Which method (OE versus ME) has the smallest difference between “past” and “future” outcomes and is therefore more accurate? (3) Have existing public reports induced underperforming providers to improve and thus reduce outcome variability? (4) What is the potential outcome improvement that can be achieved by reducing variability?
Materials and Methods
Data
Data on all transplant recipients between 1995 and 2009 were obtained from the 2010 United States Renal Data System Standard Analytic Files (7). These files also included data on patient risk factors derived from the Medical Evidence Form (CMS-2728) and from the UNOS Transplant Recipient registration forms, as well as donor characteristics from the donor registration forms. We considered outcomes on 3-year patient mortality and 3-year graft failure (death with a functioning graft was considered a graft failure). All records had a valid date of transplant, and therefore no patient was excluded. Missing values were assumed to be missing at random and were handled by a dummy variable for each patient risk factor and donor characteristic to indicate the value present or missing. For continuous variables with a missing value, we replaced that value with its average across all patients.
Observed-to-Expected Method
Standardized outcomes were calculated by the OE method in two steps.
Regression Model.
We fit a logistic regression model to 3-year patient mortality and graft failure data on all transplants at all centers. Patients with less than 3 years of follow-up were excluded. Covariates were selected from patient demographics, patient comorbidities, and donor risk factors using a training-testing stepwise regression approach. The training set was used to select variables for the model (P < 0.01). The testing set was used to determine the variables to retain in the final model, model I (P < 0.05). To ensure that our conclusions were not biased because of the exclusion of important variables, we repeated variable selection with higher P value cut-offs for training and testing: 0.50 (model II) and 0.95 (model III). Supplemental Table S1 summarizes the covariates selected in the three models. The variables in model III were almost identical to those in the SRTR model (8).
Calculation of the OE Ratio.
The observed mortality and graft failure rates for each center were divided by their respective expected rates (regression model outputs). A P value for the hypothesis OE ≠ 1 (OE different from average) was calculated. Step 2 is the same as the SRTR approach (8).
Generalized Mixed-Effect Method
Outcomes were modeled using a generalized linear ME model with a logit link (3). The fixed effects were the covariates selected in the OE approach (which favor the OE method). The regression coefficients for the covariates were the same for all centers, but the intercept was different and was modeled as a random effect. Standardized estimates for 3-year patient mortality and graft failure for each center were derived in three steps: (1) the average of the fixed effect linear predictions for all patients was computed; (2) for each center, its random effect was added to the average obtained in step 1, and the sum was transformed back to the scale of the original outcome to create a standardized estimate, using the formula exp(sum)/(1 + exp(sum)) (i.e., inverting the logit links); and (3) the results from step 2 were divided by the unadjusted 3-year mortality and graft failure rates to create standardized rates. These rates had the same units and interpretation as the OE standardized rates. A P value to test the hypothesis that “center standardized rates ≠ 1” (different than average) was obtained.
Comparison of the Two Methods
To answer Question 1 on outcome variability across centers, we established a baseline by calculating standardized patient mortality and graft failure rates for both methods using all data. We obtained the percentiles of these rates and differences between the 5th and 95th percentiles for both methods. To facilitate interpretation, we converted percentile differences to differences in patient and graft survival by multiplying the standardized rates with the unadjusted averages across all patients and subtracting from 100%. For the ME method, we obtained the SD of the center random effects by outcome as well as their standard errors.
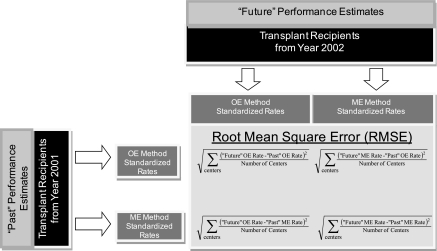
Regarding Question 2, we compared the accuracy of the two methods for calculating standardized rates and classifying centers as significantly different from average (P < 0.05). (These are outcomes measures used in the SRTR public reports [8].) We divided the data into annual cohorts and calculated the following for each cohort (Figure 1; “past” is assigned to year x and “future” is assigned to year x + 1): (1) we compared the difference between “past” and “future” standardized estimates for each center and computed the RMSEs for the difference, and to facilitate interpretation, the RMSE was multiplied by the unadjusted value of each outcome; and (2) for the accuracy of center classification by each method, we compared “past” and “future” classifications. We then computed a net misclassification index as the percentage of centers whose “past” classification differed from the “future” one. The robustness of this accuracy assessment was evaluated by dividing centers into deciles according to the values of their “future” performance standardized rates. The RMSEs for the OE and ME methods were computed by decile. In addition, for each method, we derived two RMSEs: one where “future” performance was based on the ME method and one where it was computed with the OE method. The calculations were repeated with all three models used for covariate selection.
Figure 1.
Method for calculating observed-to-expected (OE) and mixed-effect (ME) accuracy.
Association between Public Reporting and the Outcomes Gap
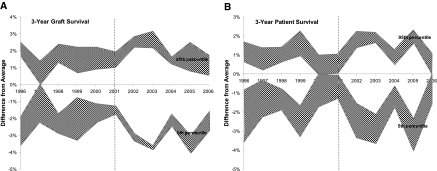
To answer Question 3, we plotted the difference of standardized rates between the 5th and 95th percentiles for each annual cohort from 1996 to 2006. Because the 5th and 95th percentiles were calculated with three models, we represented the range of values with a band. The outward band values corresponded to model I, and the inward values corresponded to model III. We fitted a trend line (linear regression) through the difference in ME standardized rates between the 5th and 95th percentile centers and tested whether the slope changed after the 2001 introduction of public reporting. To test the hypothesis that public reporting may have “raised all boats” (i.e., improved performance across all transplant centers), we fitted the same linear regression as above but with different dependent variables: case mix–adjusted patient and graft survival rates.
Potential Outcome Improvement if the Variability across Centers Were Reduced
To answer Question 4, we computed ME standardized rates using data from January 1, 1996, to September 30, 2006. We also calculated the number of patient deaths and graft failures in the first 3 years after transplant that could be averted per year if all centers' standardized rates matched the lowest rates. Sensitivity analysis was performed by aggregating centers into quartiles and assuming that all center quartiles would match the lowest quartile outcomes (SAS version 9.1, SAS Institute, Cary, NC).
Results
Descriptive Statistics
Table 1 presents descriptive statistics for kidney transplant recipients and donors, unadjusted 3-year patient and graft survival for all transplants performed from January 1, 1996, to September 30, 2006, and for the 1998, 2002, and 2006 annual cohorts. The SD values of these two outcomes indicated significant variations in unadjusted patient outcomes across centers: 16.1% and 17.0% SD for patient survival and graft survival, respectively. Also, the percentage of recipients with comorbidities (diabetes and cardiovascular diseases) and the percentage of higher risk donors (expanded criteria donors) have increased over time (P value <0.05).
Table 1.
Descriptive statistics for representative transplant recipients and donor comorbidities and outcomes over time
| 1996 to 2009 | 1998 | 2002 | 2006 | P for Trend | |
|---|---|---|---|---|---|
| Total number of recipients | 150,075 | 12,485 | 14,573 | 15,813 | |
| Recipient age and demographics | |||||
| age between 21 and 30 years | 10.99% | 12.91% | 10.04% | 8.84% | <0.001 |
| age between 31 and 50 years | 45.44% | 50.72% | 45.85% | 38.04% | <0.001 |
| age between 51 and 60 years | 25.62% | 23.13% | 26.18% | 28.76% | <0.001 |
| age greater than 60 years | 17.85% | 13.24% | 17.93% | 24.35% | <0.001 |
| male | 59.76% | 59.14% | 59.23% | 61.44% | 0.01 |
| Comorbidities | |||||
| recipient has diabetes | 26.35% | 25.91% | 27.42% | 27.62% | 0.01 |
| recipient was on dialysis | 75.34% | 77.41% | 77.19% | 75.89% | 0.27 |
| recipient had heart or vascular disease | 18.87% | 18.47% | 18.29% | 20.49% | <0.001 |
| recipient had hypertension | 74.84% | 69.75% | 76.63% | 81.18% | <0.001 |
| recipient had prior transplant(s) | 11.71% | 11.43% | 11.54% | 12.08% | 0.22 |
| Wait | |||||
| average wait time in years (for deceased donor recipients) | 1.98 | 1.63 | 2.08 | 2.12 | <0.001 |
| Recipient outcomes | |||||
| 3-year graft survival | 82.16% | 81.66% | 82.42% | 84.82% | <0.001 |
| 3-year patient survival | 90.28% | 90.29% | 90.29% | 91.73% | 0.32 |
| Outcome variation across center | |||||
| standard deviation of unadjusted 3-year graft survival | 16.1% | 7.84% | 8.60% | 7.30% | 0.72 |
| standard deviation of unadjusted 3-year patient survival | 17.0% | 5.14% | 6.35% | 5.59% | 0.76 |
| Donor characteristics | |||||
| deceased donor | 63.8% | 68.7% | 61.6% | 62.6% | <0.001 |
| expanded criteria donors | 10.85% | 10.46% | 8.50% | 12.35% | <0.001 |
| average total HLA antigen mismatches (A, B, and DR loci) | 3.39 | 3.13 | 3.33 | 3.60 | <0.001 |
| average HLA-A antigen mismatches | 1.19 | 1.14 | 1.18 | 1.23 | <0.001 |
| average HLA-B antigen mismatches | 1.29 | 1.16 | 1.25 | 1.40 | <0.001 |
| average HLA-DR antigen mismatches | 1.14 | 1.08 | 1.13 | 1.19 | <0.001 |
| peak panel reactive antibody (PRA) | 12.02 | 11.57 | 11.83 | 12.10 | <0.001 |
| donor weight (kg) | 75.89 | 72.89 | 74.87 | 78.34 | <0.001 |
| donor age | 38.34 | 36.65 | 37.61 | 39.54 | <0.001 |
| cold ischemia time (hours) | 13.93 | 15.20 | 13.37 | 13.23 | <0.001 |
| donor history of diabetes | 3.10% | 2.19% | 3.38% | 4.34% | <0.001 |
| donor history of hypertension | 18.42% | 19.23% | 18.74% | 18.19% | 0.23 |
Question 1: Variability in Standardized Outcomes
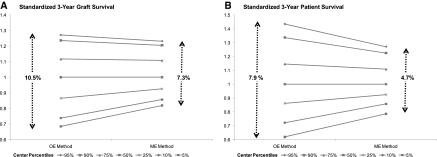
Percentiles for the standardized 3-year patient and graft survival rates across all transplant centers were computed with the OE versus the ME methods. The range of standardized rates across all percentiles from the ME method was smaller than the corresponding range from the OE method (Figure 2). This reflects the property of ME models to generate “shrunk” estimates (2–4). The ME method avoids exaggerating a single failure on the standardized estimates for centers with a small number of observations.
Figure 2.
The ranges of standardized 3-year graft survival rates (A) and patient survival rates (B) were smaller for the mixed-effect (ME) versus the observed-to-expected (OE) methods.
The range in standardized rates between the 5th and 95th percentiles is of the same order of magnitude as outcome differences between patients with living versus deceased donors. The 5th to 95th percentile range with the ME method was 7.3% and 4.7% for graft and patient survival, respectively (P value <0.01 for both estimates), versus the 9.6% and 5.7% difference in adjusted graft and patient survival between recipients of living and deceased donors (data not shown).
Question 2: Accuracy of ME versus the OE Method
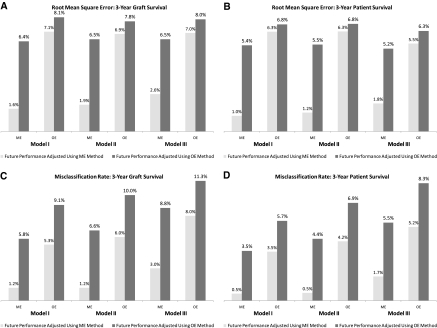
We calculated the RMSEs and misclassification rates for graft and patient survival as indicators of accuracy of the ME and OE methods. The ME method had a lower RMSE (Figure 3, A and B) and misclassification error (Figure 3, C and D). The RMSE for the ME method was reduced by at least one-third of the OE RMSEs to 2.6 and 1.8% for graft and patient survival, respectively (Figure 3, A and B, model III, OE light bars versus ME light bars). This was true when future performance was measured either with the OE or with the ME method (Figure 3, A through D, light versus dark bars). We also used three different covariate selection models for sensitivity analysis, and the ME method's improved accuracy held under all three models.
Figure 3.
Lower root mean square error (RMSE) (A and B) and misclassification errors (C and D) for the mixed-effect (ME) method compared with the observed-to-expected (OE) method.
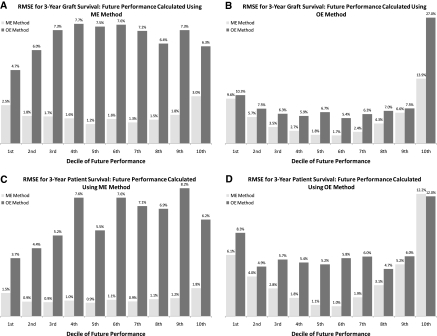
The improved accuracy of the ME method compared with the OE method persisted across both low and high performing centers. Figure 4 indicates the lower RMSEs for the ME method in every decile center group of “future” performance (light bars versus dark bars). This result was obtained for both graft survival (Figure 4, A and B) and patient survival (Figure 4, C and D), as well as for “future” performance from the OE (Figure 4, B and D) and ME (Figure 4, A and C) methods. The ME method had lower misclassification error and RMSE than the OE method because the OE method misclassified a significant number of average centers as different from average, and the ME method corrected that misclassification (Supplemental Tables S2 and S3).
Figure 4.
The mixed-effect (ME) method's lower root mean square errors (RMSEs) and misclassification errors for standardized patient and graft survival rates persisted across all deciles of “future” performance. Note: Covariates were selected with Model II. Results for all other covariate models were similar. OE, observed-to-expected.
Question 3: Association between Public Reporting and the Gap in Outcomes across Centers
Standardized graft and patient survival rates fluctuated over time. The values for the 5th and 95th percentiles of standardized rates were calculated using three models for covariate selection (Figure 5, gray bands). However, the difference between the 5th and 95th percentile centers did not change after the introduction of public reporting in 2001 (Figure 5, white area between gray bands). Linear regression confirmed that the difference between the 5th and 95th center percentiles has not decreased after 2001 (P value 0.61 and 0.74 for no change in patient and graft survival differences, respectively).
Figure 5.
The difference in standardized graft survival (A) and patient survival (B) rates between centers in the 5th and 95th percentiles did not change after the introduction of public reporting (dotted line). Note: The ME method was used.
To explore whether public reporting was associated with a “raise all boats” phenomenon, meaning that all centers improved equally with the difference remaining unchanged, we measured the slope of the trend line of case mix–adjusted graft and patient survival rates before and after public reporting. We found no increase in the slope of the trend for graft survival after public reporting (P value = 0.41), and a 0.20% per year increase in the slope of the patient survival trend (P value = 0.08). This is a very small change compared with the 4.7% difference between the 5th and 95th percentile centers (Figure 2B). The results under Question 4 (below) also show that the 0.2% per year increase in the average patient survival across all centers is a very small fraction of the potential improvement.
Question 4: Potential Outcome Improvement from Reducing Cross-center Variability
We explored the potential effect of improving center performance. If every center matched the center with the highest standardized patient and graft survival rates, the percentage of deaths and graft failures that could be averted would be 29 and 33%, respectively (Table 2). The potential improvement was 13% if centers were divided into quartiles (covariates selected using model II, models I and III yielded similar results.)
Table 2.
Number of deaths and graft failures averted if every center matched the center with the best outcomes
| If All Center Outcomes Matched the Top Center | If All Center Outcomes Matched the Average Top 20% | |
|---|---|---|
| Lives saved (in 3 years after transplant) | 496 | 201 |
| Grafts saved (in 3 years after transplant) | 793 | 349 |
| ↓ | ↓ | |
| Deaths avoided (in 3 years after transplant) | 33% | 13% |
| Graft failures avoided (in 3 years after transplant) | 29% | 13% |
The full 33% improvement corresponds to an average 496 potential lives saved per year (Table 2). Of these, only 87.6 average lives were actually saved per year as a result of a possible “raise all boats” phenomenon from the introduction of public reporting (on the basis of the 0.20% per year increase in average case-mix-adjusted patient survival across all centers; Question 3). Therefore, a possible “raise all boats” phenomenon resulted in small outcome improvements.
Discussion
We compared two methods for calculating standardized outcomes of transplant centers: the existing OE method and the ME method not previously applied to transplantation. Both methods have their limitations. If there are unreported or missing variables, they can generate misleading estimates for a center's performance. They are both subject to up-coding bias: centers can obtain favorable estimates if they exaggerate the complexity of the cases they report. Finally, both methods rely on sophisticated statistical models that are difficult to explain to end users: patients and doctors. The ME method has the additional limitation that it is more complex and labor intensive than the OE.
However, despite its complexity, our results suggest that the ME method has advantages over the OE. Its lower RMSE and misclassification error indicates that the number of centers erroneously marked as outliers would be reduced if the ME were adopted by public reporting in kidney transplantation. It would also provide a more realistic assessment of outcome differences across centers.
The rationale behind public reporting is to serve as an incentive for centers with lower performance to improve. Public reports would increase external pressures on centers by payers and patients (9,10) and would induce them to improve to restore their public standing (9) and avoid loss of market share. Outcome improvement would then result in smaller variability of standardized outcomes across centers. However, our results do not provide any evidence that such center improvements occurred after the introduction of public reporting in 2001. The difference between the top and bottom performing centers remained the same before and after public reporting. Although there is a possibility that public reporting may have “raised all boats” equally, masking differences in variability, we found that such an association is small: only 17.7% of the full potential improvement.
There are several explanations for the limited association between public reporting and a reduced outcomes gap, including provider capabilities, credibility of public reports, and strength of incentives (11,12). Regarding provider capabilities, further research is necessary on transplant centers' processes and resources to successfully implement quality improvement initiatives. With respect to credibility of public reports, stakeholders are concerned about volatility in reported outcomes (wild changes from year to year) and poor risk adjustment (4). Our results suggest that because of its lower RMSE, the ME method can overcome the volatility concern. Risk adjustment is criticized because reported differences in risk-adjusted outcomes could be due to missing variables (2,4). We found that missing variables do not affect measurements of center differences with the ME method. We performed the analysis with three different sets of variables, and in all cases where the variability exists, it is significant and has not decreased since 2001. However, this does not exclude the possibility that outcome estimates for individual centers may be inaccurate because of unobserved missing variables. Additional research on the possible effect of missing variables is necessary. Finally, regarding limited center incentives to change their performance, Medicare disqualification is based on an OE ratio greater than 1.5, a difference between observed and expected greater than 3 and a P value of less than 0.05 (13). Because only few centers are affected by these criteria, the incentives for outcome improvements may not be sufficiently strong to have a measurable effect. Use of public reports by physicians who can influence patients' center choice could strengthen center incentives to improve.
In conclusion, the ME methodology may overcome some of the limitations of the OE method currently used in public reporting. Continuous improvement of the ME method and communication of results on center differences to nephrologists who can recommend centers to their patients (11,12) could strengthen the effectiveness of public reports.
Disclosures
S. Z. and C. P. own equity at Culmini, G. A. is an independent contractor for Culmini, and C. M. receives consulting fees from Culmini. Culmini develops web tools under www.konnectology.com to support public reporting of outcomes to patients and physicians. S. Z. conducted this research on unpaid leave from Stanford University.
Acknowledgments
This research was supported in part by National Institutes of Health Grants 2R44DK07209-01 and 2R44DK07209-02.
Footnotes
Published online ahead of print. Publication date available at www.cjasn.org.
See related editorial, “Influence of Reporting Methods of Outcomes across Transplant Centers,” on pages 2732–2734.
References
- 1. Levine GN, McCullough KP, Rodgers AM, Dickinson DM, Ashby VB, Schaubel DE: The 2005 SRTR report on the state of transplantation: Analytical methods and database design: Implications for transplant researchers. Am J Transplant 6: 1228–1242, 2005 [DOI] [PubMed] [Google Scholar]
- 2. Ash AS, Shwartz M, Pekoz E: Comparing outcomes across providers. In Risk Adjustment for Measuring Health Outcomes, edited by Iezzoni L, Chicago, Health Administration Press, 2003 [Google Scholar]
- 3. McCulloch CE, Searle SR: Generalized, Linear, and Mixed Models. New York, John Wiley & Son, 2001 [Google Scholar]
- 4. Shahian DM, Normand S, Torchiana DF, Lewis SM, Pastore JO, Kuntz RE, Dreyer PI: Cardiac surgery report cards: Comprehensive review and statistical critique. The Ann Thorac Surg 72: 2155–2168, 2001 [DOI] [PubMed] [Google Scholar]
- 5. Peterson ED, Roe MT, Mulgund MS: Association between hospital process performance and outcomes among patients with acute coronary syndromes. JAMA 295: 1912–1920, 2000 [DOI] [PubMed] [Google Scholar]
- 6. McGrath PD, Wennberg DE, Dickens JD, Jr: Relation between operator and hospital volume and outcomes following percutaneous coronary interventions in the era of the coronary stents. JAMA 284: 3139–3144, 2000 [DOI] [PubMed] [Google Scholar]
- 7. National Institutes of Health, National Institutes of Diabetes, Digestive, and Kidney Diseases: Researcher's Guide to the USRDS Database, Bethesda, MD, United States Renal Data System, 2004 [Google Scholar]
- 8. Department of Health and Human Services, Health Resources 2010 Annual Data Report of the U.S. Organ Procurement and Transplantation Network and the Scientific Registry of Transplant Recipients, 2010, US Department of Health and Human Services, Health Resources and Services Administration, Rockville, MD [Google Scholar]
- 9. Hibbard JH, Stockard J, Tusler M: Does publicizing hospital performance stimulate quality improvement efforts? Health Affairs 22: 84–94, 2003 [DOI] [PubMed] [Google Scholar]
- 10. Zenios S, Denend L: United Resource Networks: Facilitating Win-Win-Win Solutions in Organ Transplantation. Stanford, California, Graduate School of Business, Stanford University, OIT-46, 2005 [Google Scholar]
- 11. Marshall MN, Romano PS, Davies HTO: How do we maximize the impact of the public reporting of quality of care? Int J Quality Health Care 16: i57–i63, 2004 [DOI] [PubMed] [Google Scholar]
- 12. Chernew JT, Kolstad ME: Quality and consumer decision making in the market for health insurance and health care services. Med Care Res Rev 66: 28S–52S, 2009 [DOI] [PubMed] [Google Scholar]
- 13. Federal Registrar, Medicare Program: Hospital Conditions of Participation: Requirements for Approval and Re-Approval of Transplant Centers To Perform Organ Transplants, 42 CFR Parts 405, 482, 488, and 498, 2007, US Department of Health of Human Services, Centers for Medicare and Medicaid Services, Baltimore, MD: [PubMed] [Google Scholar]


