

Abstract
Summary
Background and objectives
The Oxford classification of IgA nephropathy (IgAN) includes mesangial hypercellularity, endocapillary hypercellularity, segmental glomerulosclerosis (S), and tubular atrophy/interstitial fibrosis (T) as prognosticators. The value of extracapillary proliferation (Ex) was not addressed. Because the Oxford classification excludes patients with urinary protein <0.5 g/d and eGFR <30 ml/min per 1.73 m2 at biopsy, the significance of Ex should be confirmed by validation cohorts that include more rapidly progressive cases. We present such a study.
Design, setting, participants, & measurements
The significance of pathologic features for development end-stage renal failure (ESRF) was examined by multivariate analysis in 702 patients with IgAN. The association of Ex with kidney survival was examined by univariate analysis in 416 patients who met the Oxford criteria and 286 who did not, separately.
Results
In a multivariate model, S and T were significantly associated with ESRF. With addition of Ex, not S but Ex was significant for ESRF. In univariate analysis, kidney survival was significantly lower in patients with Ex than in those without, in patients who did not meet the Oxford criteria, but such a difference was not found in patients who met it.
Conclusions
The prognostic significance of Ex was evident in our cohort. It seems that Ex did not emerge from the Oxford classification as a prognosticator because of exclusion of severe cases (eGFR <30 ml/min per 1.73 m2). We suggest that extracapillary proliferation be included in the next version of the Oxford classification of IgAN to widen the scope of the classification.
Introduction
Several pathologic classifications have been described for IgAN (1–7), but none has so far achieved widespread acceptance.
Recently, the Oxford classification of IgAN has been proposed by an international working group (8,9). They identified four lesions as specific pathologic features that showed independent value in predicting renal outcome: mesangial hypercellularity, endocapillary hypercellularity, segmental glomerulosclerosis, and tubular atrophy/interstitial fibrosis. The patients studied for this classification had been selected for moderate signs of disease activity, excluding those with very mild disease and with rapidly progressive disease.
Extracapillary proliferation had been reported as one of the most important prognosticators in IgAN (10–22). In the Oxford classification, the clinical effect of crescent was limited by exclusion of rapidly progressive cases and thus a low percentage of glomeruli showing crescents in each case. Cattran et al. suggested that the significance of crescents may well be confirmed if validation cohorts include more rapidly progressive cases (9).
Such a validation study is presented here, performed in a cohort of 702 patients with IgAN including severe cases. Extracapillary proliferation was found to be of prognostic significance.
Materials and Methods
Study Population
Seven hundred two patients with biopsy-proven primary IgAN with 12 months or more follow-up and with 10 or more glomeruli per biopsy were included in the study. The patients who developed end-stage renal failure (ESRF) within 12 months were included.
Clinical Parameters
Estimated GFR (eGFR), mean arterial pressure, and urinary protein creatinine excretion ratio (UP-UCR) were used as clinical parameters. eGFR for Japanese people was calculated using the following formula (23):
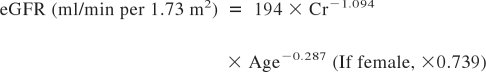 |
In addition, with or without steroid treatment was used as a clinical parameter to adjust the influence of steroids.
Pathologic Parameters
Pathologic parameters were estimated according to the definition of the Oxford classification (8). Mesangial hypercellularity score (M) was defined as M0, 0.5 or less, and M1, >0.5. Endocapillary hypercellularity (En), segmental glomerulosclerosis (S), and extracapillary proliferation (Ex) were scored 0 in the absence and 1 in the presence. Segmental glomerulosclerosis and tuft adhesion were analyzed together. Extracapillary proliferation involved cellular and fibrocellular crescents. Tubular atrophy/interstitial fibrosis (T) was semiquantitatively graded according to the percentage of involved area of the renal cortical area as follows: T0, <25; T1, between 25 and 50; T2, >50.
The percentage of glomeruli with each glomerular lesion was also analyzed.
Multivariate Analysis of the Influence of Pathologic Parameters on Renal Outcome
The influence of pathologic lesions on renal outcome was evaluated by multivariate analysis. The analyzed models were as follows:
We analyzed these two models in all of the patients and also in the patients who met the inclusion criteria of Oxford classification, that is, UP-UCR ≥0.5 and eGFR ≥30 ml/min per 1.73 m2 at renal biopsy and followed up at least 12 months.
We also assessed interaction in the effect of steroid therapy on the development of ESRF between statues of each pathologic parameter.
Univariate Analysis of the Influence of Extracapillary Proliferation on Kidney Survival
We examined the association of Ex with kidney survival by univariate analysis in two different groups of patients as follows. One is the patients who met inclusion criteria of the Oxford classification. The other is those who did not meet it.
Comparison of Clinical Characteristics and Pathologic Parameters among the Groups
All of the patients were subclassified as follows: Group A, eGFR ≥30 ml/min per 1.73 m2 and UP-UCR <0.5; group B, eGFR ≥30 ml/min per 1.73 m2 and UP-UCR ≥0.5 (inclusion criteria of Oxford classification); group C, eGFR <30 ml/min per 1.73 m2. The clinical and pathologic parameters were compared among the groups.
Statistical Analyses
The Cox proportional hazards model was used in multivariate analysis. The Kaplan-Meier method was used in univariate analysis. Statistical significance of difference in kidney survivals between the two groups was assessed by Log rank test. The end point was ESRF requiring renal replacement therapy. The chi-squared test, Mann-Whitney U-test, Kruskal-Wallis method, and ANOVA with Bonferroni test were used in comparison analysis. P < 0.05 was estimated as statistical significance. In comparison between two among three groups, P < 0.0167 was estimated as statistical significance.
Results
Baseline Characteristics and Follow-up Data
The baseline characteristics and follow-up data are shown in Table 1. Median age was 30. Fifty-eight percent of patients were women. Mean eGFR was 82 ± 35 ml/min per 1.73 m2. Median UP-UCR was 0.85 g/gcr. Median follow-up period was 62 months. Thirty-two percent of patients received steroid treatment after the biopsy. No patients received any other immunosuppressants. The percentage of patients treated with angiotensin converting enzyme inhibitor (ACEI) and/or angiotensin receptor blocker (ARB) at the biopsy was 3% and rose to 37% during the follow-up. Twelve percent of patients developed ESRF. Eight patients developed ESRF within 12 months from the biopsy.
Table 1.
Baseline characteristics and follow-up data
| Value | |
|---|---|
| Age (years) | 30 (8 to 82) |
| Women (%) | 58 |
| BMI | 22 ± 3 |
| MAP (mmHg) | 92 ± 15 |
| eGFR (ml/min per 1.73 m2) | 82 ± 35 |
| CKD stages 1/2/3/4/5 (%) | 37/37/21/3/1 |
| UP-UCR (g/gcr) | 0.85 (0 to 17) |
| ACEI/ARB (%) | 3 |
| Follow-up data | |
| follow-up (months) | 62 (6a to 281) |
| steroid (%) | 32 |
| ACEI/ARB (%) | 37 |
| ESRF (%) | 12 |
BMI, body mass index; MAP, mean arterial pressure; eGFR, estimated glomerular filtration rate; CKD, chronic kidney disease; UP-UCR, urinary protein creatinine excretion ratio; ACEI, angiotensin converting enzume inhibitor; ARB, angiotensin receptor blocker; ESRF, end-stage renal failure.
Eight patients developed ESRF within 12 months.
Pathologic Parameters
The percentage of patients with M1, En1, S1, and Ex1 was 12, 42, 79, and 63%, respectively (Table 2). T of grade 0 to 2 was observed in 71, 18, and 12% of patients, respectively.
Table 2.
The percentage of the presence of each pathologic parameter
| M1 | 12 |
| En1 | 42 |
| S1 | 79 |
| Ex1 | 63 |
| Tubular atrophy/interstitial fibrosis | |
| <25% | 71 |
| 25 to 50% | 18 |
| >50% | 12 |
The number in the right-hand column is the percentage of patients with each pathologic parameter. Abbreviations: M1, mesangial hypercellularity score more than 0.5 of glomeruli; En1, presence of endocapillary hypercellularity; S1, presence of segmental glomerulosclerosis; Ex1, presence of extracapillary proliferation.
The median mesangial hypercellularity score was 0.15, ranging from 0 to 2. The median and the range of percentage of glomeruli with En, S, and Ex were 0 (0 to 70.6), 8.7 (0 to 58.3), and 4.2 (0 to 73.3), respectively.
Multivariate Analysis
Model 1: M, En, S, T + Clinical Parameters
The result of this model using all 702 patients is shown in Table 3. In this model, S and T were significantly associated with the development of ESRF. The risk for the development of ESRF was significantly greater in S1 compared with S0 (hazard ratio [HR] 2.80, 95% confidence interval [CI] 1.26 to 6.20). The risk for ESRF was significantly greater in T1 and T2 compared with T0 (HR 2.71, 95% CI 1.31 to 5.61, and HR 8.75, 95% CI 4.13 to 18.6, respectively). M1 showed a tendency for high risk of ESRF compared with M0 (HR = 1.69, 95% CI 0.99 to 2.89). En showed no significant association with the development of ESRF. eGFR, UP-UCR, and the use of steroid showed a significant association with renal outcome.
Table 3.
Hazard ratios for the development of end-stage renal failure in the model including M, En, S, T, and clinical parameters
| Variables | HR (95% CI) | P | |
|---|---|---|---|
| MAP | (every 10 mmHg) | 1.00 (0.86 to 1.16) | 0.97 |
| eGFR | (every 10 ml/min) | 0.75 (0.65 to 0.85) | <0.01 |
| UP-UCR | (every 1) | 1.13 (1.05 to 1.22) | <0.01 |
| Steroid, no | (versus yes) | 2.52 (1.49 to 4.26) | <0.01 |
| En1 | (versus En0) | 0.81 (0.48 to 1.37) | 0.43 |
| M1 | (versus M0) | 1.69 (0.99 to 2.89) | 0.06 |
| S1 | (versus S0) | 2.80 (1.26 to 6.20) | 0.01 |
| Tubular atrophy/interstitial fibrosis | <0.01 | ||
| 25 to 50% | (versus <25%) | 2.71 (1.31 to 5.61) | <0.01 |
| >50% | (versus <25%) | 8.75 (4.13 to 18.6) | <0.01 |
Abbereviations: HR, hazard ratio; CI, confidence interval; MAP, mean arterial pressure; eGFR, estimated glomerular filtration rate; UP-UCR, urinary protein creatinine excretion ratio; En0, absence of endocapillary hypercellularity; En1, presence of endocapillary hypercellularity; M0, mesangial hypercellularity score 0.5 or less; M1, mesangial hypercellularity score >0.5; S0, absence of segmental glomerulosclerosis. S1, presence of segmental glomerulosclerosis.
Model 2: M, En, S, T + Ex + Clinical Parameters
The result of this model using all 702 patients is shown in Table 4. In this model, not S but Ex showed a significant association with the development of ESRF as well as T. The risk for the development of ESRF was significantly greater in Ex1 compared with Ex0 (HR 1.88, 95% CI 1.04 to 3.39). The risk for ESRF in T1 or T2 was similar to that of model 1.
Table 4.
Hazard ratios for the development of end-stage renal failure in the model including M, En, S, T, Ex, and clinical parameters
| Variables | HR (95% CI) | P | |
|---|---|---|---|
| MAP | (every 10 mmHg) | 1.00 (0.87 to 1.16) | 0.95 |
| eGFR | (every 10 ml/min) | 0.75 (0.65 to 0.85) | <0.01 |
| UP-UCR | (every 1) | 1.13 (1.05 to 1.22) | <0.01 |
| Steroid, no | (versus yes) | 2.73 (1.61 to 4.63) | <0.01 |
| Ex1 | (versus Ex0) | 1.88 (1.04 to 3.39) | 0.04 |
| En1 | (versus En0) | 0.72 (0.43 to 1.22) | 0.22 |
| M1 | (versus M0) | 1.59 (0.93 to 2.73) | 0.09 |
| S1 | (versus S0) | 2.18 (0.96 to 4.98) | 0.06 |
| Tubular atrophy/interstsitial fibrosis | <0.01 | ||
| 25 to 50% | (versus <25%) | 2.67 (1.30 to 5.50) | <0.01 |
| >50% | (versus <25%) | 8.74 (4.15 to 18.4) | <0.01 |
Abbereviations: HR, hazard ratio; CI, confidence interval; MAP, mean arterial pressure; eGFR, estimated glomerular filtration rate; UP-UCR, urinary protein creatinine excretion ratio; Ex0, absence of extracapillary proliferation; Ex1, presence of extracapillary proliferation; En0, absence of endocapillary hypercellularity; En1, presence of endocapillary hypercellularity; M0, mesangial hypercellularity score 0.5 or less; M1, mesangial hypercellularity score >0.5; S0, absence of segmental lomerulosclerosis; S1, presence of segmental glomerulosclerosis.
We modified model 2 using three categorized Ex according to the percentage of glomeruli with Ex as follows: Ex0, absence of Ex; Ex1, >0 and <10; Ex2, ≥10%. The risk for ESRF was significantly greater in Ex1 and Ex2 compared with Ex0 (HR 1.81, 95% CI 0.95 to 3.46 and HR 1.95, 95% CI 1.01 to 3.76, respectively). According to the receiver operating characteristic (ROC) curve, the optimal cutoff level of Ex for predicting the progression of ESRF was 6.8%.
In the analysis of patients who met inclusion criteria of Oxford classification, only T was significantly associated with the development of ESRF in both models 1 and 2.
We also addressed the effects of steroid therapy on the risk of ESRF according to the statuses of each pathologic parameter (Supplemental Table). The risk of incident ESRF decreased significantly by steroid therapy in patients with Ex (HR 0.35, 95% CI 0.20 to 0.62), but not in those without Ex. The same was true for patients with S (HR 0.35, 95% CI 0.20 to 0.61). However, no significant relationship between steroid therapy and the lower risk of ESRF was detected in patients with E (HR 0.53, 95% CI 0.22 to 1.27), M (HR 0.32, 95% CI 0.09 to 1.10), or T (HR 0.90, 95% CI 0.22 to 3.65). There was no evidence of interaction in the effects of steroid therapy on the development of ESRF between statuses of each pathologic parameter (all P for interaction >0.17).
Univariate Analysis of the Influence of Extracapillary Proliferation on Kidney Survival
Kidney survival was significantly lower in patients with Ex than in those without (P < 0.01; Figure 1). In 416 patients who met inclusion criteria of Oxford classification, there was no significant difference in kidney survival between the patients with Ex and those without it (Figure 2). In 286 patients who did not meet such criteria, kidney survival of patients with Ex was significantly lower than in those without (P < 0.01; Figure 3).
Figure 1.

Kidney survival curve in patients with and without extracapillary proliferation. Kidney survival was significantly lower in patients with extracapillary proliferation than in those without it (P < 0.01). The number of patients remaining at 60, 120, 180, and 240 months of follow-up are shown at the bottom.
Figure 2.

Kidney survival curve in patients with and without extracapillary proliferation in the patients who met inclusion criteria of the Oxford classification. The inclusion criteria of Oxford classification is UP-UCR >0.5 and eGFR >30 ml/min per 1.73 m2 at the time of renal biopsy and followed up at least 12 months. There was no statistical significant difference in kidney survival between the patients with extracapillary proliferation and those without it. The number of patients remaining at 60, 120, 180, and 240 months of follow-up are shown at the bottom.
Figure 3.

Kidney survival curve in patients with and without extracapillary proliferation in the patients who did not meet inclusion criteria of the Oxford classification. The patients who did not meet inclusion criteria of Oxford classification had a UP-UCR <0.5 or eGFR <30 ml/min per 1.73 m2 at the time of renal biopsy or follow-up period was <12 months. Kidney survival of patients with extracapillary proliferation was significantly lower than those without it (P < 0.01). The kidney survival rapidly declined within 5 years from the biopsy in patients with extracapillary proliferation. The number of patients remaining at 60, 120, 180, and 240 months of follow-up are shown at the bottom.
Comparisons of Clinical Characteristics and Pathologic Parameters among Groups A, B, and C
There were 254 patients in group A, 416 in B, and 32 patients in C. Clinical characteristics were compared among the three groups (Table 5). Age was youngest in group A, middle in B, and oldest in C (P < 0.01 in all comparisons). There were no statistical differences in gender distribution among the groups. Mean arterial pressure was lowest in group A, moderate in B, and highest in C (P < 0.01 in all comparisons). eGFR was highest in group A, moderate in B, and lowest in C (P < 0.01 in all comparisons). UP-UCR was mildest in group A, moderate in B, and most severe in C (P < 0.01 in all comparisons). The percentage of patients with steroid treatment was significantly higher in groups B and C than in A (P < 0.01, in both comparisons). The percentage of patients treated with ACEI and/or ARB was significantly higher in groups B and C than in A (P < 0.01, in both comparisons). The follow-up period was shortest in group C, moderate in A, and longest in B (P < 0.01, in both comparisons). The percentage of patients who developed ESRF was lowest in group A, average in B, and highest in C (P < 0.01 in all comparisons).
Table 5.
Clinical characteristics and follow-up data in patients who met inclusion criteria of Oxford classification and those who did not meet them
| Group A, eGFR ≥30, UP-UCR <0.5 | Group B, eGFR ≥30, UP-UCR ≥0.5 | Group C, eGFR <30 | Pa | |
|---|---|---|---|---|
| No. patients | 254 | 416 | 32 | <0.01 |
| Age (years) | 24 (8 to 70) | 33 (8 to 72)b | 45 (15 to 82)b,c | 0.4 |
| Women (%) | 59 | 58 | 47 | <0.01 |
| BMI | 21 ± 3 | 22 ± 3b | 23 ± 3b | <0.01 |
| MAP (mmHg) | 86 ± 13 | 94 ± 14b | 112 ± 17b,c | <0.01 |
| eGFR (ml/min per 1.73 m2) | 95 ± 32 | 80 ± 33b | 19 ± 6b,c | <0.01 |
| CKD stages 1/2/3/4/5 (%) | 53/39/8/0/0 | 31/39/30/0/0b | 0/0/0/72/28b,c | <0.01 |
| UP-UCR (g/gcr) | 0.15 (0 to 0.49) | 1.43 (0.5 to 17)b | 4.73 (0 to 15.9)b,c | <0.01 |
| Follow-up data | ||||
| steroid (%) | 15 | 42b | 44b | <0.01 |
| ACEI/ARB (%) | 22 | 45b | 48b | <0.01 |
| follow-up (months) | 57 (12 to 261) | 69 (12 to 281)b | 26 (6 to 147)b,c | <0.01 |
| ESRF (%) | 2 | 13b | 81b,c | <0.01 |
Abbreviations: BMI, body mass index; MAP, mean arterial pressure; eGFR, estimated glomerular filtration rate; CKD, chronic kidney disease; UP-UCR, urinary protein creatinine excretion ratio; ACEI, angiotensin converting enzume inhibitor; ARB, angiotensin receptor blocker; ESRF, end-stage renal failure.
P value by analysis of variance or the chi-square test.
Significantly different from group A by Bonferrorni method or multiple comparison of the chi-squared test.
Significantly different from group B by Bonferroni method or multiple comparison of the chi-squared test.
The percentage of patients with each glomerular parameter was compared among the groups (Table 6). The percentage of patients with M1 was significantly higher in groups B and C than in A (P < 0.01). The percentage of patients with En1 was significantly higher in group B than in A (P = 0.02). The percentage of patients with S1 was significantly higher in group B than in A (P < 0.01). The percentage of patients with Ex1 was significantly higher in groups B and C than in A (P < 0.01). The grade of T was mildest in group A, moderate in B, and most severe in C (P < 0.001 in all comparisons).
Table 6.
Pathologic parameters in patients who met inclusion criteria of Oxford classification and those who did not meet them
| Group A, eGFR ≥30, UP-UCR <0.5 | Group B, eGFR ≥30, UP-UCR ≥0.5 | Group C, eGFR <30 | Pa | |
|---|---|---|---|---|
| No. patients | 254 | 416 | 32 | |
| M1 (%) | 3 | 16b | 31b | <0.01 |
| En1 (%) | 36 | 45b | 44 | 0.05 |
| S1 (%) | 67 | 86b | 84 | <0.01 |
| Ex1 (%) | 47 | 71b | 78b | <0.01 |
| Tubular atrophy/interstitial fibrosis | <0.01 | |||
| <25 (%) | 91 | 63a | 3b,c | |
| 25 to 50 (%) | 7 | 24 | 9 | |
| 50<(%) | 2 | 12 | 88 |
The number is the percentage of patients with each pathologic parameter. Abbreviations: M1, mesangial hypercellularity in >50% of glomeruli; En1, presence of endocapillary hypercellularity; S1, presence of segmental glomerulosclerosis; Ex1, presence of extracapillary proliferation.
P value by analysis of variance or the chi-squared test.
Significantly different from group A by multiple comparison of the chi-squared test.
Significantly different from group B by multiple comparison of the chi-squared test.
The percentage of glomeruli with each glomerular lesion in three groups is shown in Table 7. The mesangial hypercellularity score was lowest in group A, average in B, and highest in C (P < 0.01 in all comparisons). The percentage of glomeruli with En was significantly higher in group B than in A (P < 0.01). The percentage of glomeruli with S was significantly higher in groups B and C than in A (P < 0.01 in both comparisons). The percentage of glomeruli with Ex was lowest in group A, average in B, and highest in C (P < 0.01 in all comparisons).
Table 7.
The percentage of glomeruli with each lesion in patients who met inclusion criteria of Oxford classification and those who did not meet it
| Group A, eGFR ≥30, UP-UCR <0.5 | Group B, eGFR ≥30, UP-UCR ≥0.5 | Group C, eGFR <30 | Pa | |
|---|---|---|---|---|
| No. patients | 254 | 416 | 32 | |
| Mesangial hypercellularity score | 0.08 (0 to 0.88) | 0.2 (0 to 2)b | 0.5 (0 to 2)b,c | <0.01 |
| Endocapillary hypercellularity (%) | 0 (0 to 71) | 0 (0 to 68)b | 0 (0 to 48) | 0.01 |
| Segmental glomerulosclerosis (%) | 4.3 (0 to 36) | 11.8 (0 to 58)b | 15 (0 to 46)b | <0.01 |
| Extracapillary proliferation (%) | 0 (0 to 30) | 6.3 (0 to 73.3)b | 10 (0 to 55)b,c | <0.01 |
The number is the median percentage of glomeruli with each pathologic lesion out of total glomeruli. The numbers in parentheses are the range of the percentage of glomeruli with each pathologic lesion.
P value is by Kruskal-Wallis method.
Significantly different from group A by multiple comparisons of Mann-Whitney U test.
Significantly different from group B by multiple comparisons of Mann-Whitney U test.
Discussion
The Oxford classification of IgAN has provided a new valuable asset because of the following reasons: (1) The study is based on international collaboration. (2) A clear definition was established for the various pathologic lesions. (3) Interobserver reproducibility of the diagnosis of each pathologic lesion was established. (4) Pathologic parameters were selected that affect kidney outcome independently from clinical parameters by strict statistical analysis.
Previously, we reported that serum creatinine ≥1.5 mg/dl in men and ≥1.3 mg/dl in women, 24-hour urinary protein excretion exceeding 2 g, segmental lesions including crescents, segmental sclerosis and tuft adhesion in 25% or more of glomeruli, and interstitial fibrosis involving >25% of renal cortical area emerged as independent prognosticators in our retrospective study in 225 patients with IgAN (19). We had suggested that glomerular segmental lesions such as crescents, segmental sclerosis, and tuft adhesions may be the most important prognostic factors indicating ongoing inflammation and subsequent progression to irreversible obliteration of glomerular capillaries. These lesions were frequently observed to be associated with each other. Segmental sclerosis and tuft adhesion might result from or be related to crescent formation. Therefore, we had speculated that crescents may be the most important prognosticator in IgAN. The prognostic significance of crescents in IgAN has been reported by many other investigators (10–18,20–22).
Crescent was not selected in Oxford classification (8,9). Cattran et al. (9) commented that rapidly progressive IgAN is rare, and is almost always associated with abundant crescents. The requirement for their study entry of at least 1 year of follow-up excluded those most likely to have extensive crescent formation. On the basis of the evidence obtained in their cohort, they could not justify the inclusion of crescents in Oxford classification.
In this study, a multivariate model including M, En, S, T, and clinical parameters revealed that S and T significantly associated with the development of ESRF. When Ex was added to the model, not S but Ex showed a significant association with the development of ESRF. Therefore, a prognostic significance of Ex in IgAN was confirmed in our cohort.
In univariate analysis, the significant association of Ex with poor outcome was not evident in patients who met inclusion criteria of Oxford classification but was evident in those who did not meet it. Thus, the reason why Ex was not detected as a prognostic factor in the Oxford classification is likely due to the selection criteria of their study.
Extremely mild and severe cases were excluded in Oxford classification. In group A, only 2% of patients developed ESRF; however, 88% of patients developed ESRF in group C. Therefore, the significant association of Ex with poor outcome in patients who did not meet the inclusion criteria of Oxford classification is due to group C. Not the percentage of the patients with Ex but the percentage of glomeruli with Ex was significantly different between groups B and C. Thus, not the mere presence of Ex but the percentage of Ex seems to be important in association with poor kidney outcome. In group C, there were only 32 patients, 26 of whom developed ESRF. The median interval from onset to ESRF was 67 months (ranging 9 to 444) (the data are not shown). Only one patient developed ESRF within 12 months from the onset. Thus, the majority of patients in group C was not “so called rapidly progressive IgAN”, but very severe IgAN.
In the modified model 2, the HR for ESRF was significantly higher in Ex2 (Ex in 10% or more of glomeruli) than in Ex0. The optimal cutoff level of Ex by ROC curve was 6.8%. Thus, the cutoff point of Ex as a prognosticator might be around 10%.
In this study, we failed to reveal clear evidence of statistically significant interaction of the effects of steroid therapy on the development of ESRF between the statuses of each pathologic parameter, probably because of limited statistical power. However, the effect of steroids on the risk of ESRF tended toward being greater in patients with Ex than in patients without Ex, implying the steroid therapy would be more effective for reducing the risk of ESRF in patients with Ex than in those without it. Importantly, the percentage of patients who received steroids was higher in our cohort B than in Oxford classification (42 versus 29%). It may be one of the reasons why we did not find any significance of Ex on renal outcome in our cohort B.
We found no significant association of En with renal outcome in the analysis including not only all cases but also those that met inclusion criteria of the Oxford classification. Although in the Oxford classification study there was an interaction between steroids and En, we found no such interaction. This might be due to the difference of end point, which was ESRF in our study, and the slope of eGFR in Oxford classification.
We found that M showed a tendency to associate with renal outcome in model 1. Thus, M could be selected as one of the prognosticators.
The limitation of this study is that we did not evaluate interobserver reproducibility of diagnosis of each pathologic lesion. One observer (R.K.) evaluated all pathologic parameters.
Conclusions
The prognostic significance of extracapillary proliferation was evident in our cohort study. We suggest that extracapillary proliferation should be included in the next version of Oxford classification of IgA nephropathy, strengthening it to a more comprehensive system.
Disclosures
None.
Acknowledgments
We thank Dr. Jan J. Weening, Erasmus Medical Center, Rotterdam, The Netherlands, for checking the manuscript and giving us useful comments. This work was supported by the National Hospital Organization.
Footnotes
Published online ahead of print. Publication date available at www.cjasn.org.
Supplemental information for this article is available online at www.cjasn.org.
References
- 1. Alamartine E, Sabatier JC, Berthoux FC: Comparison of pathological lesions on repeated renal biopsies in 73 patients with primary IgA glomerulonephritis: Value of quantitative scoring and approach to final prognosis. Clin Nephrol 34: 45–51, 1990 [PubMed] [Google Scholar]
- 2. Radford MG, Jr, Donadio JV, Jr, Bergstralh EJ, Grande JP: Predicting renal outcome in IgA nephropathy. J Am Soc Nephrol 8: 199–207, 1997 [DOI] [PubMed] [Google Scholar]
- 3. Katafuchi R, Kiyoshi Y, Oh Y, Uesugi N, Ikeda K, Yanase T, Fujimi S: Glomerular score as a prognosticator in IgA nephropathy: Its usefulness and limitation. Clin Nephrol 49: 1–8, 1998 [PubMed] [Google Scholar]
- 4. Lee SM, Rao VM, Franklin WA, Schiffer MS, Aronson AJ, Spargo BH, Katz AI: IgA nephropathy: Morphologic predictors of progressive renal disease. Hum Pathol 13: 314–322, 1982 [DOI] [PubMed] [Google Scholar]
- 5. Haas M: Histologic subclassification of IgA nephropathy: A clinicopathologic study of 244 cases. Am J Kidney Dis 29: 829–842, 1997 [DOI] [PubMed] [Google Scholar]
- 6. Wakai K, Kawamura T, Endoh M, Kojima M, Tomino Y, Tamakoshi A, Ohno Y, Inaba Y, Sakai H: A scoring system to predict renal outcome in IgA nephropathy: From a nationwide prospective study. Nephrol Dial Transplant 21: 2800–2808, 2006 [DOI] [PubMed] [Google Scholar]
- 7. Manno C, Strippoli GF, D'Altri C, Torres D, Rossini M, Schena FP: A novel simpler histological classification for renal survival in IgA nephropathy: A retrospective study. Am J Kidney Dis 49: 763–775, 2007 [DOI] [PubMed] [Google Scholar]
- 8. Working Group of the International IgA Nephropathy Network, the Renal Pathology Society, Roberts IS, Cook HT, Troyanov S, Alpers CE, Amore A, Barratt J, Berthoux F, Bonsib S, Bruijn JA, Cattran DC, Coppo R, D'Agati V, D'Amico G, Emancipator S, Emma F, Feehally J, Ferrario F, Fervenza FC, Florquin S, Fogo A, Geddes CC, Groene HJ, Haas M, Herzenberg AM, Hill PA, Hogg RJ, Hsu SI, Jennette JC, Joh K, Julian BA, Kawamura T, Lai FM, Li LS, Li PK, Liu ZH, Mackinnon B, Mezzano S, Schena FP, Tomino Y, Walker PD, Wang H, Weening JJ, Yoshikawa N, Zhang H: The Oxford classification of IgA nephropathy: Pathology definitions, correlations, and reproducibility. Kidney Int 76: 546–556, 2009 [DOI] [PubMed] [Google Scholar]
- 9. Working Group of the International IgA Nephropathy Network, the Renal Pathology Society, Cattran DC, Coppo R, Cook HT, Feehally J, Roberts IS, Troyanov S, Alpers CE, Amore A, Barratt J, Berthoux F, Bonsib S, Bruijn JA, D'Agati V, D'Amico G, Emancipator S, Emma F, Ferrario F, Fervenza FC, Florquin S, Fogo A, Geddes CC, Groene HJ, Haas M, Herzenberg AM, Hill PA, Hogg RJ, Hsu SI, Jennette JC, Joh K, Julian BA, Kawamura T, Lai FM, Leung CB, Li LS, Li PK, Liu ZH, Mackinnon B, Mezzano S, Schena FP, Tomino Y, Walker PD, Wang H, Weening JJ, Yoshikawa N, Zhang H: The Oxford classification of IgA nephropathy: Rationale, clinicopathological correlations, and classification. Kidney Int 76: 534–545, 2009 [DOI] [PubMed] [Google Scholar]
- 10. Abe T, Kida H, Yoshimura M, Yokoyama H, Koshino Y, Tomosugi N, Hattori N: Participation of extracapillary lesions (ECL) in progression of IgA nephropathy. Clin Nephrol 25: 37–41, 1986 [PubMed] [Google Scholar]
- 11. Chida Y, Tomura S, Takeuchi J: Renal survival rate of IgA nephropathy. Nephron 40: 189–194, 1985 [DOI] [PubMed] [Google Scholar]
- 12. Droz D, Kramar A, Nawar T, Noël LH: Primary IgA nephropathy: Prognostic factors. Contrib Nephrol 40: 202–207, 1984 [DOI] [PubMed] [Google Scholar]
- 13. Yoshikawa N, Ito H, Nakamura H: Prognostic indicators in childhood IgA nephropathy. Nephron 60: 60–67, 1992 [DOI] [PubMed] [Google Scholar]
- 14. Hood SA, Velosa JA, Holley KE, Donadio JV, Jr: IgA-IgG nephropathy: Predictive indices of progressive disease. Clin Nephrol 16: 55–62, 1981 [PubMed] [Google Scholar]
- 15. Woo KT, Edmondson RP, Wu AY, Chiang GS, Pwee HS, Lim CH: The natural history of IgA nephritis in Singapore. Clin Nephrol 25: 15–21, 1986 [PubMed] [Google Scholar]
- 16. Nicholls K, Walker RG, Dowling JP, Kincaid-Smith P: Malignant' IgA nephropathy. Am J Kidney Dis 5: 42–46, 1985 [DOI] [PubMed] [Google Scholar]
- 17. Freese P, Norden G, Nyberg G: Morphologic high-risk factors in IgA nephropathy. Nephron 79: 420–425, 1998 [DOI] [PubMed] [Google Scholar]
- 18. Hogg RJ, Silva FG, Wyatt RJ, Reisch JS, Argyle JC, Savino DA: Prognostic indicators in children with IgA nephropathy—report of the Southwest Pediatric Nephrology Study Group. Pediatr Nephrol 8: 15–20, 1994 [DOI] [PubMed] [Google Scholar]
- 19. Katafuchi R, Oh Y, Hori K, Komota T, Yanase T, Ikeda K, Omura T, Fujimi S: An important role of glomerular segmental lesions on progression of IgA nephropathy: A multivariate analysis. Clin Nephrol 41: 191–198, 1994 [PubMed] [Google Scholar]
- 20. Boyce NW, Holdsworth SR, Thomson NM, Atkins RC: Clinicopathological associations in mesangial IgA nephropathy. Am J Nephrol 6: 246–252, 1986 [DOI] [PubMed] [Google Scholar]
- 21. Bitencourt-Dias C, Bahiense-Oliveira M, Saldanha LB, Barros RT, Woronik V: Comparative study of IgA nephropathy with and without crescents. Braz J Med Biol Res 37: 1373–1377, 2004 [DOI] [PubMed] [Google Scholar]
- 22. Walsh M, Sar A, Lee D, Yilmaz S, Benediktsson H, Manns B, Hemmelgarn B: Histopathologic features aid in predicting risk for progression of IgA nephropathy. Clin J Am Soc Nephrol 5: 425–430, 2010 [DOI] [PMC free article] [PubMed] [Google Scholar]
- 23. Matsuo S, Imai E, Horio M, Yasuda Y, Tomita K, Nitta K, Yamagata K, Tomino Y, Yokoyama H, Hishida A: Collaborators developing the Japanese equation for estimated GFR: Revised equations for estimated GFR from serum creatinine in Japan. Am J Kidney Dis 53: 982–992, 2009 [DOI] [PubMed] [Google Scholar]