

Abstract
Cholinergic and non-cholinergic neurons in the brainstem pedunculopontine (PPT) and laterodorsal tegmental (LDT) nuclei innervate diverse forebrain structures. The cholinergic neurons within these regions send heavy projections to thalamic nuclei and provide modulatory input as well to midbrain dopamine cells in the ventral tegmental area (VTA). Cholinergic PPT/LDT neurons are known to send collateralized projections to thalamic and non-thalamic targets, and previous studies have shown that many of the afferents to the VTA arise from neurons that also project to midline and intralaminar thalamic nuclei. However, whether cholinergic projections to the VTA and anterior thalamus (AT) are similarly collateralized is unknown. Ultrastructural work from our laboratory has demonstrated that cholinergic axon varicosities in these regions differ both morphologically and with respect to the expression and localization of the high-affinity choline transporter. We therefore hypothesized that the cholinergic innervation to these regions is provided by separate sets of PPT/LDT neurons. Dual retrograde tract-tracing from the AT and VTA indicated that only a small percentage of the total afferent population to either region showed evidence of providing collateralized input to the other target. Cholinergic and non-cholinergic cells displayed a similarly low percentage of collateralization. These results are contrasted to a control case in which retrograde labeling from the midline paratenial thalamic nucleus and the VTA resulted in higher percentages of cholinergic and non-cholinergic dual-tracer labeled cells. Our results indicate that functionally distinct limbic target regions receive primarily segregated signaling from PPT/LDT neurons.
Keywords: Acetylcholine, Limbic circuitry, Collateral, Brainstem, Midbrain, Dopamine
Introduction
The brainstem pedunculopontine (PPT) and laterodorsal tegmental (LDT) nuclei contain cholinergic neurons noted for their wide-reaching projections to diverse brain structures. Cholinergic neurons in these regions provide ascending input to virtually the entire thalamus (Hallanger et al. 1987; Jones and Webster 1988; Heckers et al. 1992), the midbrain dopaminergic cell groups in the substantia nigra pars compacta (SNc) and ventral tegmental area (VTA) (Beninato and Spencer 1987; Oakman et al. 1995), the basal forebrain (Hallanger and Wainer 1988), the hypothalamus, and, in a more limited manner, the cerebral cortex (Crawley et al. 1985; Satoh and Fibiger 1986). Furthermore, a number of studies have noted that these brainstem cholinergic neurons can innervate both thalamic and extrathalamic target structures through divergent axonal branches (Cornwall and Phillipson 1989; Jourdain et al. 1989; Bolton et al. 1993; Losier and Semba 1993; Billet et al. 1999).
The ascending cholinergic projections play an important role in the regulation of behavioral state and the detection of salient environmental stimuli (Inglis and Winn 1995; Reese et al. 1995; Yeomans 1995; Kobayashi and Isa 2002; Pan and Hyland 2005). In keeping with these functions, brainstem cholinergic groups innervate many structures that are integral components of limbic circuitry (Mesulam et al. 1983; Mesulam 1995). This is particularly true of the LDT, whose cholinergic neurons send projections to the anterior, parafascicular, mediodorsal and intralaminar thalamic nuclei, and even provide a minor input to the medial prefrontal cortex (Satoh and Fibiger 1986; Cornwall et al. 1990). Additionally, cholinergic LDT neurons innervate other ascending neuromodulatory systems important for limbic functions, such as serotonin neurons in the raphé nuclei and dopamine neurons in the VTA (Satoh and Fibiger 1986; Cornwall et al. 1990; Omelchenko and Sesack 2006; Mena-Segovia et al. 2008).
Although divergent projections from single LDT neurons have been described for the VTA and the intralaminar/midline thalamic groups (Bolton et al. 1993), the possibility of collateralized projections to the VTA and anterior thalamus (AT) has yet to be examined. We previously investigated the expression of the high-affinity choline transporter (CHT) in cholinergic axons innervating the VTA and the anteroventral thalamic nuclei (AVN) (Holmstrand et al. 2010). We found that axons in the AVN displayed higher total levels of CHT immunoreactivity and greater plasma membrane density of CHT immunogold particles. On the other hand, cholinergic terminals in the VTA were larger, more frequently formed synaptic junctions, and were more likely to contain dense-cored vesicles, an indication of neuropeptide co-transmission. Given these differences in cholinergic axon terminal populations, we hypothesized that the cholinergic afferents to the AVN and the VTA would originate from separate populations of PPT/LDT cells.
Although many studies have demonstrated collateralized projections from the PPT/LDT to discrete brain nuclei, the possibility of separate projections to the AVN and VTA is supported by the specific distribution of tegmental afferents to these regions. The AVN innervation arises predominantly from the LDT (Shibata 1992), while afferents to the VTA are more equally derived from both the PPT and LDT (Oakman et al. 1995; Holmstrand and Sesack 2004; Mena-Segovia et al. 2008). Interestingly, the AVN and VTA are interconnected with cortical and subcortical limbic regions that are largely exclusive of each other. For example, the mesocortical dopamine innervation heavily targets the medial prefrontal and anterior cingulate cortices (Beckstead et al. 1979; Loughlin and Fallon 1984), whereas AVN neurons project only to the posterior cingulate cortex (Shibata 1993), at least in the rat (Barbas et al. 1991). Neurons in the anteromedial thalamic nucleus (AM, a component of the AT) do provide some innervation of the anterior cingulate cortex, but projections to the posterior cingulate from this region are more prominent (Shibata and Kato 1993). Another significant target of VTA dopamine neurons is the nucleus accumbens, yet the AT does not send a substantial projection to this region (Giménez-Amaya et al. 1995; Erro et al. 1999; Smith et al. 2009). Such segregated circuitry suggests that these systems may receive specific cholinergic modulation from distinct sub-populations of PPT/LDT neurons.
We tested this hypothesis by performing dual retrograde tract-tracing using the β subunit of cholera toxin (CTxβ) and fluorescent latex microspheres (Retrobeads™) as discriminable tracing agents from the AT and VTA, respectively. We combined tracing with fluorescence immunohistochemistry for the vesicular acetylcholine transporter (VAChT) to determine whether the ascending input to these target regions arises from separate groups of brainstem cholinergic and non-cholinergic neurons or results from the collateralization of ascending axons.
Materials and methods
All procedures were conducted in accordance with protocols approved by the Institutional Animal Care and Use Committee (IACUC) at the University of Pittsburgh. Every effort to reduce the number of animals used and to minimize or alleviate pain and suffering was made. All chemicals were purchased from Sigma (St. Louis, MO) unless otherwise noted.
Surgical procedures
Male Sprague–Dawley rats (Hilltop, 250–300 g) were anesthetized with a mixture of ketamine, xylazine and acepromazine (35 mg/kg, 6 mg/kg, 1.2 mg/kg, respectively, i.m.), and placed in a stereotaxic apparatus. Throughout the surgical procedure, body temperature was maintained at 37°C with a heating pad. Supplemental anesthetic was administered when necessary to maintain suppression of the limb withdrawal reflex. Unilateral injections of CTxβ (1% solution, List Laboratories, Campbell, CA) were made in the AT by pressure or iontophoresis at the following co-ordinates, referenced to Bregma: AP −1.8 mm, ML 1.8 mm, DV 5.0–5.2 mm ventral to the surface of the brain. Iontophoretic injections were made using a Midgard constant current source (Stoelting, Wood Dale, IL) set to deliver a pulsed 5 μA current (8 s ON, 8 s OFF) for a total of 5–8 min. Unilateral injections of green fluorescent latex microspheres (Retrobeads™, Lumafluor Inc., Naples, FL, referred to hereafter as Rbeads) were made by pressure into the ipsilateral VTA at the following co-ordinates, with reference to Bregma, and at an angle of 5° from vertical in the mediolateral plane: AP −5.3 to −5.8 mm, ML 1.6–1.8 mm, DV 7.6–7.8 mm from the surface of the brain. A total of ~100 nL of the Rbeads were injected into the VTA. The scalp wound was treated with a topical antibiotic ointment and local anesthetic (xylocaine 2% jelly) and subsequently closed with surgical staples. Rats were administered additional analgesic (ketoprofen, 2 mg/kg, i.m.) and had access to oral acetaminophen solution (3.25 mg/mL) in their food and water during the post-operative recovery period (5–7 days).
Fixation and tissue processing
Rats were deeply anesthetized with sodium pentobarbital (Nembutal, 100 mg/kg, i.p.), and perfused transcardially with ~50 mL of heparin saline (1,000 U/mL), followed by 500 mL of 4% paraformaldehyde containing l-lysine acetate and sodium meta-periodate (PLP fixative, Mclean and Nakane 1974). The brain was removed, cut in the coronal plane into blocks 4–5 mm thick, and post-fixed for 24 h at 4°C.
Blocks through the thalamus, midbrain, and mesopontine tegmentum were rinsed in 0.1 M phosphate buffer (PB) and sectioned to 50 μm. All sections were then treated for 30 min with sodium borohydride (1% in PB) and rinsed extensively in PB.
Visualization of injection sites
CTxβ injections were examined by immunoperoxidase staining for proper placement in the AVN and adequate deposit of tracer. Briefly, sections were rinsed in 0.1 M Trizma buffered saline (TBS) and then treated for 30 min in a blocking solution containing 1% bovine serum albumin (BSA; Spectrum Chemical Corp.) and 0.2% Triton X-100. Sections were then incubated overnight in blocking solution containing primary antibody (goat anti-CTxβ, 1:20,000, List Laboratories). After rinsing several times in TBS, sections were incubated for 30 min in secondary antibody (biotinylated rabbit anti-goat IgG, 1:500, Jackson ImmunoResearch, West Grove, PA). Sections were rinsed again in TBS, and processed for peroxidase staining using the ABC Elite kit (Vector, Burlingame, CA). Peroxidase staining was developed for 3–5 min in 0.022% diaminobenzidine hydrochloride and 0.003% hydrogen peroxide. Reacted sections were rinsed several times in TBS and 0.01 M phosphate buffered saline (PBS) before mounting on glass slides (Superfrost, Fisher, Pittsburgh, PA). Slides were air-dried, dehydrated through a series of increasing ethanol concentrations, soaked in three changes of xylene, and coverslipped with Cytoseal-60 (Richard-Allan Scientific, Kalamazoo, MI).
Due to their intrinsic fluorescence, Rbead injections could be visualized without any histochemical processing. Accordingly, sections through the VTA were rinsed in PBS and mounted directly onto glass slides. Long xylene exposures are detrimental to the fluorescence of the Rbeads (per the manufacturer’s instructions); therefore, these slides were coverslipped immediately with a water-based fluorescence-compatible mounting medium (Fluoromount-G, Southern Biotech, Birmingham, AL).
Dual immunohistochemistry of brainstem sections
In order to identify AT-projecting, VTA-projecting, and cholinergic neuronal populations in the tegmentum, sections through the PPT/LDT of acceptable cases were processed to reveal CTxβ and VAChT immunofluorescence, and examined for each of these markers, as well as for the presence of intrinsically fluorescent Rbeads. A one in six series of sections was used for quantification of these neuronal populations. During all immunohistochemical steps, sections were protected from light exposure to minimize fading of the Rbeads. Briefly, sections were rinsed several times in PBS, and treated for 3 h with a blocking solution containing 5% nonfat dry milk, 0.3% Triton X-100, 0.1% l-lysine acetate and 0.1% glycine. Sections were then incubated in primary antibodies diluted in the same blocking solution for 48 h at 4°C: goat anti-CTxβ (1:10,000) and rabbit anti-VAChT (1:5,000, a generous gift from Dr. Yongjian Liu, University of Pittsburgh). Sections were rinsed extensively in PBS, and incubated overnight at 4°C in fluorescent-tagged secondary antibodies, diluted in blocking solution: Alexa 568 donkey anti-goat IgG and Alexa 647 chicken anti-rabbit IgG (1:500 each, Invitrogen Corp., Carlsbad, CA). All sections were rinsed extensively in PBS, mounted on glass slides, and coverslipped with Fluoromount-G. Slides were protected from ambient light while drying and prior to microscopic examination.
Identification of labeled neurons
Sections were examined on an Olympus BX51 microscope (Olympus, Center Valley, PA) equipped with a mercury arc illumination source (EXFO America, Inc., Plano, TX) a CCD camera (Hamamatsu, Sewickley, PA), and image acquisition software (SimplePCi, Hamamatsu). Sections were first photographed at 4× magnification under illumination for Alexa 647/VAChT. This allowed the visualization of the cholinergic cell populations in the brainstem and appropriate selection of regions for further examination at high magnification using triple immunofluorescence. Fields adjacent to the PPT/LDT that contained no VAChT-labeled cells were excluded.
Three-channel fluorescence images were then acquired at 20× magnification, using the following filter sets (Chroma Technology Corp., Bellows Falls, VT): (1) red channel: Alexa 568 (CTxβ labeled, AT-projecting neurons), excitation (ex), 555/28 nm and emission (em), 617/73 nm; (2) green channel: Rbeads (VTA-projecting neurons), ex, 490/20 nm and em, 528/38 nm; (3) blue channel: Alexa 647 (VAChT-immunoreactive neurons, VAChT-ir), ex, 635/20 nm and em, 685/40 nm. Exposure and gain settings were adjusted in the blue channel to maximize signal without saturation; subsequently, the other channels were adjusted to yield equivalent minimum fluorescence values (i.e. equivalent background fluorescence). Three-channel RGB images were saved as TIF files. Finally, for each XY location on a section, images were collected from all focal planes that contained unique instances of labeled cells.
All TIF files were examined in Adobe Photoshop (Adobe, San Jose, CA). For each image, the total number of labeled neurons in each channel was recorded. In addition to using specific fluorescence channels to identify labeled neurons, the texture of cellular staining was helpful in identifying true labeling and excluding the possibility of cross-channel excitation. Furthermore, neurons labeled in more than one channel were classified as belonging to one of the following groups: (1) collateralized, cholinergic (CTxβ+ Rbead+ VAChT+); (2) collateralized, non-cholinergic (CTxβ+ Rbead+ VAChT−); (3) cholinergic, AT-projecting only (CTxβ+ Rbead− VAChT+); or (4) cholinergic, VTA-projecting only (CTxβ− Rbead+ VAChT+). Tallies of these cell populations were made using Microsoft Excel (Microsoft, Redmond, WA). Finally, we examined multiple focal planes at each xy location within a section, to ensure that all labeled cells were counted once and only once. The examination of multiple focal planes was also useful in distinguishing true instances of retrograde labeling from tissue autofluorescence (particularly in the green Retrobead fluorescence channel) or other artifactual fluorescence signal.
Tables were prepared using Microsoft Excel. Figures were prepared using either Adobe Photoshop or GNU Image Manipulation Program (GIMP, v 2.6.8, available at http://www.gimp.org) to adjust brightness and contrast and to add figure labels. The Online Resources 1 and 2 were prepared using ImageJ to create a 3D projection image of all focal planes at a given xy location that was subsequently flattened. These flattened projections were then aligned in a single montage using GIMP.
Results
Injection sites
Seven cases resulted in acceptable tracer injections for both the AT and VTA targets. An additional case (Case 35) was examined to contrast the pattern of afferent labeling to the medial thalamic paratenial nucleus (PT) with that observed after injections that targeted the more lateral AT.
Figure 1 shows representative injections of both CTxβ (a) and Rbeads (b) from Case 34. Immunoperoxidase for CTxβ typically filled the anterodorsal (AD) and anteroventral nuclei, with additional reaction product evident in the anteromedial (AM) nucleus and intralaminar paracentral nucleus (PC). Much of the reaction product in the PC was contained within retrogradely labeled cells, and punctate processes having the appearance of axon terminals suggested a degree of anterograde transport from the injection site as well (Fig. 1a, inset). Anterogradely transported CTxβ was also present in the contralateral AVN. These observations may be explained by inclusion of the anteromedial most portion of the reticular thalamic nucleus in the injection site (Gonzalo-Ruiz and Lieberman 1995; Kolmac and Mitrofanis 1998). It is possible that the CTxβ itself spread to the ipsilateral AM, given that diffuse reaction product was also apparent in the neuropil, similar to what is visible within the AVN at the core of the injection site.
Fig. 1.
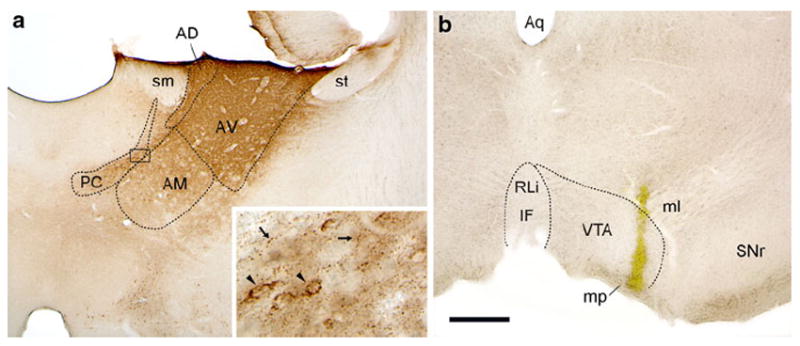
Representative CTxβ injection in the anterior thalamus (a) and Rbead injection in the VTA (b) from Case 34. Immunoperoxidase staining for CTxβ shows that the tracer diffused from the center of the injection to fill the AVN. Additional tracer spread was evident in the adjacent AD, AM, and paracentral nucleus (PC). Peroxidase product was also observed in midline and intralaminar nuclei (inset the black box in a indicates the region shown at higher magnification). The punctate appearance of this labeling (small arrows) suggests that it represents anterograde transport. Retrograde labeling of cell soma (arrowheads) was also visible in these areas. The Rbead deposit (b) involved primarily the lateral VTA near the edge of the medial lemniscus (ml) and just above the mammillary peduncle (mp). PC paracentral nucleus, sm stria medullaris, st stria terminalis. Scale bar represents 500 μm in a and b, 50 μm in inset
The size and placement of CTxβ and Rbead injection sites for all cases are illustrated in Figs. 2 and 3. For ease of display, we grouped these cases by the extent of CTxβ spread to thalamic structures medial to the anterior nuclei. As shown in Fig. 2, Cases 25, 27, and 34 had injections of CTxβ that were predominantly restricted to the AVN, AD, and AM. The remaining cases had larger injections (Fig. 3) that typically filled both the AVN and AM, with additional spread of CTxβ in some cases laterally to the ventral nuclei, or medially to midline/intralaminar nuclei: paracentral (PC), centrolateral (CL), or lateral division of the mediodorsal (MD). Following our initial observations of the AT cases, an additional case (Case 35; Fig. 2) was generated, with the CTxβ injection centered on the PT nucleus and some tracer spread to the most rostral portions of the MD and PC thalamic nuclei. This additional case allowed for some degree of comparison, albeit limited, of the extent of collateralization between the VTA and a limbic thalamic division whose cortical and subcortical projections overlap those of the VTA DA system (e.g., the nucleus accumbens) (Beckstead et al. 1979; Giménez-Amaya et al. 1995; Erro et al. 1999; Vertes and Hoover 2008).
Fig. 2.
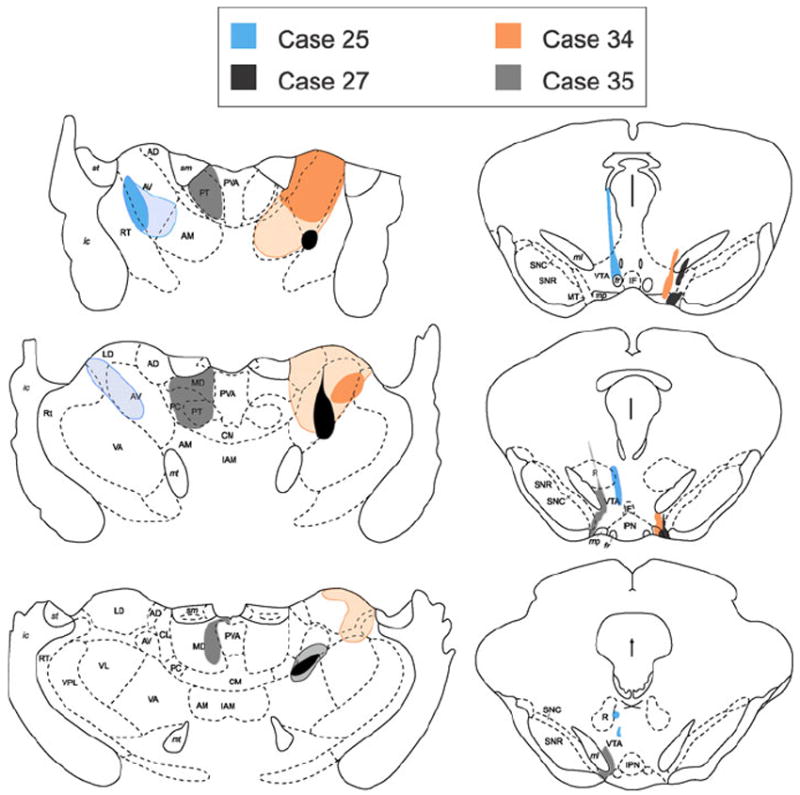
Illustration of the extent of CTxβ injections in the AVN (left panels) and Rbead injections in the VTA (right panels) for three cases in which the thalamic injections were well restricted within the anterior thalamic group (AD, AV, AM and LD), with minimal, or no spread to the midline and intralaminar nuclei (PC, PT, MD, CL, CM). The solid areas show the core of the injections, where CTxβ immunoreactivity was most dense. Hatched regions demarcate the extent of diffusion of CTxβ observed in adjacent regions. An additional control (Case 35) is shown in which the thalamic injection centered on the paratenial nucleus (PT) and did not spread laterally into the AV. Drawings are adapted from Paxinos and Watson (1997)
Fig. 3.
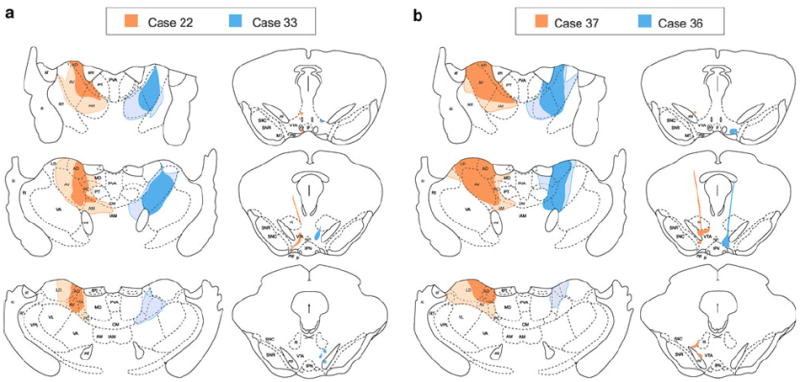
Illustrations depicting CTxβ injections in the AVN (left panels) and Rbead injections in the VTA (right panels) for cases 22 and 33 (a) and cases 36 and 37 (b). As in Fig. 2, the hatched regions show diffusion spread of tracer from the center of the injection represented by the solid regions. Tracer spread was more extensive in these cases, resulting in some involvement of the intralaminar nuclei medial to the AVN. Drawings are adapted from (Paxinos and Watson 1997)
Retrograde transport
The majority of retrogradely labeled neurons observed within the PPT and LDT contained only one retrograde tracer, or were dually labeled for one tracer and for VAChT. Figure 4 shows representative examples of such singly and dually labeled cells intermingled in the same photographic field. Monochrome pseudocolor images from each of the three fluorescence channels acquired at a single location are shown separately alongside a final, merged three-channel image. Although far less numerous then the neurons that contained a single tracer, we did encounter cells that were labeled with both retrograde tracers, with or without coincident VAChT immunoreactivity. Figure 5 shows examples of dual retrograde labeling in a non-VAChT-ir (top panels) and a VAChT-ir (bottom panels) neuron, with each fluorescence channel presented separately in monochrome alongside a final merged pseudo-color image. Readers are further encouraged to examine labeled cells throughout the dorsal LDT in each of the three fluorescence channels separately by downloading Online Resources 1 and 2.
Fig. 4.
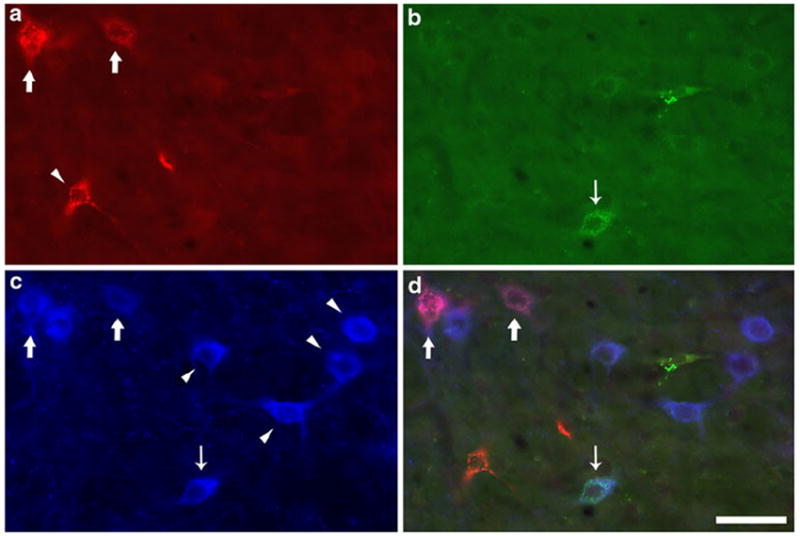
Neurons in the PPT that were retrogradely labeled from the AVN or VTA and singly labeled for tracer or dually labeled for tracer and the vesicular acetylcholine transporter (VAChT). Examination of single channel immunofluorescence identified neurons containing: a CTxβ retrogradely transported from the AVN, b Rbeads transported from the VTA, and c VAChT immunoreactivity. d Merger of the three channels shows colocalization of tracers and VAChT in some neurons; thick arrows indicate VAChT-ir neurons projecting to the AVN, whereas the thin arrow identifies a VTA-projecting, VAChT-ir cell. All other neurons are singly labeled (arrowheads). Although some singly labeled VAChT-ir neurons show a faint cellular fluorescence appears in the green channel (b), this was determined to be artifactual by examination at higher magnification (not shown). Scale bar represents 50 μm in all panels
Fig. 5.
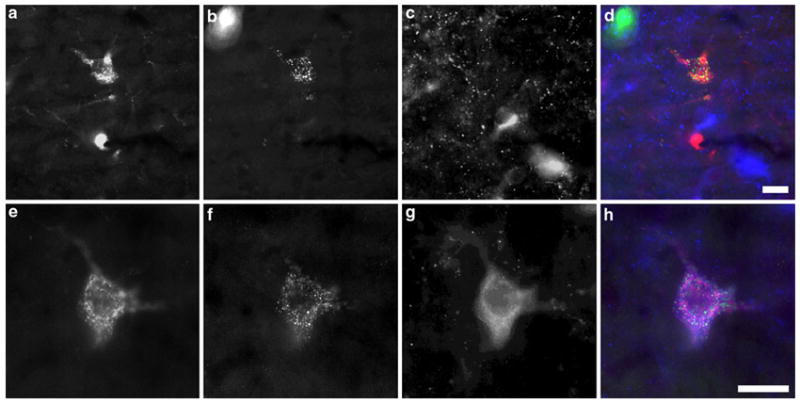
Dual tracer labeled cells in the PPT and LDT. Top panels Triple immunofluorescence from the rostral dorsal LDT revealing a non-cholinergic dual-tracer labeled neuron. CTxβ immunoreactivity (a) and Rbeads (b) are both present in a single neuron. VAChT immunoreactivity (c) is present in nearby cells at a different focal plane, but absent from the dual-tracer labeled neuron. Merger of the single fluorescence channels (d) demonstrates colocalization of CTxβ-ir and Rbeads. Bottom panels A triply labeled neuron in the caudal lateral PPT contains CTxβ-ir (e), Rbeads (f), and VAChT immunoreactivity (g). The merged fluorescence channels (h) demonstrate the distinct visual textures of the three markers used, reducing the chance of false positive labeling due to cross-channel bleed-through. Scale bar equals 20 μm in all panels
Tallies of the labeled neurons observed within each fluorescence channel (i.e., CTxβ+, Rbead+, or VAChT+) are presented in Table 1. The total number of cells recorded for each case is shown, along with the number that contained only a single marker (denoted in parentheses). The right half of Table 1 further denotes the number of each subtype of dual or triple labeled neurons encountered.
Table 1.
Retrograde tracer labeling and VAChT immunoreactivity in rat PPT/LDT neurons
| A. Total number of neurons labeled for
|
B. Subsets of neurons labeled for
|
||||||
|---|---|---|---|---|---|---|---|
| Case | CTxβ | Rbeads | VAChT | CTxβ+ Rbeads+ VAChT− | CTxβ+ Rbeads− VAChT+ | CTxβ− Rbeads+ VAChT+ | CTxβ+ Rbeads+ VAChT+ |
| CTxβ in AVN | |||||||
| 22 | 210 (111)a | 161 (77) | 1,178 (1,000) | 0 | 94 | 79 | 5 |
| 25 | 46 (6) | 156 (62) | 1,108 (977) | 0 | 37 | 91 | 3 |
| 27 | 9 (1) | 56 (40) | 794 (770) | 0 | 8 | 16 | 0 |
| 33 | 261 (61) | 163 (86) | 1,398 (1,133) | 5 | 193 | 70 | 2 |
| 34 | 260 (107) | 201 (155) | 1,239 (1,055) | 5 | 143 | 36 | 5 |
| 36 | 179 (75) | 111 (63) | 836 (688) | 1 | 101 | 45 | 2 |
| 37 | 216 (86) | 179 (87) | 1,154 (945) | 4 | 121 | 83 | 5 |
| CTxβ in PT | |||||||
| 35 | 179 (49) | 267 (166) | 874 (751) | 18 | 40 | 72 | 11 |
Numbers in parentheses denote the total number of neurons that were labeled for only a single marker
In general, smaller thalamic injections, such as occurred in cases 25 and 27, produced fewer CTxβ immunopositive cells (9 and 46 CTxβ labeled neurons in the aforementioned respective cases, versus ~200+ CTxβ-ir cells in cases with larger thalamic injections). The number of Rbead labeled neurons observed was more consistent across cases, most likely due to the similar size of Rbead injections. Strikingly few neurons were found to contain both retrograde tracers in any of the AT cases examined (≤10, with some cases containing no neurons labeled from both regions), regardless of whether these neurons were VAChT-ir. In contrast, 29 neurons contained both tracers in Case 35, which paired a VTA Rbead injection with a CTxβ injection in the PT.
There was no apparent segregation of CTxβ-labeled versus Rbead-labeled neurons within the confines of the PPT or LDT, as shown in Online Resources 1 and 2, and depicted schematically in Fig. 6. Rather, both non-cholinergic and cholinergic afferents to both regions appeared to be distributed somewhat homogenously throughout these brainstem tegmental nuclei, with the non-VAChT-ir and VAChT-ir afferent populations intermingled with each other, and with singly labeled VAChT-ir neurons (not depicted schematically, but see blue cells in Online Resources 1 and 2). An exception to this apparent lack of topographical organization may exist at the most rostral levels of the PPT where Rbead labeled neurons were exclusively VAChT immunonegative, at least in the case shown here. These afferents may be drawn from a recently described cluster of GABAergic neurons at the rostral pole of the PPT (Mena-Segovia et al. 2009), but identification of the neurochemical phenotypes of non-cholinergic AT and VTA afferents awaits further experimentation.
Fig. 6.

Schematic representation of the spatial distribution of retrogradely labeled neurons within selected sections through the brain-stem tegmentum from Case 33. Panels are presented from most rostral to most caudal (a–f, respectively). CTxβ-ir (red symbols) and Rbead-labeled cells (green symbols) were found at similar rostrocaudal levels throughout the PPT and LDT, and were intermingled within these nuclei on both the ipsilateral (right) and contralateral (left) sides. The subset of afferents that were also VAChT-ir (red or green symbols with blue interiors) was similarly mixed, although cells labeled for both CTxβ and VAChT in this case were observed further rostrally than the Rbead+ VAChT-labeled neurons (as in panel a). For clarity, singly labeled VAChT-ir neurons are not depicted. To conserve space, three additional sections from this case were likewise omitted, but these displayed distributions of cells similar to those shown here
The distribution of retrogradely labeled neurons to either the PPT or LDT following injections in the thalamus and VTA is summarized in Table 2. The percentage of each afferent population (CTxβ-labeled or Rbead-labeled) observed in each subdivision of the mesopontine tegmentum across hemispheres (i.e., ipsilateral PPT, etc.) is shown for each case. AT injections resulted in preferential labeling of ipsilateral neurons, and in most cases the majority of CTxβ-labeled cells were found in the LDT. Neurons labeled from VTA Rbead injections were also more likely to be found on the ipsilateral side and were slightly more commonly observed in the LDT. In contrast, cells labeled with CTxβ following the control injection in the PT nucleus were more evenly distributed across hemispheres and subregions. VAChT-ir neurons were also evenly distributed to the ipsilateral and contralateral sides (53 vs. 47%, respectively, data not shown), allowing us to dismiss our concerns that the laterality we observed for retrograde transport from the AT and VTA resulted from uneven representation of hemispheres in our sample.
Table 2.
Distribution of retrogradely labeled neurons by tegmental subregion and hemisphere
| Case | Cells with CTxβ
|
Cells with Rbeads
|
||||||
|---|---|---|---|---|---|---|---|---|
| PPT
|
LDT
|
PPT
|
LDT
|
|||||
| Ipsi | Contra | Ipsi | Contra | Ipsi | Contra | Ipsi | Contra | |
| CTxβ in AVN | ||||||||
| 22 | 38 | 15 | 38 | 10 | 24 | 13 | 39 | 25 |
| 25 | 13 | 4 | 63 | 20 | 19 | 19 | 45 | 17 |
| 27 | 11 | 0 | 78 | 11 | 34 | 2 | 55 | 9 |
| 33 | 42 | 12 | 30 | 16 | 41 | 12 | 29 | 18 |
| 34 | 20 | 7 | 48 | 24 | 20 | 5 | 58 | 17 |
| 36 | 28 | 8 | 45 | 19 | 27 | 16 | 33 | 23 |
| 37 | 31 | 18 | 31 | 20 | 40 | 30 | 20 | 10 |
| Average all AVN cases | ||||||||
| 26 | 9 | 48 | 17 | 29 | 14 | 40 | 17 | |
| CTxβ in PT | ||||||||
| 35 | 31 | 27 | 27 | 14 | 45 | 26 | 24 | 6 |
Values are expressed in %
VAChT-ir of retrogradely labeled populations
The percentage of retrogradely labeled neurons that were VAChT-ir, shown in Table 3, ranged from 47 to 89% for the AT-projecting population. Nearly all injections involving the AT labeled more VAChT-ir than non-VAChT-ir cells in the PPT/LDT. Qualitatively, the smaller, more discrete AT injections (e.g., Cases 25 and 27) resulted in retrograde transport by predominantly VAChT-ir afferents, while lower percentages were observed following larger injections of CTxβ that spread to other structures. In contrast to the AT cases, injection of CTxβ into the PT resulted in substantially more labeling of non-VAChT-ir neurons, with VAChT-ir detected in only 28% of cells retrogradely labeled from the PT.
Table 3.
Proportion of retrogradely labeled neurons in the rat PPT/LDT that are VAChT-ir
| Case | CTxβ + VAChT/(CTxβ) | Rbeads + VAChT/(Rbeads) |
|---|---|---|
| CTxβ in AVN | ||
| 22 | 47.1 | 52.2 |
| 25 | 87.0 | 60.3 |
| 27 | 88.9 | 28.6 |
| 33 | 74.7 | 44.2 |
| 34 | 56.5 | 20.4 |
| 36 | 57.5 | 42.3 |
| 37 | 58.3 | 49.2 |
| Average all AVN cases | ||
| 67.2 | 42.4 | |
| CTxβ in PT | ||
| 35 | 28.5 | 31.1 |
Values are expressed in %
The contribution of VAChT-ir neurons to the mesopontine projection to the VTA was variable and ranged from ~20–60% with an average of about 40% (Table 3). It appeared that a smaller percentage of afferents were VAChT-ir in cases that had Rbeads injected into the lateral portions of the VTA (e.g., Cases 27, 34, and 35 all showed VAChT immunoreactivity in ~30% or less of the Rbead labeled cells). Conversely, the more medially placed injections, such as those in the remaining cases, resulted in relatively greater labeling of VAChT-ir afferents (44–60%).
Collateralization of ascending axons from the mesopontine tegmentum
The extent of axon collateralization (i.e., colocalization of both retrograde tracers) of brainstem tegmentum cells observed following our tracer injections was subsequently examined. As shown in Table 4, few PPT/LDT neurons (<5%) with projections to either region exhibited evidence of branching to the other target area. This was true for both VAChT-ir and non-VAChT-ir populations of mesopontine tegmental cells. A greater percentage of the tegmental neurons retrogradely labeled from the PT also contained Rbeads from the VTA and vice versa (~11–16%). Again, this greater degree of dual labeling was similar for both VAChT-ir and non-VAChT-ir populations, although the percentage of afferents that showed evidence of collateralized projections was somewhat higher for VAChT-ir neurons (13–21 vs. 10–14% for non-VAChT-ir afferents).
Table 4.
Proportion of retrogradely labeled PPT/LDT neurons that project to thalamus and VTA
| Case | All retrogradely labeled neurons
|
Non-VAChT-ir
|
VAChT-ir
|
|||
|---|---|---|---|---|---|---|
| CTxβ + Rbeads/(CTxβ) | Rbeads + CTxβ/(Rbeads) | CTxβ + Rbeads/(CTxβ) | Rbeads + CTxβ/(Rbeads) | CTxβ + Rbeads/(CTxβ) | Rbeads + CTxβ/(Rbeads) | |
| CTxβ in AVN | ||||||
| 22 | 2.4 | 3.1 | 0.0 | 0.0 | 5.1 | 6.0 |
| 25 | 6.5 | 1.9 | 0.0 | 0.0 | 7.5 | 3.2 |
| 27 | 0.0 | 0.0 | 0.0 | 0.0 | 0.0 | 0.0 |
| 33 | 2.7 | 4.3 | 7.6 | 5.5 | 1.0 | 2.8 |
| 34 | 4.0 | 5.3 | 4.5 | 3.1 | 3.4 | 12.2 |
| 36 | 1.7 | 2.7 | 1.3 | 1.6 | 1.9 | 4.3 |
| 37 | 4.2 | 5.0 | 4.4 | 4.4 | 4.0 | 5.7 |
| Average all AVN cases | ||||||
| 3.1 | 3.2 | 2.5 | 2.1 | 3.3 | 4.9 | |
| CTxβ in PT | ||||||
| 35 | 16.2 | 10.9 | 14.1 | 9.8 | 21.6 | 13.3 |
Values are expressed in %
Discussion
The results of our study, that the cholinergic innervation of the AT and the VTA arises from largely separate populations of PPT/LDT neurons, suggests a heretofore unappreciated level of functional organization in the ascending projections of the mesopontine cholinergic neurons, as well as those of the non-cholinergic cells in these regions. This novel report of relative infrequent collateralization in these afferent populations suggests that the ascending reticular activating system maintains distinct projections to functionally segregated limbic forebrain structures.
Methodological considerations
Tract-tracing agents
Neuronal tract-tracing studies are limited by the specificity of the tracer used, as well as by the placement and size of the injection. Non-specific uptake by axons traversing but not synapsing within a brain region (i.e., fibers of passage) can result in labeling of neurons that are not true afferents of the target brain region. Such uptake by fibers-of-passage is a recognized drawback to the use of CTxβ as a tracing agent (Chen and Aston-Jones 1995), but was not of paramount concern in this study. The cholinergic afferents to the AVN are assumed to terminate in this region, as there is extensive arborization of cholinergic axons present here and these nuclei form the most anterior pole of the thalamus. As there are no nuclei anterior to the AVN to which axons traversing this region could be directed, the CTxβ-labeled population was unlikely to have been unduly affected by the fiber-of-passage problem. CTxβ can also be transported both retrogradely and anterogradely, especially when deposits are made by pressure injection (Luppi et al. 1990). Fortunately, anterograde and retrograde labeling are easily distinguished based on the size and appearance of labeled structures (e.g., cell body vs. axon terminal), eliminating the need to utilize strictly unidirectional tracers in the present study. However, anterograde transport of CTxβ may have complicated the delineation of the extent of tracer diffusion from the core of the injections (see Fig. 1a), making the injection sites appear to be larger than they actually were.
In contrast to the AVN, the VTA is traversed by many axons originating in the tegmentum that ultimately target brain regions that lie anterior to the VTA. For this reason, we chose to use Rbeads as the retrograde tracer for this region, as the beads demonstrate little to no uptake by fibers of passage (Katz et al. 1984; Cornwall and Phillipson 1988; Schofield 2008). Unfortunately, the specificity of uptake is gained at the expense of complete labeling of afferents, as the beads do not diffuse far from the injection site. Based on the size of our injections, it is reasonable to conclude that we labeled only a portion of the afferents to the VTA, and therefore our estimates of the collateralization of AVN and VTA afferents should be viewed as a minimum estimate of the true rate of collateralization. However, it should be noted that the pattern of retrograde labeling and the percentage of VTA afferents that were dually labeled for VAChT in the present study was generally in agreement with previous studies that have utilized FluoroGold as a tracing agent (Oakman et al. 1995; Holmstrand and Sesack 2004).
The detection of Rbeads in afferents to the VTA was complicated by a faint tissue fluorescence that was sometimes observed in the green channel (visible in Fig. 4b). This was not considered to be true labeling, as it was easily distinguished from the much brighter fluorescence signal emitted by the Rbeads. Furthermore, we examined such faintly fluorescent cells at higher magnification to rule out light labeling with Rbeads (not shown) and were satisfied that this low-level fluorescence arose from tissue autofluorescence. Although we uniformly applied this exclusion approach across cases, and are confident in our conclusion that these neurons were not labeled with Rbeads, we acknowledge that it is possible that we may have excluded some lightly labeled neurons, and thus underestimated the size of the afferent population to the VTA.
Placement of injections and retrograde transport
The CTxβ injections in the AT cases were centered on the AVN, and this tracer was generally well-contained within the confines of the anterior thalamic group. Furthermore, the pattern of retrograde labeling that we observed with these injections is consistent with prior investigations in that injections that were confined to the AVN resulted in heavy ipsilateral labeling of predominantly cholinergic cells in the mesopontine tegmentum (Sofroniew et al. 1985; Gonzalo-Ruiz et al. 1995). Although these authors reported higher percentages of labeled neurons with cholinergic phenotype, such differences are most likely explained by the spread of tracer to adjacent medial thalamic regions in the present study. Importantly, we noted that our most restricted cases showed a similarly high percentage of brainstem afferents that were also immunoreactive for VAChT (88%) as prior studies.
The placement of the Rbead injections in the VTA primarily involved the paranigral and parabrachial subdivisions and not the midline regions [e.g., rostrolinear (RLi) or intrafascicular (IF) nuclei]. These midline areas differ from the more lateral portions of VTA in that non-dopamine neurons are the predominant cell type (McRitchie et al. 1996), and efferents from these regions target only a subset of forebrain areas that are known to receive VTA projections. Strikingly, RLi neurons project only meagerly, or not at all, to classical VTA targets such as the nucleus accumbens and prefrontal cortex (Del-Fava et al. 2007). With regard to afferent input, the medial regions are similar to the parabrachial and paranigral divisions (Geisler and Zahm 2005), and the density of cholinergic fibers is qualitatively equivalent across subregions of the VTA (Satoh and Fibiger 1986; Ichikawa et al. 1997; Omelchenko and Sesack 2006). Based on the similarities of afferent input to the different regions of the VTA, we assumed that similar results would be obtained from dual tract-tracing involving the AVN and the midline divisions of the VTA. However, our qualitative observation that the more laterally situated Rbead injections labeled greater numbers of non-VAChT-ir cells in the mesopontine tegmentum (compared to the medial and/or dorsal placements of this tracer), and the reported topographical differences in projections arising from the most medial divisions of VTA, indicate that direct experimentation will be necessary to test this assumption.
Finally, we observed a markedly higher proportion of collateralization following the control injection into the PT, demonstrating that the relatively small size of VTA Rbead injections did not artificially limit detection of collateralized afferents. While our results should be interpreted with caution due to these technical limitations, we feel that these findings are still representative of the true organization of PPT/LDT cholinergic forebrain projections.
Antibody specificity
A final limitation of our methodology concerns the use of antibodies to detect relevant proteins in the PPT/LDT neuronal population. All immunohistochemical studies are limited by the specificity of the antibodies used, by the potential for cross-reaction of secondary antibodies, and by the ability of reagents to penetrate the relevant structures in order to bind to their target epitopes. The use of Rbeads, which do not require immunohistochemical detection, helped to limit possible cross-reactivity and false-colocalization, and facilitated the selection of appropriate antibody complexes to detect the presence of VAChT and/or CTxβ. The goat anti-CTxβ antibody has been characterized previously (Angelucci et al. 1996; Pakan et al. 2008; Xu et al. 2009). Evidence for the specificity of this antibody includes the labeling of a single band of cholera toxin subunit B by Western blot (Xu et al. 2009), labeling in expected brain regions following injection of tracer, and the absence of immunoreactivity in uninjected controls. The rabbit anti-VAChT antibody has been previously shown to specifically label cells transfected with VAChT, but not the vesicular monoamine transporter (Liu and Edwards 1997), and the pattern of immunoreactivity obtained in our experiments was consistent with the known distribution of cholinergic neurons and axon terminals in the rat CNS.
Mesopontine projections to the AT or VTA
In general, the pattern of retrograde labeling, and the contribution of cholinergic neurons to each afferent population that we observed with CTxβ or with Rbeads was consistent with prior reports from our laboratory, as well as with work from other groups (Shibata 1992; Gonzalo-Ruiz et al. 1995; Oakman et al. 1995; Holmstrand and Sesack 2004; Geisler and Zahm 2005). The percentage of Rbead-labeled neurons that were also VAChT-ir was somewhat higher in the present study (~20–60%) than in a previous preliminary report from our laboratory (~25%) (Holmstrand and Sesack 2004), perhaps due to inadequate labeling of the entire population of VTA afferents. It should be noted, however, that the larger FluoroGold tracer injections in those prior experiments may have resulted in uptake by fibers-of-passage (Dado et al. 1990; Holmstrand and Sesack, unpublished observations). Consequently, we felt that underestimating the total population of afferents to the VTA was preferable to the inclusion of spurious labeling from non-specific uptake.
Comparison of target connectivity: diversity in limbic structures
Although both the AT and the VTA are considered to be components of the limbic system, the anatomical connections of these individual nuclei are largely exclusive of each other. The segregation of anatomical connections of the VTA and the AVN therefore indicate that there are likely to be separate circuits operating within the broader limbic system (Vertes 2006). At least two of these might include: (1) a prefrontal–accumbens–ventral pallidal–thalamic circuit that is heavily influenced by dopaminergic projections from the midbrain VTA and SNc; and (2) a circuit involving the AVN, the retrosplenial cortex, hippocampal structures, the mammillary body and other hypothalamic nuclei, that is not a significant target of mesocorticolimbic DA projections (Domesick 1969; Hökfelt et al. 1974; Lindvall et al. 1974; Niimi et al. 1978; Swanson 1982; Reep 1984; Berger et al. 1991; Melchitzky et al. 2006; Garcia-Cabezas et al. 2009; Shibata et al. 2009; Aggleton et al. 2010; Sesack and Grace 2010). Interestingly, our results indicate that these distinct circuits receive specifically targeted cholinergic and non-cholinergic innervation from largely separate neurons in the PPT/LDT. The finding that >20% of the cholinergic afferents to the PT showed evidence of sending a collateral projection to the VTA, combined with prior studies demonstrating collateralization of brainstem inputs to the VTA and mediodorsal, parafascicular, and midline thalamic nuclei (Bolton et al. 1993), implies that components of the same circuit receive coordinated cholinergic modulation from the brainstem. The presence of collateralized projections from non-cholinergic PPT/LDT neurons suggests that glutamatergic or GABAergic projections from these regions (Wang and Morales 2009) may have a similarly structured organization.
The restriction of projections to and from the AVN to distinct cortical and subcortical regions with poor dopamine innervation may be a species-specific phenomenon. In both cats and primates, AVN neurons have an expanded projection field that includes the anterior cingulate cortex (Niimi et al. 1978; Barbas et al. 1991), and possibly the ventral striatum as well (Giménez-Amaya et al. 1995). Furthermore, dopamine innervation of thalamic nuclei is markedly expanded in primates beyond the restricted projections to the mediodorsal nucleus observed in rodents (Melchitzky et al. 2006; Garcia-Cabezas et al. 2009). Given the specific organization of collateralized PPT/LDT projections to functionally related thalamic and subcortical nuclei, these relationships need to be examined in higher mammals as well as in rodents, to determine whether the expansion of overlapping limbic projections is accompanied by increased collateralization of brainstem cholinergic and non-cholinergic afferents.
Sub-populations of brainstem cholinergic neurons: functional implications
Our previous investigation of the cholinergic axons innervating the AVN and the VTA indicated that afferents to the AVN display greater total immunoreactivity for CHT compared to VTA axon terminals, and that the density of transporters associated with the plasma membrane is greater in the AVN as well (Holmstrand et al. 2010). We recognized that these differences in CHT membrane density might reflect the innervation of the two regions by distinct subsets of cholinergic cells that express different levels of CHT mRNA and protein. Given that CHT is delivered to the plasma membrane through the fusion of synaptic vesicles during neuronal activity (Ferguson et al. 2003), our findings of predominantly discrete PPT/LDT innervation of the AVN and VTA suggest that the afferent populations to each region might show differences in activity as well, resulting in the regional differences of membrane-associated CHT immunoreactivity (Holmstrand et al. 2010).
Variations in the basal activity of PPT and LDT neurons have been reported (Steriade et al. 1990a; Pascoe and Kapp 1993; Datta and Siwek 2002), although direct electro-physiological evidence of differences between the AVN-and VTA-projecting populations has yet to be reported. In addition, both cholinergic and non-cholinergic PPT/LDT neurons display several distinct types of physiological responses to afferent input, and across the sleep–wake cycle (Steriade et al. 1990a; Datta and Siwek 2002). While it is generally held that cholinergic neurons in the PPT and LDT are excited by early ascending sensory input (Sanders et al. 1980; Grant and Highfield 1991; Pascoe and Kapp 1993; Boucetta and Jones 2009), some cells are inhibited by sensory stimulation (Koyama et al. 1994; Krauthamer et al. 1995). Furthermore, neurons in these regions may respond to only one type of sensory information, or to multiple modalities (Pan and Hyland 2005). Similarly, most tegmental cholinergic neurons have higher firing rates during wakefulness and REM sleep, but others show more complex physiological responses, including an absence of any changes across the sleep–wake cycle (Steriade et al. 1990a; Steriade et al. 1990b; Datta and Siwek 2002). Due to the variety of responses and the overlap of cholinergic and non-cholinergic neurons across categories, the correlation of specific physiological profile, afferent input, and projections of mesopontine tegmental neurons remains a crucial challenge to our understanding of the role of cholinergic and non-cholinergic modulation arising from these regions in shaping forebrain function.
Despite the heterogeneity of the component cells of the PPT and LDT, it is not clear whether segregated ascending afferent populations can be differentially activated, resulting in increased ACh release in some forebrain areas but not others, or if they are more likely to be activated or inhibited en masse. Furthermore, PPT and LDT neurons innervate each other bilaterally (Satoh and Fibiger 1986; Cornwall et al. 1990), suggesting that the activity of the entire population might be coordinated. However, the predominant effect of ACh on PPT/LDT neurons is inhibitory (Leonard and Llinas 1994), allowing for the possibility that increased activity in one sub-population could dampen the responses of other PPT/LDT neurons that project to different forebrain regions. These questions require a more detailed understanding of the microcircuitry contained within these regions.
A clearer understanding of the organization and function of the PPT and LDT will also aid our understanding of human health and disease. PPT/LDT pathology has been noted in the brains of patients suffering from some neurodegenerative diseases (Hirsch et al. 1987; Halliday et al. 1990; Jellinger 1991; Emre 2003; Schmeichel et al. 2008), and over the course of normal aging (Zhang et al. 2005). Whether such changes are causative or merely symptomatic of the disease state is still debated (Xuereb et al. 1990). In addition, changes in cell number and cell size have been reported in schizophrenic brains (Karson et al. 1991), and the sleep disruptions that are characteristic of a wide range of mental disorders indicate that the role of PPT/LDT in maintaining normal limbic functions may be underappreciated. The clear identification of distinct physiological roles for PPT/LDT neurons has been elusive despite intense study, partly due to the presence of numerous classes of cells described on the basis of electrophysiological response types (el Mansari et al. 1989; Leonard and Llinás 1990; Steriade et al. 1990b; Datta and Siwek 2002). Further study of the specific connections and phenotypes of these brainstem nuclei may reveal important pathophysiological details and present new targets for therapeutic intervention.
Supplementary Material
Acknowledgments
This work was supported by United States Public Health Service grant MH067937.
Footnotes
Conflict of interest The authors declare that they have no conflicts of interest.
Electronic supplementary material The online version of this article (doi:10.1007/s00429-011-0320-2) contains supplementary material, which is available to authorized users.
Contributor Information
Ericka C. Holmstrand, Department of Neuroscience, University of Pittsburgh, Langley Hall, Room 210, Pittsburgh, PA 15260, USA
Susan R. Sesack, Email: sesack@pitt.edu, Department of Neuroscience, University of Pittsburgh, Langley Hall, Room 210, Pittsburgh, PA 15260, USA, Department of Psychiatry, University of Pittsburgh, Pittsburgh, PA 15260, USA.
References
- Aggleton JP, O’Mara SM, Vann SD, Wright NF, Tsanov M, Erichsen JT. Hippocampal-anterior thalamic pathways for memory: uncovering a network of direct and indirect actions. Eur J Neurosci. 2010;31:2292–2307. doi: 10.1111/j.1460-9568.2010.07251.x. [DOI] [PMC free article] [PubMed] [Google Scholar]
- Angelucci A, Clascá F, Sur M. Anterograde axonal tracing with the subunit B of cholera toxin: a highly sensitive immunohistochemical protocol for revealing fine axonal morphology in adult and neonatal brains. J Neurosci Methods. 1996;65:101–112. doi: 10.1016/0165-0270(95)00155-7. [DOI] [PubMed] [Google Scholar]
- Barbas H, Henion TH, Dermon CR. Diverse thalamic projections to the prefrontal cortex in the rhesus monkey. J Comp Neurol. 1991;313:65–94. doi: 10.1002/cne.903130106. [DOI] [PubMed] [Google Scholar]
- Beckstead RM, Domesick VB, Nauta WJ. Efferent connections of the substantia nigra and ventral tegmental area in the rat. Brain Res. 1979;175:191–217. doi: 10.1016/0006-8993(79)91001-1. [DOI] [PubMed] [Google Scholar]
- Beninato M, Spencer RF. A cholinergic projection to the rat substantia nigra from the pedunculopontine nucleus. Brain Res. 1987;412:169–174. doi: 10.1016/0006-8993(87)91455-7. [DOI] [PubMed] [Google Scholar]
- Berger B, Gaspar P, Verney C. Dopaminergic innervation of the cerebral cortex: unexpected differences between rodents and primates. Trends Neurosci. 1991;14:21–27. doi: 10.1016/0166-2236(91)90179-x. [DOI] [PubMed] [Google Scholar]
- Billet S, Cant NB, Hall WC. Cholinergic projections to the visual thalamus and superior colliculus. Brain Res. 1999;847:121–123. doi: 10.1016/s0006-8993(99)01900-9. [DOI] [PubMed] [Google Scholar]
- Bolton RF, Cornwall J, Phillipson OT. Collateral axons of cholinergic pontine neurones projecting to midline, mediodorsal and parafascicular thalamic nuclei in the rat. J Chem Neuroanat. 1993;6:101–114. doi: 10.1016/0891-0618(93)90031-x. [DOI] [PubMed] [Google Scholar]
- Boucetta S, Jones BE. Activity profiles of cholinergic and intermingled GABAergic and putative glutamatergic neurons in the pontomesencephalic tegmentum of urethane-anesthetized rats. J Neurosci. 2009;29:4664–4674. doi: 10.1523/JNEUROSCI.5502-08.2009. [DOI] [PMC free article] [PubMed] [Google Scholar]
- Chen S, Aston-Jones G. Evidence that cholera toxin B subunit (CTb) can be avidly taken up and transported by fibers of passage. Brain Res. 1995;674:107–111. doi: 10.1016/0006-8993(95)00020-q. [DOI] [PubMed] [Google Scholar]
- Cornwall J, Phillipson O. Quantitative analysis of axonal branching using the retrograde transport of fluorescent latex microspheres. J Neurosci Methods. 1988;24:1–9. doi: 10.1016/0165-0270(88)90028-3. [DOI] [PubMed] [Google Scholar]
- Cornwall J, Phillipson O. Single neurones of the basal forebrain and laterodorsal tegmental nucleus project by collateral axons to the olfactory bulb and the mediodorsal nucleus in the rat. Brain Res. 1989;491:194–198. doi: 10.1016/0006-8993(89)90105-4. [DOI] [PubMed] [Google Scholar]
- Cornwall J, Cooper JD, Phillipson OT. Afferent and efferent connections of the laterodorsal tegmental nucleus in the rat. Brain Res Bull. 1990;25:271–284. doi: 10.1016/0361-9230(90)90072-8. [DOI] [PubMed] [Google Scholar]
- Crawley J, Olschowka J, Diz D, Jacobowitz D. Behavioral significance of the coexistence of substance P, corticotropin releasing factor, and acetylcholinesterase in lateral dorsal tegmental neurons projecting to the medial frontal cortex of the rat. Peptides. 1985;6:891–901. doi: 10.1016/0196-9781(85)90320-1. [DOI] [PubMed] [Google Scholar]
- Dado RJ, Burstein R, Cliffer KD, Giesler GJJ. Evidence that Fluoro-Gold can be transported avidly through fibers of passage. Brain Res. 1990;533:329–333. doi: 10.1016/0006-8993(90)91358-n. [DOI] [PubMed] [Google Scholar]
- Datta S, Siwek DF. Single cell activity patterns of pedunculopontine tegmentum neurons across the sleep–wake cycle in the freely moving rats. J Neurosci Res. 2002;70:611–621. doi: 10.1002/jnr.10405. [DOI] [PubMed] [Google Scholar]
- Del-Fava F, Hasue RH, Ferreira JG, Shammah-Lagnado SJ. Efferent connections of the rostral linear nucleus of the ventral tegmental area in the rat. Neuroscience. 2007;145:1059–1076. doi: 10.1016/j.neuroscience.2006.12.039. [DOI] [PubMed] [Google Scholar]
- Domesick VB. Projections from the cingulate cortex in the rat. Brain Res. 1969;12:296–320. doi: 10.1016/0006-8993(69)90002-x. [DOI] [PubMed] [Google Scholar]
- el Mansari M, Sakai K, Jouvet M. Unitary characteristics of presumptive cholinergic tegmental neurons during the sleep–waking cycle in freely moving cats. Exp Brain Res. 1989;76:519–529. doi: 10.1007/BF00248908. [DOI] [PubMed] [Google Scholar]
- Emre M. What causes mental dysfunction in Parkinson’s disease? Mov Disord. 2003;18:S63–S71. doi: 10.1002/mds.10565. [DOI] [PubMed] [Google Scholar]
- Erro E, Lanciego JL, Giménez-Amaya JM. Relationships between thalamostriatal neurons and pedunculopontine projections to the thalamus: a neuroanatomical tract-tracing study in the rat. Exp Brain Res. 1999;127:162–170. doi: 10.1007/s002210050786. [DOI] [PubMed] [Google Scholar]
- Ferguson S, Savchenko V, Apparsundaram S, Zwick M, Wright J, Heilman C, Yi H, Levey A, Blakely R. Vesicular localization and activity-dependent trafficking of presynaptic choline transporters. J Neurosci. 2003;23:9697–9709. doi: 10.1523/JNEUROSCI.23-30-09697.2003. [DOI] [PMC free article] [PubMed] [Google Scholar]
- Garcia-Cabezas MA, Martinez-Sanchez P, Sanchez-Gonzalez MA, Garzon M, Cavada C. Dopamine innervation in the thalamus: monkey versus rat. Cereb Cortex. 2009;19:424–434. doi: 10.1093/cercor/bhn093. [DOI] [PMC free article] [PubMed] [Google Scholar]
- Geisler S, Zahm DS. Afferents of the ventral tegmental area in the rat-anatomical substratum for integrative functions. J Comp Neurol. 2005;490:270–294. doi: 10.1002/cne.20668. [DOI] [PubMed] [Google Scholar]
- Giménez-Amaya J, McFarland N, de Las Heras S, Haber S. Organization of thalamic projections to the ventral striatum in the primate. J Comp Neurol. 1995;354:127–149. doi: 10.1002/cne.903540109. [DOI] [PubMed] [Google Scholar]
- Gonzalo-Ruiz A, Lieberman AR. GABAergic projections from the reticular nucleus to the anteroventral and anterodorsal thalamic nuclei of the rat. J Chem Neuroanat. 1995;9:165–174. doi: 10.1016/0891-0618(95)00078-x. [DOI] [PubMed] [Google Scholar]
- Gonzalo-Ruiz A, Sanz-Anquela MJ, Lieberman AR. Cholinergic projections to the anterior thalamic nuclei in the rat: a combined retrograde tracing and choline acetyl transferase immunohistochemical study. Anat Embryol. 1995;192:335–349. doi: 10.1007/BF00710103. [DOI] [PubMed] [Google Scholar]
- Grant SJ, Highfield DA. Extracellular characteristics of putative cholinergic neurons in the rat laterodorsal tegmental nucleus. Brain Res. 1991;559:64–74. doi: 10.1016/0006-8993(91)90287-6. [DOI] [PubMed] [Google Scholar]
- Hallanger AE, Wainer BH. Ascending projections from the pedunculopontine tegmental nucleus and the adjacent mesopontine tegmentum in the rat. J Comp Neurol. 1988;274:483–515. doi: 10.1002/cne.902740403. [DOI] [PubMed] [Google Scholar]
- Hallanger AE, Levey AI, Lee HJ, Rye DB, Wainer BH. The origins of cholinergic and other subcortical afferents to the thalamus in the rat. J Comp Neurol. 1987;262:105–124. doi: 10.1002/cne.902620109. [DOI] [PubMed] [Google Scholar]
- Halliday GM, Li YW, Blumbers PC, Joh TH, Cotton RG, Howe PR, Blessing WW, Geffen LB. Neuropathology of immunohistochemically identified brainstem neurons in Parkinson’s disease. Ann Neurol. 1990;27:373–385. doi: 10.1002/ana.410270405. [DOI] [PubMed] [Google Scholar]
- Heckers S, Geula C, Mesulam MM. Cholinergic innervation of the human thalamus: dual origin and differential nuclear distribution. J Comp Neurol. 1992;325:68–82. doi: 10.1002/cne.903250107. [DOI] [PubMed] [Google Scholar]
- Hirsch EC, Graybiel AM, Duyckaerts C, Javoy-Agid F. Neuronal loss in the pedunculopontine tegmental nucleus in Parkinson disease and in progressive supranuclear palsy. Proc Natl Acad Sci USA. 1987;84:5976–5980. doi: 10.1073/pnas.84.16.5976. [DOI] [PMC free article] [PubMed] [Google Scholar]
- Hökfelt T, Ljungdahl Å, Fuxe K, Johansson O. Dopamine nerve terminals in the rat limbic cortex: aspects of the dopamine hypothesis of schizophrenia. Science. 1974;184:177–179. doi: 10.1126/science.184.4133.177. [DOI] [PubMed] [Google Scholar]
- Holmstrand EC, Sesack SR. Cholinergic neurons in the rat mesopontine tegmentum comprise about one quarter of the projection to the ventral tegmental area. Society for Neuroscience abstracts. 2004;30 abstract 45.2. [Google Scholar]
- Holmstrand E, Asafu-Adjei J, Sampson A, Blakely R, Sesack S. Ultrastructural localization of high-affinity choline transporter in the rat anteroventral thalamus and ventral tegmental area: differences in axon morphology and transporter distribution. J Comp Neurol. 2010;518:1908–1924. doi: 10.1002/cne.22310. [DOI] [PMC free article] [PubMed] [Google Scholar]
- Ichikawa T, Ajiki K, Matsuura J, Misawa H. Localization of two cholinergic markers, choline acetyltransferase and vesicular acetylcholine transporter in the central nervous system of the rat: in situ hybridization histochemistry and immunohistochemistry. J Chem Neuroanat. 1997;13:23–39. doi: 10.1016/s0891-0618(97)00021-5. [DOI] [PubMed] [Google Scholar]
- Inglis WI, Winn P. The pedunculopontine tegmental nucleus: where the striatum meets the reticular formation. Prog Neurobiol. 1995;47:1–29. doi: 10.1016/0301-0082(95)00013-l. [DOI] [PubMed] [Google Scholar]
- Jellinger KA. Pathology of Parkinson’s disease. Changes other than the nigrostriatal pathway. Mol Chem Neuropathol. 1991;14:153–197. doi: 10.1007/BF03159935. [DOI] [PubMed] [Google Scholar]
- Jones BE, Webster HH. Neurotoxic lesions of the dorsolateral pontomesencephalic tegmentum-cholinergic cell area in the cat. I. Effects upon the cholinergic innervation of the brain. Brain Res. 1988;451:13–32. doi: 10.1016/0006-8993(88)90745-7. [DOI] [PubMed] [Google Scholar]
- Jourdain A, Semba K, Fibiger HC. Basal forebrain and mesopontine tegmental projections to the reticular thalamic nucleus: an axonal collateralization and immunohistochemical study in the rat. Brain Res. 1989;505:55–65. doi: 10.1016/0006-8993(89)90115-7. [DOI] [PubMed] [Google Scholar]
- Karson CN, Garcia-Rill E, Biedermann J, Mrak RE, Husain MM, Skinner RD. The brain stem reticular formation in schizophrenia. Psychiatr Res. 1991;40:31–48. doi: 10.1016/0925-4927(91)90027-n. [DOI] [PubMed] [Google Scholar]
- Katz L, Burkhalter A, Dreyer W. Fluorescent latex microspheres as a retrograde neuronal marker for in vivo and in vitro studies of visual cortex. Nature. 1984;310:498–500. doi: 10.1038/310498a0. [DOI] [PubMed] [Google Scholar]
- Kobayashi Y, Isa T. Sensory-motor gating and cognitive control by the brainstem cholinergic system. Neural Netw. 2002;15:731–741. doi: 10.1016/s0893-6080(02)00059-x. [DOI] [PubMed] [Google Scholar]
- Kolmac C, Mitrofanis J. Patterns of brainstem projection to the thalamic reticular nucleus. J Comp Neurol. 1998;396:531–543. [PubMed] [Google Scholar]
- Koyama Y, Jodo E, Kayama Y. Sensory responsiveness of “broad-spike” neurons in the laterodorsal tegmental nucleus, locus coeruleus and dorsal raphe of awake rats: implication for cholinergic and monoaminergic neuron-specific responses. Neuroscience. 1994;63:1021–1031. doi: 10.1016/0306-4522(94)90569-x. [DOI] [PubMed] [Google Scholar]
- Krauthamer GM, Grunwerg BS, Krein H. Putative cholinergic neurons of the pedunculopontine tegmental nucleus projecting to the superior colliculus consist of sensory responsive and unresponsive populations which are functionally distinct from other mesopontine neurons. Neuroscience. 1995;69:507–517. doi: 10.1016/0306-4522(95)00265-k. [DOI] [PubMed] [Google Scholar]
- Leonard CS, Llinas R. Serotonergic and cholinergic inhibition of mesopontine cholinergic neurons controlling REM sleep: an in vitro electrophysiological study. Neuroscience. 1994;59:309–330. doi: 10.1016/0306-4522(94)90599-1. [DOI] [PubMed] [Google Scholar]
- Leonard CS, Llinás RR. Electrophysiology of mammalian pedunculopontine and laterodorsal tegmental neurons in vitro: Implications for the control of REM sleep. In: Steriade M, Biesold D, editors. Brain cholinergic systems. Oxford University Press; New York: 1990. pp. 205–223. [Google Scholar]
- Lindvall O, Björklund A, Moore R, Stenevi U. Mesencephalic dopamine neurons projecting to neocortex. Brain Res. 1974;81:325–331. doi: 10.1016/0006-8993(74)90947-0. [DOI] [PubMed] [Google Scholar]
- Liu Y, Edwards RH. Differential localization of vesicular acetylcholine and monoamine transporters in PC12 cells but not CHO cells. J Cell Biol. 1997;139:907–916. doi: 10.1083/jcb.139.4.907. [DOI] [PMC free article] [PubMed] [Google Scholar]
- Losier BJ, Semba K. Dual projections of single cholinergic and aminergic brainstem neurons to the thalamus and basal forebrain in the rat. Brain Res. 1993;604:41–52. doi: 10.1016/0006-8993(93)90350-v. [DOI] [PubMed] [Google Scholar]
- Loughlin S, Fallon J. Substantia nigra and ventral tegmental area projections to cortex: topography and collateralization. Neuroscience. 1984;11:425–435. doi: 10.1016/0306-4522(84)90034-4. [DOI] [PubMed] [Google Scholar]
- Luppi P-H, Fort P, Jouvet M. Iontophoretic application of unconjugated cholera toxin B subunit (CTb) combined with immunohistochemistry of neurochemical substances: a method for transmitter identification of retrogradely labeled neurons. Brain Res. 1990;534:209–224. doi: 10.1016/0006-8993(90)90131-t. [DOI] [PubMed] [Google Scholar]
- Mclean IW, Nakane PK. Periodate–lysine–paraformaldehyde fixative. A new fixation for immunoelectron microscopy. J Histochem Cytochem. 1974;22:1077–1083. doi: 10.1177/22.12.1077. [DOI] [PubMed] [Google Scholar]
- McRitchie DA, Hardman CD, Halliday GM. Cytoarchitectural distribution of calcium binding proteins in midbrain dopaminergic regions of rats and humans. J Comp Neurol. 1996;364:121–150. doi: 10.1002/(SICI)1096-9861(19960101)364:1<121::AID-CNE11>3.0.CO;2-1. [DOI] [PubMed] [Google Scholar]
- Melchitzky DS, Erickson SL, Lewis DA. Dopamine innervation of the monkey mediodorsal thalamus: location of projection neurons and ultrastructural characteristics of axon terminals. Neuroscience. 2006;143:1021–1030. doi: 10.1016/j.neuroscience.2006.08.056. [DOI] [PubMed] [Google Scholar]
- Mena-Segovia J, Winn P, Bolam JP. Cholinergic modulation of midbrain dopaminergic systems. Brain Res Rev. 2008;58:265–271. doi: 10.1016/j.brainresrev.2008.02.003. [DOI] [PubMed] [Google Scholar]
- Mena-Segovia J, Micklem BR, Nair-Roberts RG, Ungless MA, Bolam JP. GABAergic neuron distribution in the pedunculopontine nucleus defines functional subterritories. J Comp Neurol. 2009;515:397–408. doi: 10.1002/cne.22065. [DOI] [PubMed] [Google Scholar]
- Mesulam M-M. Structure and function of cholinergic pathways in the cerebral cortex, limbic system, basal ganglia, and thalamus of the human brain. In: Bloom FE, Kupfer DJ, editors. Psychopharmacology: the fourth generation of progress. Raven Press; New York: 1995. [02/02/2011]. http://www.acnp.org/g4/GN401000012/Default.htm. [Google Scholar]
- Mesulam M, Mufson E, Wainer B, Levey A. Central cholinergic pathways in the rat: an overview based on an alternative nomenclature (Ch1–Ch6) Neuroscience. 1983;10:1185–1201. doi: 10.1016/0306-4522(83)90108-2. [DOI] [PubMed] [Google Scholar]
- Niimi K, Niimi M, Okada Y. Thalamic afferents to the limbic cortex in the cat studied with the method of retrograde axonal transport of horseradish peroxidase. Brain Res. 1978;145:225–238. doi: 10.1016/0006-8993(78)90859-4. [DOI] [PubMed] [Google Scholar]
- Oakman S, Faris P, Kerr P, Cozzari C, Hartman B. Distribution of pontomesencephalic cholinergic neurons projecting to substantia nigra differs significantly from those projecting to ventral tegmental area. J Neurosci. 1995;15:5859–5869. doi: 10.1523/JNEUROSCI.15-09-05859.1995. [DOI] [PMC free article] [PubMed] [Google Scholar]
- Omelchenko N, Sesack S. Cholinergic axons in the rat ventral tegmental area synapse preferentially onto mesoaccumbens dopamine neurons. J Comp Neurol. 2006;494:863–875. doi: 10.1002/cne.20852. [DOI] [PMC free article] [PubMed] [Google Scholar]
- Pakan J, Graham D, Iwaniuk A, Wylie D. Differential projections from the vestibular nuclei to the flocculus and uvula-nodulus in pigeons (Columba livia) J Comp Neurol. 2008;508:402–417. doi: 10.1002/cne.21623. [DOI] [PubMed] [Google Scholar]
- Pan W, Hyland B. Pedunculopontine tegmental nucleus controls conditioned responses of midbrain dopamine neurons in behaving rats. J Neurosci. 2005;25:4725–4732. doi: 10.1523/JNEUROSCI.0277-05.2005. [DOI] [PMC free article] [PubMed] [Google Scholar]
- Pascoe JP, Kapp BS. Electrophysiology of the dorsolateral mesopontine reticular formation during pavlovian conditioning in the rabbit. Neuroscience. 1993;54:753–772. doi: 10.1016/0306-4522(93)90245-b. [DOI] [PubMed] [Google Scholar]
- Paxinos G, Watson C. The rat brain in stereotaxic co-ordinates. 3. Academic Press; San Diego, CA: 1997. [Google Scholar]
- Reep R. Relationship between prefrontal and limbic cortex: a comparative anatomical review. Brain Behav Evol. 1984;25:5–80. doi: 10.1159/000118849. [DOI] [PubMed] [Google Scholar]
- Reese NB, Garcia-Rill E, Skinner RD. The pedunculopontine nucleus—auditory input, arousal and pathophysiology. Prog Neurobiol. 1995;42:105–133. doi: 10.1016/0301-0082(95)00023-o. [DOI] [PubMed] [Google Scholar]
- Sanders KH, Klein CE, Mayer TE, Heym CH, Handwerker HO. Differential effects of noxious and non-noxious input on neurones according to location in ventral periaqueductal grey or dorsal raphe nucleus. Brain Res. 1980;186:83–97. doi: 10.1016/0006-8993(80)90257-7. [DOI] [PubMed] [Google Scholar]
- Satoh K, Fibiger HC. Cholinergic neurons of the laterodorsal tegmental nucleus: efferent and afferent connections. J Comp Neurol. 1986;253:277–302. doi: 10.1002/cne.902530302. [DOI] [PubMed] [Google Scholar]
- Schmeichel AM, Buchhalter LC, Low PA, Parisi JE, Boeve BW, Sandroni P, Benarroch EE. Mesopontine cholinergic neuron involvement in Lewy body dementia and multiple system atrophy. Neurology. 2008;70:368–373. doi: 10.1212/01.wnl.0000298691.71637.96. [DOI] [PubMed] [Google Scholar]
- Schofield BR. Retrograde axonal tracing with fluorescent markers. Curr Prot Neurosci. 2008;43:1–24. doi: 10.1002/0471142301.ns0117s43. [DOI] [PubMed] [Google Scholar]
- Sesack SR, Grace AA. Cortico-basal ganglia reward network: microcircuitry. Neuropsychopharmacology. 2010;35:27–47. doi: 10.1038/npp.2009.93. [DOI] [PMC free article] [PubMed] [Google Scholar]
- Shibata H. Topographic organization of subcortical projections to the anterior thalamic nuclei in the rat. J Comp Neurol. 1992;323:117–127. doi: 10.1002/cne.903230110. [DOI] [PubMed] [Google Scholar]
- Shibata H. Efferent projections from the anterior thalamic nuclei to the cingulate cortex in the rat. J Comp Neurol. 1993;330:533–542. doi: 10.1002/cne.903300409. [DOI] [PubMed] [Google Scholar]
- Shibata H, Kato A. Topographic relationship between anteromedial thalamic nucleus neurons and their cortical terminal fields in the rat. Neurosci Res. 1993;17:63–69. doi: 10.1016/0168-0102(93)90030-t. [DOI] [PubMed] [Google Scholar]
- Shibata H, Honda Y, Sasaki H, Naito J. Organization of intrinsic connections of the retrosplenial cortex in the rat. Anat Sci Int. 2009;84:280–292. doi: 10.1007/s12565-009-0035-0. [DOI] [PubMed] [Google Scholar]
- Smith Y, Raju D, Nanda B, Pare J, Galvan A, Wichmann T. The thalamostriatal systems: anatomical and functional organization in normal and parkinsonian states. Brain Res Bull. 2009;78:60–68. doi: 10.1016/j.brainresbull.2008.08.015. [DOI] [PMC free article] [PubMed] [Google Scholar]
- Sofroniew M, Priestley J, Consolzaione A, Eckenstein F, Cuello A. Cholinergic projections from the midbrain and pons to the thalamus in the rat, identified by combined retrograde tracing and choline acetyltransferase immunohistochemistry. Brain Res. 1985;329:213–223. doi: 10.1016/0006-8993(85)90527-x. [DOI] [PubMed] [Google Scholar]
- Steriade M, Datta S, Paré D, Oakson G, Curró Dossi R. Neuronal activities in brain-stem cholinergic nuclei related to tonic activation processes in thalamocortical systems. J Neurosci. 1990a;10:2541–2559. doi: 10.1523/JNEUROSCI.10-08-02541.1990. [DOI] [PMC free article] [PubMed] [Google Scholar]
- Steriade M, Paré D, Datta S, Oakson G, Curro Dossi R. Different cellular types in mesopontine cholinergic nuclei related to ponto-geniculo-occipital waves. J Neurosci. 1990b;10:2560–2579. doi: 10.1523/JNEUROSCI.10-08-02560.1990. [DOI] [PMC free article] [PubMed] [Google Scholar]
- Swanson LW. The projections of the ventral tegmental area and adjacent regions: a combined fluorescent retrograde tracer and immunofluorescence study in the rat. Brain Res Bull. 1982;9:321–353. doi: 10.1016/0361-9230(82)90145-9. [DOI] [PubMed] [Google Scholar]
- Vertes R. Interactions among the medial prefrontal cortex, hippocampus and midline thalamus in emotional and cognitive processing in the rat. Neuroscience. 2006;142:1–20. doi: 10.1016/j.neuroscience.2006.06.027. [DOI] [PubMed] [Google Scholar]
- Vertes RP, Hoover WB. Projections of the paraventricular and paratenial nuclei of the dorsal midline thalamus in the rat. J Comp Neurol. 2008;508:212–237. doi: 10.1002/cne.21679. [DOI] [PubMed] [Google Scholar]
- Wang HL, Morales M. Pedunculopontine and laterodorsal tegmental nuclei contain distinct populations of cholinergic, glutamatergic and GABAergic neurons in the rat. Eur J Neurosci. 2009;29:340–358. doi: 10.1111/j.1460-9568.2008.06576.x. [DOI] [PMC free article] [PubMed] [Google Scholar]
- Xu L, Ryugo D, Pongstaporn T, Johe K, Koliatsos V. Human neural stem cell grafts in the spinal cord of SOD1 transgenic rats: differentiation and structural integration into the segmental motor circuitry. J Comp Neurol. 2009;514:297–309. doi: 10.1002/cne.22022. [DOI] [PMC free article] [PubMed] [Google Scholar]
- Xuereb JH, Perry EK, Candy JM, Bonham JR, Perry RH, Marshall E. Parameters of cholinergic neurotransmission in the thalamus in Parkinson’s disease and Alzheimer’s disease. J Neurol Sci. 1990;99:185–197. doi: 10.1016/0022-510x(90)90155-g. [DOI] [PubMed] [Google Scholar]
- Yeomans JS. Role of tegmental cholinergic neurons in dopaminergic activation, antimuscarinic psychosis and schizophrenia. Neuropsychopharmacology. 1995;12:3–16. doi: 10.1038/sj.npp.1380235. [DOI] [PubMed] [Google Scholar]
- Zhang J-H, Sampogna S, Morales FR, Chase MH. Age-related changes in cholinergic neurons in the laterodorsal and the pedunculo-pontine tegmental nuclei of cats: a combined light and electron microscopic study. Brain Res. 2005;1052:47–55. doi: 10.1016/j.brainres.2005.06.008. [DOI] [PubMed] [Google Scholar]
Associated Data
This section collects any data citations, data availability statements, or supplementary materials included in this article.