Abstract
Calcium channel blockers including verapamil have been proposed to enhance release and antitumor efficacy of oncolytic adenoviruses in preclinical studies but this has not been studied in humans before. Here, we studied if verapamil leads to increased replication of oncolytic adenovirus in cancer patients, as measured by release of virions from tumor cells into the systemic circulation. The study was conducted as a matched case–control study of advanced cancer patients treated with oncolytic adenoviruses with or without verapamil. We observed that verapamil increased mean virus titers present in blood after treatment (P < 0.05). The frequency or severity of adverse events was not increased, nor were cytokine responses or neutralizing antibody levels different between groups. Signs of possible treatment-related clinical benefits were observed in both groups, but there was no significant difference in responses or survival. Thus, our data suggests that the combination of verapamil with oncolytic adenoviruses is safe and well tolerated. Moreover, verapamil treatment seems to result in higher virus titers in blood, indicating enhanced overall replication in tumors. A randomized trial is needed to confirm these findings and to study if enhanced replication results in benefits to patients.
Introduction
Numerous phase I and phase II clinical trials have been conducted with several types of oncolytic viruses and currently several phase III trials are ongoing.1 The most clinically advanced virus type is oncolytic adenovirus which has already been evaluated in dozens of trials including a positive randomized phase III trial.2,3,4 However, single agent treatment is usually not curative in the context of widely metastatic disease and thus there is room for improvement with regard to efficacy.5
As viruses meet several intratumoral and humoral obstacles hindering their effective spread within and between lesions,3 it has been hypothesized that rate of virus replication and release are critical steps for productive progression of the oncolytic antitumor effect.6 Recently, it was reported that calcium channel blockers such as verapamil can be used as an adjuvant to enhance the oncolytic potency of adenovirus.7 In laboratory studies, verapamil was shown to lead to a faster rate of virus release, formation of bigger plaques and enhancement of antitumor efficacy without impairing virus production, altering expression of viral proteins, affecting selectivity, or preclinical safety.7
The exact mechanisms behind these cytotoxicity enhancing effects of verapamil remain incompletely understood although it was shown that they were related specifically to its calcium channel blocking activity.7 Calcium is an important regulator of numerous cell processes, including apoptosis.8 Modification of intracellular calcium pools is used by many viruses in viral progeny release.9,10 For adenoviruses, adenovirus death protein accumulation in host cells has been shown to mediate cell lysis and successive progeny release.11 However, it has been hypothesized that the enhanced release of virus caused by calcium influx is an adenovirus death protein-independent process.7
Calcium channel blockers inhibit calcium influx through calcium channels and calcium release from intracellular stores.12,13 Verapamil is commonly used clinically for treatment of cardiovascular13,14,15 and other16,17,18 disorders. It is usually well tolerated with typically only mild and manageable side effects. Thus the incorporation of verapamil into virotherapy treatment protocols presents an intriguing opportunity as it could be easily translatable into routine clinical use.
Here, we aimed to determine the safety of verapamil as an adjuvant in treatment of advanced cancer patients with oncolytic adenoviruses. We hypothesized that verapamil would lead to enhanced virus spread and release in the tumors, resulting in higher amounts of virus shed into blood. Also effects on neutralizing antibody induction, inflammatory cytokine responses, adverse events (AEs), clinical benefits, and patient survival were examined.
Results
Treatment groups
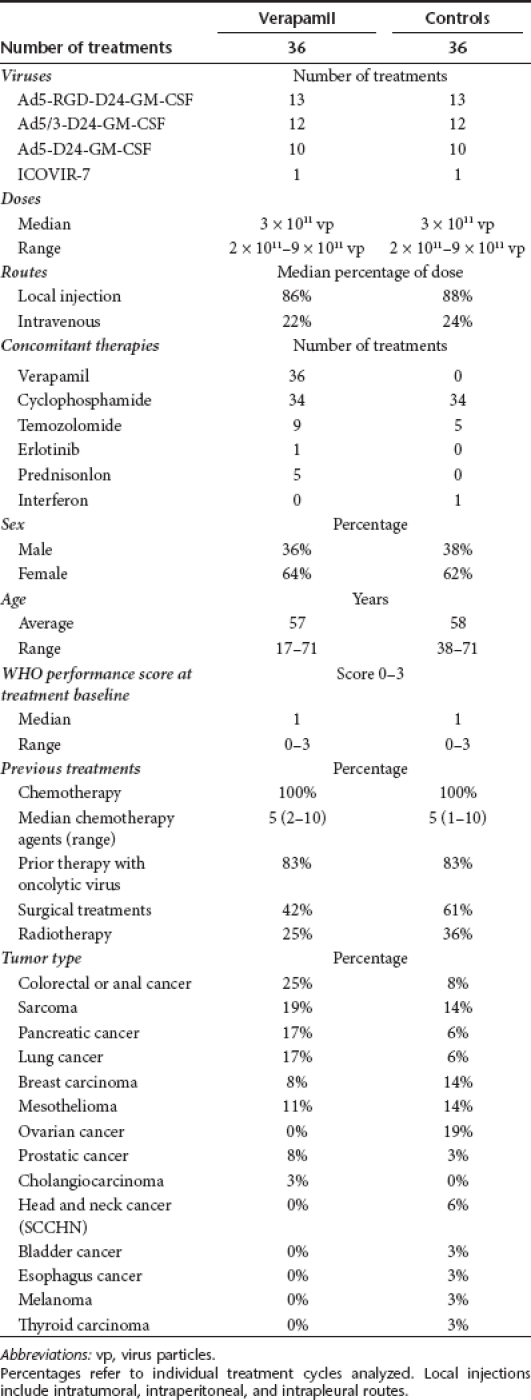
Verapamil was given in conjunction with 36 adenovirus treatment cycles. The viruses used for these treatments were Ad5-D24-GM-CSF, Ad5/3-D24-GM-CSF, Ad5RGD-D24-GM-CSF, and ICOVIR-7.19,20,21,22 Six treatment cycles were given to patients who had not received oncolytic virus treatments previously and 30 treatment cycles to patients who had. Some patients received multiple treatments. As a control cohort 36 virus treatment cycles were selected by retrospective matching. Matching criteria in descending order of importance were (percentage of complete matches in parentheses): availability of serum samples from treatment period (100%), previous virus treatments (yes/no 100%), treatment with the same virus (100%), concomitant low-dose cyclophosphamide administration (yes/no 94%), dose of virus (92%), WHO performance status (42%), gender (58%), and similar age within 5 years range (39%). See summaries of treatments and patient groups in Table 1, whereas detailed information on each patient and treatment can be found in Supplementary Table S1.
Table 1. Summary of treatments and patient baseline characteristics at beginning of each treatment.
Virus titers in blood are higher in verapamil-treated patients than in controls
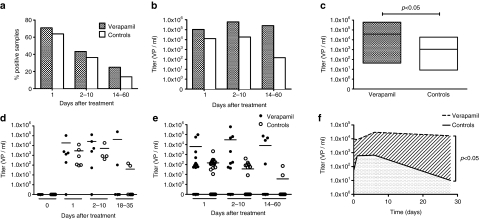
Oncolytic adenovirus DNA was detected in the serum of patients up to 60 days post-treatment (Supplementary Table S2). When patients had not received prior oncolytic virus therapy, baseline titers were negative. In case of nonfirst rounds, some “day 0” samples were positive for viral DNA, due to previous virus treatments. Wild-type adenovirus was not found in any of the serum samples. Prevalence of positive samples was usually highest on day 1 after treatment. There was no significant difference in prevalence of positive samples between verapamil and control groups (Figure 1a). Maximum titers at different time points tended to be being higher in the verapamil group (P = 0.063), with the highest recovered titers being 2.5 × 10⁵ viral particles (vp)/ml in the verapamil group and 1.8 × 10⁴ vp/ml in the control group (Figure 1b). Mean virus titers were similar at baseline (caused by previous rounds), but significantly higher in the verapamil group after treatment (P < 0.05), when data from all time points were pooled (Figure 1c). Further, the area under the curve (AUC), for virus titer against time, was calculated for each treatment. The mean AUC for verapamil treatments was 543,330 vp/ml · days and 12 964 vp/ml · days for controls and thus the mean AUC was a significantly higher for verapamil treatments (P < 0.05) (Figure 1d–f).
Figure 1.
Higher virus titers seen in serum of patients treated with verapamil. (a) Percentage of serum samples positive for oncolytic virus DNA as detected by quantitative PCR. (b) Maximum titers in serum samples within the indicated time interval after treatment. (c) Floating bars plot showing mean virus titers (horizontal line) in positive serum samples after treatment, with ranges (box). (d) Virus titers in serum during first cycles of oncolytic adenovirus treatments with (n = 6) and without (n = 6) verapamil. Horizontal line indicates mean. (e) Virus titers in serum after treatments (n = 30+30) of patients who had received prior adenovirus treatments. (f) Mean virus titers of all samples at each time point plotted at respective time points (median of sample days) for illustration of area under the curve analysis.
Rate or severity of adverse events is not increased with verapamil
Mild-to-moderate adverse events (AE) were encountered in all treatments (Supplementary Tables S3 and S4). Interestingly some degree of lymphopenia was seen in a total of 34 verapamil and 31 control treatments (Supplementary Table S3). Grade 3 AE were encountered in 53% of verapamil treatments and 58% of controls, the majority of these being transient self-limiting disturbances in laboratory findings, lymphopenia in particular (Supplementary Table S4). Only 11% (five treatments) of verapamil treatments and 6% (two treatments) of control treatments were accompanied by grade 3 nonlaboratory AE. The only grade four AEs were transient lymphopenias, two in verapamil treatments and one in controls, and one pulmonary embolism in a verapamil treatment. No treatment-related deaths occurred. Overall, there was no statistically significant difference in occurrence of AE. Grade by grade, however, there were more grade 1 laboratory finding AE in the verapamil group (P = 0.008, Supplementary Table S4.)
The inflammatory cytokine response profile is not affected by verapamil
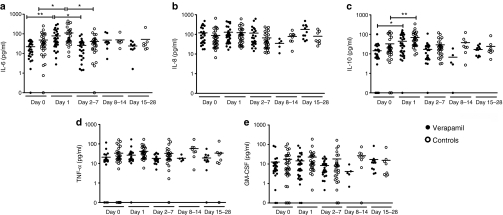
Elevation of inflammatory cytokines in serum—interleukin-6 (IL-6) in particular—has been associated with adenovirus-related toxicity.23 Therefore, we investigated the effects of verapamil on the levels of proinflammatory cytokines IL-6, IL-8, and tumor necrosis factor-α as well as anti-inflammatory IL-10 (Supplementary Table S2). Also serum granulocyte-macrophage colony-stimulating factor (GM-CSF) levels were analyzed (Supplementary Table S2) as three of the four viruses in this study express human GM-CSF as a transgene, and theoretically enhanced viral release and spread could result in changes in systemic GM-CSF levels. There were no notable alterations in levels of IL-8, tumor necrosis factor-α, or GM-CSF after treatments and no differences between verapamil treatments and controls (Figure 2). IL-6 levels increased transiently in both groups, approximately threefold, on day 1 (P < 0.05) and returned to baseline thereafter (Figure 2a). Also IL-10 levels increased in both groups, approximately twofold, on day 1 (P < 0.05) (Figure 2c). There were no significant differences between verapamil-treated patients and controls. Dose-dependent IL-6 and IL-10 elevations have been reported frequently with adenovirus gene therapy.23,24 When compared to levels associated with adenoviral toxicity (over 8,000 pg/ml has been reported associated with systemic inflammatory response syndrome23), the IL-6 elevations seen in our patients were minor and not likely to be clinically relevant.
Figure 2.
Verapamil does not affect cytokine responses. Serum samples were analyzed at several time points for levels of inflammatory cytokines (a) interleukin (IL)-6, (b) IL-8, (c) IL-10, (d) tumor necrosis factor (TNF)-α, and (e) GM-CSF, shown as dot plots with horizontal line at mean cytokine concentration. *P < 0.05 and **P < 0.01 between the two time points indicated by the capped line. There were no significant differences between verapamil patients and controls at any time point.
Neutralizing antibody induction is not accelerated by verapamil
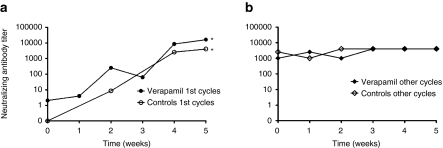
For those treatments when the patient had not received prior adenovirus therapy neutralizing antibody titers were low at baseline and were rapidly elevated thereafter (P < 0.05), as reported.19,20,21,22,25 When patients had been treated previously with adenoviruses baseline titers were already high and titers remained such during treatment follow-up. Neutralizing antibody responses were similar in verapamil-treated patients and controls (Figure 3 and Supplementary Table S2)
Figure 3.
Verapamil does not impact neutralizing antibody responses. Neutralizing antibody titer against the virus used in each treatment was determined by serial dilutions of serum samples. Illustrated as median neutralizing antibody titer for each time point for (a) treatment cycles (n = 6+6) of patients with no previous adenovirus treatments and (b) treatment cycles (n = 30+30) of patients who had received prior adenovirus treatments. *P < 0.05 against neutralizing antibody titer at baseline. There was no significant difference between verapamil patients and controls.
Disease control and overall survival were similar with or without verapamil
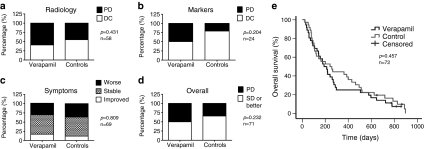
Twenty nine treatments were evaluable both in verapamil and control groups with radiological RECIST1.1 criteria (Table 2). In the case of serial treatments, evaluations were not done immediately after the first viral treatment, but rather after the patient had received three rounds of therapy typically given every 3 weeks.26 However, all these three treatments probably affected the radiological outcome and they are thus indicated in Table 2. Patients evaluated after serial treatment were well balanced between cohorts (5 and 5). Disease control (treatment resulting in stable disease or better) was seen in 41% and 55% of treatments, respectively, for verapamil and control groups (Figure 4a, not statistically significant, P = 0.431). If only treatments where radiological evaluation was done before additional viral treatments (excluding serial treatments) are considered (n = 20 verapamil, 22 controls), disease control was seen in 45% and 73% treatments (P = 0.115). Tumor markers were measured during each treatment, if elevated at baseline (verapamil n = 10, controls n = 14). Disease control, i.e., stabilization or reduction of marker levels, was seen in 50% of verapamil treatments and 79% of control treatments (P = 0.204, Figure 4b). The patients' cancer-related symptoms were evaluated before and after treatments and subjective symptom relief was described in 17% and 12% of treatments whereas symptoms remained stable in 53% and 52% of verapamil and control treatments, respectively (P = 0.809) (Figure 4c).
Table 2. Response evaluation and survival.
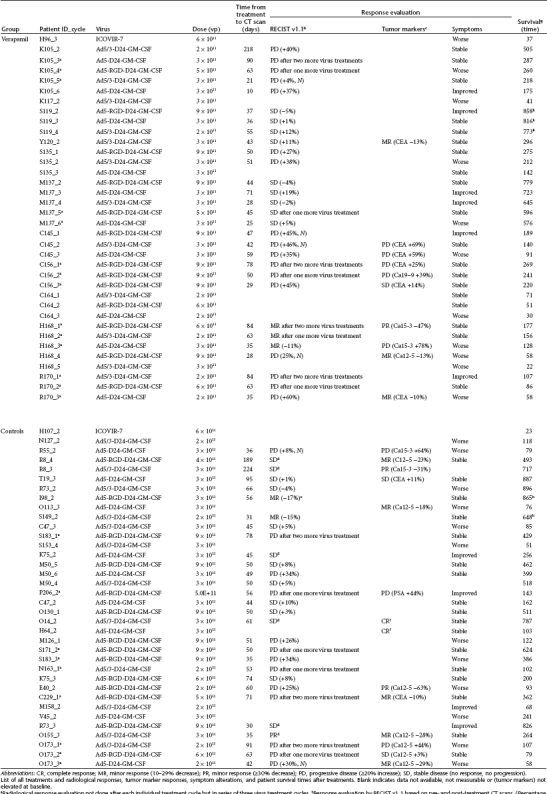
Figure 4.
Response rates and survival in verapamil patients and controls. Responses were analyzed (a) radiologically, (b) with tumor markers measured from blood, (c) symptom alterations, and (d) overall signs of efficacy (radiology, markers, symptoms). DC, disease control; PD, progressive disease, i.e., stable disease or better response. (e) Kaplan–Meier analysis of overall survival of patients. Patients who were still alive at the time of submission of the manuscript were censored (tick marks). No significant differences were seen (P = 0.457). P values and n indicated in figures.
Overall, evidence of possible treatment benefit was seen in 50% of verapamil treatments and 66% of controls (P = 0.232, Figure 4d and Table 2). This was calculated by assigning each treatment as presenting a possible sign of benefit (defined as disease control in either radiology or tumor markers or improvement in tumor-related symptoms) or lack of such signs. Median overall survival was 189 days (95% confidence interval 126–252 days) for verapamil treatments and 241 days (95% confidence interval 91–391 days) for controls (P = 0.457). Survival follow-up was still ongoing for three verapamil treatments and two control treatments on 27th May 2011 (Figure 4e).
Discussion
Previous preclinical research has indicated that the calcium channel blocker verapamil is a potent enhancer of adenovirus progeny release from cancer cells and increases the cytotoxicity and antitumor efficacy of oncolytic adenoviruses in vitro and in mouse models.7 This raises an intriguing opportunity of combination therapy for translation into clinical trials as verapamil is widely used for cardiovascular diseases and has an excellent safety profile.12,13,14,15,16,17,18
Interestingly, recent research has linked calcium channel blockers also to innate immunity. Calcium channel blockers have been able to suppress the activation of various cell types, such as T-cells, mast cells, and macrophages and thus have been suggested to function as immunologically active drugs.27 They have been proposed to have both immune suppressive and stimulatory effects.27,28,29 Similarly, the role of the immune system in oncolytic virus therapy has been under controversy.30,31 Thus, the relevance of putative immunological effects mediated by calcium channel blockers—in context of virotherapy—are presently obscure yet intriguing. Given the complexity of the relevant phenomena, and the poor predictive power of preclinical model systems in the field of tumor immunology, human data may be needed to resolve these issues.
As amounts and production rates of progeny virus released cannot be directly measured at the tissue level in human patients, we investigated virus shed into blood stream as a surrogate. Injected virus is rapidly cleared from the blood stream24,32 and therefore extended presence, reappearance or increase in virus genomes in blood has been proposed as a sign of virus replication.24,33,34,35 Interestingly, and in accord with previous preclinical data,7 higher virus titers were detected in verapamil-treated patients (P < 0.05). This is suggestive of verapamil indeed facilitating virus replication and release also in humans.
Treatments were well tolerated overall and the rate and severity of AEs were similar in both groups. Inflammatory cytokine profiles were similar in both groups, with similar transient elevations of IL-6 and IL-10 occurring 1 day after treatment. Hence, the addition of verapamil to virus treatments appeared safe. Also, verapamil did not lead to detectable changes in serum tumor necrosis factor-α levels in humans, in contrast to previous in vitro data on peripheral blood mononuclear cells.29 Neutralizing antibody responses were similar in both groups, with titers rising during treatment of patients previously naive to adenovirus treatments and remaining high when patients had had previous oncolytic adenovirus exposure, as published.19,20,21,22,25 Therefore, the putative enhancement of virus release caused by verapamil did not translate into changes in antibody response.
Transient lymphopenia was a common AE with the highest drop manifested on the first day after treatment and recuperation was usually seen within few days. Viral infections are known to reduce blood lymphocyte counts through complicated mechanisms including trafficking to sites of infection and lymphopenic viral effects.36 Thus, it is not unexpected to encounter lymphopenia also in association with virotherapy, and this has also been reported earlier in context of adenoviral gene therapy.24 We hypothesize that the phenomenon may reflect active trafficking of CD8+ and CD4+ T-cells to tumors and lymph nodes, possibly contributing to antiviral and antitumoral responses as proposed previously.19,37,38 However, studies employing tumor biopsies are needed to investigate this.
Disease control was not improved by verapamil treatment as analyzed by radiological, subjective or tumor marker data. There was also no improvement in median survival in verapamil-treated patients compared to controls. However, this small study was not conducted in a prospective randomized manner, nor was efficacy a primary endpoint and thus these data should be interpreted with caution. Although no significant differences were seen, there was a trend for more “progression” in verapamil patients in both radiology and tumor markers. We hypothesize that this might be due to enhanced replication resulting in more inflammatory swelling of tumors (termed “pseudoprogression” by the United States Food and Drug Administration in the context of cancer immunotherapy) and more pronounced marker “surge,” respectively. The latter could be caused by an increase in protein production (including tumor marker peptides) in infected cells, followed by lysis and release of markers into blood.34,39,40
If it is confirmed in a randomized setting that enhanced replication does not translate into clinical benefits, this would support the hypothesis that immune responses triggered by viral therapy may be more crucial for antitumor efficacy than the degree or magnitude of replication.30,31 Furthermore, as verapamil has been associated with immunological effects, including immune suppression, this might even work against the possible benefits gained by enhancement of viral release and spread. Conversely, enhanced release may lead to a faster virus immune clearance from the tumor in an immune competent host.
In summary, patients treated with calcium channel blocker verapamil had higher circulating adenovirus titers after treatment, in comparison to matched controls. This could be an interesting and possibly safe method for improving efficacy of an oncolytic adenovirus-based treatment approach where a high systemic viral load is required or beneficial. For confirming the effect of verapamil, a randomized crossover design trial would be useful. In this approach, each patient would first be treated with a virus with or without verapamil and then cross over to the other group. As calcium has been proposed relevant for the lytic abilities of also other viruses,9,10 the approach could be important for the entire field of oncolytic virotherapy.
Materials and Methods
Adenoviruses. Ad5-D24-GM-CSF, Ad5/3-D24-GM-CSF, Ad5-RGD-D24- GM-CSF, and ICOVIR-7 have been published.19,20,21,22 Virus production was done, according to the principles of cGMP by Oncos Therapeutics (Helsinki, Finland). Ad5luc1, Ad5/3luc1, Ad5lucRGD have been published previously.41,42,43
Patients. Treatments were given in the context of an ISRCTN registered Advanced Therapy Access Program (Advanced Therapy Access Program (ATAP): a treatment for refractory cancer with oncolytic viruses, ISRCTN 10141600). ATAP is regulated by FIMEA as determined by EU EC/1394/2007. The inclusion criteria were: solid tumors refractory to conventional therapies and progressive disease, WHO performance score ≤3 and no major organ function deficiencies. Exclusion criteria were: organ transplant, HIV, or other major immunosuppression, brain metastasis, bilirubin, alanine transaminase, or aspartate aminotransferase elevated three times ULN, severe thrombocytopenia, and other severe disease or organ malfunction. Written informed consent was required and treatments were administered according to Good Clinical Practice and the Declaration of Helsinki. ATAP is in compliance with EU and Finnish regulations and has been evaluated by the Medicolegal Department of the Finnish Ministry of Social Affairs and Health and The Gene Technology Board.
Controls for verapamil-treated patients were selected by retrospective matching according to criteria presented in the Results section. To avoid confounding related to first versus nonfirst rounds of treatment, the same patient could not function as a case and control i.e., no”self-controls” were allowed.
Treatment protocol. Patients received oncolytic virus treatment on day 0 by ultrasound-guided intratumoral injection and at least one fifth of the dose was given intravenously, as published.20 In the case of intrapleural or intraperitoneal disease, intratumoral injection could be also performed intracavitary. Viral doses ranged from 2 × 10¹¹ vp to 9 × 10¹¹ (Supplementary Table S1). Verapamil was administered 200 mg twice daily orally, as a slowly releasing depot tablet. Verapamil treatment initiated 1 day after virus treatment and continued for at least 4 weeks. Patients in both groups also received concomitant low-dose cyclophosphamide to reduce regulatory T-cells, via either metronomic 50 mg/day peroral, 1,000 mg bolus infusion together with virus injection or combination of these, in the absence of contraindications.25 Cyclophoshamide use was well balanced as it was used in 94% of both verapamil and control treatment rounds.
Patients were monitored for 24 hours in the hospital and 4 weeks as outpatients. AEs were recorded according to CTCEA v3.0 (Supplementary Table S3). Pre-existing symptoms were not listed unless they worsened. AEs were grouped into clinical AEs, i.e., symptoms, and laboratory-only (asymptomatic) AEs. All grade 3–5 AEs were further classified into being serious AEs (i.e., resulting in death, malformation, life-threatening condition or hospitalization of patient) or not, and their possible association to virus treatment was also classified by the treating oncologist.
Tumor sizes were assessed by contrast-enhanced computer tomography scanning before and at median 50 days after treatment. Some patients were treated with a serial treatment where radiological evaluation was performed after three virus injections—given every 3–4 weeks—instead of after each injection.26 These patients were balanced (5 and 5) between cases and controls (Table 2). Maximum tumor diameters were calculated according to RECIST v1.1,44 including injected and noninjected lesions. These criteria are: CR, complete response (tumor completely undetectable after treatment); PR, partial response (≥30% reduction in the sum of tumor diameters); SD, stable disease (no response, no progression); PD, progressive disease (≥20% increase or appearance of new metastatic lesions). Tumor decreases (10–29%) not fulfilling PR were scored as minor responses. Tumor markers were evaluated during the treatment cycle if they had been elevated previously. The same percentages were used for responses (Table 2) and the best response between 21 and 70 days after treatment was recorded. Alterations in symptoms were assessed based on patient's description at a follow-up visit circa 1 month after treatment.
Cytokine measurements. Cytokine levels in serum were measured using BD Cytometric Bead Array Soluble Protein Master Buffer Kit and BD Cytometric Bead Array Human IL-6, IL-8, IL-10, tumor necrosis factor-α, and GM-CSF Flex sets and BD FACSArray Bioanalyzer, BD FACS Array System Software and FCAP Array v1.0 software (BD Biosciences, San Diego, CA) according to manufacturer's instructions.
Neutralizing antibody titer determination. Neutralizing antibody tittering was done as described earlier.19 Depending on the virus that the patients had received in treatment, different adenoviruses were used for titration to ensure identical match of virus capsid: Ad5luc1 for Ad5-D24-GM-CSF, Ad5/3luc1 for AD5/3-D24-GM-CSF, and Ad5lucRGD for Ad5-RGD-D24-GM-CSF and ICOVIR-7-treated patients. The neutralizing antibody titer was determined as reciprocal of the lowest degree of dilution that blocked gene transfer >80%.
Detection of viral DNA in serum. Viral DNA was detected in serum samples as described earlier.19,33 Briefly, total DNA was extracted using carrier DNA (polydeoxyadenylic acid; Roche, Mannheim, Germany) with QIAamp DNA mini kit, eluted in 60 µl nuclease-free water and DNA concentration was measured by spectrophotometry. PCR amplification was based on primers and probe targeting the E1A region flanking the 24-base pairs deletion (forward primer 5′- TCCGGTTTCTATGCCAAACCT-3′, reverse primer 5′-TCCTCCGGTGATAATGACAAGA-3′ and probe onco 5′FAM-TGATCGATCCACCCAGTGA-3′MGBNFQ). In addition, a probe complementary to a sequence included in the 24-base pairs region targeted for deletion was used to test the samples for the presence of wild-type adenovirus infection (probe wt 5′VIC-tacctgccacgaggct-3′MGBNFQ). TaqMan exogenous internal positive control reagents (Applied Biosystems, Carlsbad, CA) were used in the same PCR runs to test each sample for the presence of PCR inhibitors. The viral loads in serum were calculated using a regression standard curve based on serial dilutions of adenoviruses in normal human serum (1 × 10⁹–1 × 101 vp/ml). The limit of detection and limit of quantification for the assay were 500 vp/ml of serum; titers <500 vp/ml were extrapolated using the standard curve. Positive samples were confirmed by real-time PCR using LightCycler480 SYBR Green I Master mix (Roche) and primers specific for adenovirus sequences respective of the treatment virus in question.33
Statistical analysis. Statistics were done with SPSS v17.0. Average viral titers were analyzed with two-tailed Student's t-test and Tukey's two-way ANOVA, maximum titers between groups were compared with Wilcoxon-signed ranks test. AUC, for virus titers against time, was calculated for each treatment using MedCalc software and comparison between groups was done with one-way ANOVA on log transformed data. AEs were analyzed with t-test for matched samples. Serum cytokine levels were analyzed with one-way ANOVA. Neutralizing antibody titers were analyzed with two-tailed Student's t-test. Responses were analyzed with Fisher's exact test and χ2-test was used for analysis of symptom responses. Survival data was processed with Kaplan–Meier analysis and log rank test.
SUPPLEMENTARY MATERIAL Table S1. Characteristics of individual treatment cycles. Table S2. Individual values for serum virus titers, cytokine levels, and neutralizing antibody titers. Table S3. Adverse events. Table S4. Summary and comparison of adverse events.
Acknowledgments
We thank personnel at International Comprehensive Cancer Center Docrates and Eira Hospital for help and support, and staff at CGTG for expert assistance. We thank Tuija Hevonkorpi at 4Pharma Ltd. for statistical advices. This work was supported by Helsinki Biomedical Graduate School, Finnish Foundation for Research on Viral Diseases, Finnish-Norwegian Medical Foundation, K. Albin Johansson Foundation, The Emil Aaltonen Foundation, The Finnish Oncology Association, The Finnish Medical Foundation, Biocentrum Helsinki, Biocenter Finland, and University of Helsinki. A.H. is K. Albin Johansson Research Professor of the Foundation for the Finnish Cancer Institute. A.H. is a shareholder in Oncos Therapeutics Ltd. T.J. is a partner in International Comprehensive Cancer Center Docrates.
Supplementary Material
Characteristics of individual treatment cycles.
Individual values for serum virus titers, cytokine levels, and neutralizing antibody titers.
Adverse events.
Summary and comparison of adverse events.
REFERENCES
- Eager RM., and, Nemunaitis J. Clinical development directions in oncolytic viral therapy. Cancer Gene Ther. 2011;18:305–317. doi: 10.1038/cgt.2011.7. [DOI] [PubMed] [Google Scholar]
- Yu W., and, Fang H. Clinical trials with oncolytic adenovirus in China. Curr Cancer Drug Targets. 2007;7:141–148. doi: 10.2174/156800907780058817. [DOI] [PubMed] [Google Scholar]
- Yamamoto M., and, Curiel DT. Current issues and future directions of oncolytic adenoviruses. Mol Ther. 2010;18:243–250. doi: 10.1038/mt.2009.266. [DOI] [PMC free article] [PubMed] [Google Scholar]
- Xia ZJ, Chang JH, Zhang L, Jiang WQ, Guan ZZ, Liu JW.et al. (2004[Phase III randomized clinical trial of intratumoral injection of E1B gene-deleted adenovirus (H101) combined with cisplatin-based chemotherapy in treating squamous cell cancer of head and neck or esophagus] Ai Zheng 231666–1670. [PubMed] [Google Scholar]
- Pesonen S, Kangasniemi L., and, Hemminki A. Oncolytic adenoviruses for the treatment of human cancer: focus on translational and clinical data. Mol Pharm. 2011;8:12–28. doi: 10.1021/mp100219n. [DOI] [PubMed] [Google Scholar]
- Wein LM, Wu JT., and, Kirn DH. Validation and analysis of a mathematical model of a replication-competent oncolytic virus for cancer treatment: implications for virus design and delivery. Cancer Res. 2003;63:1317–1324. [PubMed] [Google Scholar]
- Gros A, Puig C, Guedan S, Rojas JJ, Alemany R., and, Cascallo M. Verapamil enhances the antitumoral efficacy of oncolytic adenoviruses. Mol Ther. 2010;18:903–911. doi: 10.1038/mt.2010.22. [DOI] [PMC free article] [PubMed] [Google Scholar]
- Contreras L, Drago I, Zampese E., and, Pozzan T. Mitochondria: the calcium connection. Biochim Biophys Acta. 2010;1797:607–618. doi: 10.1016/j.bbabio.2010.05.005. [DOI] [PubMed] [Google Scholar]
- Zhou Y, Frey TK., and, Yang JJ. Viral calciomics: interplays between Ca2+ and virus. Cell Calcium. 2009;46:1–17. doi: 10.1016/j.ceca.2009.05.005. [DOI] [PMC free article] [PubMed] [Google Scholar]
- Hyser JM, Collinson-Pautz MR, Utama B., and, Estes MK. Rotavirus disrupts calcium homeostasis by NSP4 viroporin activity. MBio. 2010;1 doi: 10.1128/mBio.00265-10. [DOI] [PMC free article] [PubMed] [Google Scholar]
- Doronin K, Toth K, Kuppuswamy M, Krajcsi P, Tollefson AE., and, Wold WS. Overexpression of the ADP (E3-11.6K) protein increases cell lysis and spread of adenovirus. Virology. 2003;305:378–387. doi: 10.1006/viro.2002.1772. [DOI] [PubMed] [Google Scholar]
- Triggle DJ. L-type calcium channels. Curr Pharm Des. 2006;12:443–457. doi: 10.2174/138161206775474503. [DOI] [PubMed] [Google Scholar]
- Brogden RN., and, Benfield P. Verapamil: a review of its pharmacological properties and therapeutic use in coronary artery disease. Drugs. 1996;51:792–819. doi: 10.2165/00003495-199651050-00007. [DOI] [PubMed] [Google Scholar]
- Midtbø K, Hals O, Lauve O, van der Meer J., and, Storstein L. Studies on verapamil in the treatment of essential hypertension: a review. Br J Clin Pharmacol. 1986;21 Suppl 2:165S–171S. doi: 10.1111/j.1365-2125.1986.tb02867.x. [DOI] [PMC free article] [PubMed] [Google Scholar]
- Karlsberg RP. Welcome–the calcium channel blockers. Chest. 1981;80:657–659. doi: 10.1378/chest.80.6.657. [DOI] [PubMed] [Google Scholar]
- Mallinger AG, Thase ME, Haskett R, Buttenfield J, Luckenbaugh DA, Frank E.et al. (2008Verapamil augmentation of lithium treatment improves outcome in mania unresponsive to lithium alone: preliminary findings and a discussion of therapeutic mechanisms Bipolar Disord 10856–866. [DOI] [PMC free article] [PubMed] [Google Scholar]
- Tfelt-Hansen P., and, Tfelt-Hansen J. Verapamil for cluster headache. Clinical pharmacology and possible mode of action. Headache. 2009;49:117–125. doi: 10.1111/j.1526-4610.2008.01298.x. [DOI] [PubMed] [Google Scholar]
- Modi S., and, Lowder DM. Medications for migraine prophylaxis. Am Fam Physician. 2006;73:72–78. [PubMed] [Google Scholar]
- Cerullo V, Pesonen S, Diaconu I, Escutenaire S, Arstila PT, Ugolini M.et al. (2010Oncolytic adenovirus coding for granulocyte macrophage colony-stimulating factor induces antitumoral immunity in cancer patients Cancer Res 704297–4309. [DOI] [PubMed] [Google Scholar]
- Koski A, Kangasniemi L, Escutenaire S, Pesonen S, Cerullo V, Diaconu I.et al. (2010Treatment of cancer patients with a serotype 5/3 chimeric oncolytic adenovirus expressing GMCSF Mol Ther 181874–1884. [DOI] [PMC free article] [PubMed] [Google Scholar]
- Nokisalmi P, Pesonen S, Escutenaire S, Särkioja M, Raki M, Cerullo V.et al. (2010Oncolytic adenovirus ICOVIR-7 in patients with advanced and refractory solid tumors Clin Cancer Res 163035–3043. [DOI] [PubMed] [Google Scholar]
- Pesonen S, Diaconu I, Cerullo V, Escutenaire S, Raki M, Kangasniemi L.et al. (2011Integrin targeted oncolytic adenoviruses Ad5-D24-RGD and Ad5-RGD-D24-GMCSF for treatment of patients with advanced chemotherapy refractory solid tumors Int J Cancer (epub ahead of print) [DOI] [PubMed] [Google Scholar]
- Raper SE, Chirmule N, Lee FS, Wivel NA, Bagg A, Gao GP.et al. (2003Fatal systemic inflammatory response syndrome in a ornithine transcarbamylase deficient patient following adenoviral gene transfer Mol Genet Metab 80148–158. [DOI] [PubMed] [Google Scholar]
- Reid T, Warren R., and, Kirn D. Intravascular adenoviral agents in cancer patients: lessons from clinical trials. Cancer Gene Ther. 2002;9:979–986. doi: 10.1038/sj.cgt.7700539. [DOI] [PMC free article] [PubMed] [Google Scholar]
- Cerullo V, Diaconu I, Kangasniemi L, Rajecki M, Escutenaire S, Koski A.et al. (2011Immunological effects of low-dose cyclophosphamide in cancer patients treated with oncolytic adenovirus Mol Ther 191737–1746. [DOI] [PMC free article] [PubMed] [Google Scholar]
- Nokisalmi P, Koski A, Kanerva A, Kangasniemi L, Diaconu I, Pesonen S.et al. Abstract 77 (2011Serial treatment of refractory cancer patients with GM-CSF expressing oncolytic adenovirus enhances immunological response and survival without compromising safety Mol Ther 19Suppl 1): S31 [Google Scholar]
- Liu W., and, Matsumori A. Calcium channel blockers and modulation of innate immunity. Curr Opin Infect Dis. 2011;24:254–258. doi: 10.1097/QCO.0b013e3283463e5b. [DOI] [PubMed] [Google Scholar]
- Matsumori A, Nishio R., and, Nose Y. Calcium channel blockers differentially modulate cytokine production by peripheral blood mononuclear cells. Circ J. 2010;74:567–571. doi: 10.1253/circj.cj-09-0467. [DOI] [PubMed] [Google Scholar]
- Abe T, Fuse I, Narita M, Takahashi M., and, Aizawa Y. Combination use of immune complexes and a Ca2(+) channel blocker azelnidipine enhances interleukin-12 p40 secretion without T helper type 17 cytokine secretion in human monocyte-derived dendritic cells. Clin Exp Immunol. 2009;156:405–412. doi: 10.1111/j.1365-2249.2009.03911.x. [DOI] [PMC free article] [PubMed] [Google Scholar]
- Alemany R., and, Cascallo M. Oncolytic viruses from the perspective of the immune system. Future Microbiol. 2009;4:527–536. doi: 10.2217/fmb.09.28. [DOI] [PubMed] [Google Scholar]
- Prestwich RJ, Errington F, Diaz RM, Pandha HS, Harrington KJ, Melcher AA.et al. (2009The case of oncolytic viruses versus the immune system: waiting on the judgment of Solomon Hum Gene Ther 201119–1132. [DOI] [PMC free article] [PubMed] [Google Scholar]
- Alemany R, Suzuki K., and, Curiel DT. Blood clearance rates of adenovirus type 5 in mice. J Gen Virol. 2000;81 Pt 11:2605–2609. doi: 10.1099/0022-1317-81-11-2605. [DOI] [PubMed] [Google Scholar]
- Escutenaire S, Cerullo V, Diaconu I, Ahtiainen L, Hannuksela P, Oksanen M.et al. (2011In vivo and in vitro distribution of type 5 and fiber-modified oncolytic adenoviruses in human blood compartments Ann Med 43151–163. [DOI] [PubMed] [Google Scholar]
- Reid T, Galanis E, Abbruzzese J, Sze D, Wein LM, Andrews J.et al. (2002Hepatic arterial infusion of a replication-selective oncolytic adenovirus (dl1520): phase II viral, immunologic, and clinical endpoints Cancer Res 626070–6079. [PubMed] [Google Scholar]
- Nemunaitis J, Khuri F, Ganly I, Arseneau J, Posner M, Vokes E.et al. (2001Phase II trial of intratumoral administration of ONYX-015, a replication-selective adenovirus, in patients with refractory head and neck cancer J Clin Oncol 19289–298. [DOI] [PubMed] [Google Scholar]
- Wen Y, Deng BC, Zhou Y, Wang Y, Cui W, Wang W.et al. (2011Immunological features in patients with pneumonitis due to influenza A H1N1 infection J Investig Allergol Clin Immunol 2144–50. [PubMed] [Google Scholar]
- Brahmer JR, Drake CG, Wollner I, Powderly JD, Picus J, Sharfman WH.et al. (2010Phase I study of single-agent anti-programmed death-1 (MDX-1106) in refractory solid tumors: safety, clinical activity, pharmacodynamics, and immunologic correlates J Clin Oncol 283167–3175. [DOI] [PMC free article] [PubMed] [Google Scholar]
- Fridlender ZG, Sun J, Singhal S, Kapoor V, Cheng G, Suzuki E.et al. (2010Chemotherapy delivered after viral immunogene therapy augments antitumor efficacy via multiple immune-mediated mechanisms Mol Ther 181947–1959. [DOI] [PMC free article] [PubMed] [Google Scholar]
- Turunen TMO, Nokisalmi P, Cerullo V, Pesonen S, Oksanen M, Escutenaire S.et al. (2009ASGT Abstract 280 Effect of oncolytic adenovirus on tumor marker levels in cancer patients and in preclinical test systems Mol Ther 17Suppl 1): S110 [Google Scholar]
- Fukuda K, Abei M, Ugai H, Kawashima R, Seo E, Wakayama M.et al. (2009E1A, E1B double-restricted replicative adenovirus at low dose greatly augments tumor-specific suicide gene therapy for gallbladder cancer Cancer Gene Ther 16126–136. [DOI] [PubMed] [Google Scholar]
- Krasnykh V, Belousova N, Korokhov N, Mikheeva G., and, Curiel DT. Genetic targeting of an adenovirus vector via replacement of the fiber protein with the phage T4 fibritin. J Virol. 2001;75:4176–4183. doi: 10.1128/JVI.75.9.4176-4183.2001. [DOI] [PMC free article] [PubMed] [Google Scholar]
- Kanerva A, Mikheeva GV, Krasnykh V, Coolidge CJ, Lam JT, Mahasreshti PJ.et al. (2002Targeting adenovirus to the serotype 3 receptor increases gene transfer efficiency to ovarian cancer cells Clin Cancer Res 8275–280. [PubMed] [Google Scholar]
- Kanerva A, Wang M, Bauerschmitz GJ, Lam JT, Desmond RA, Bhoola SM.et al. (2002Gene transfer to ovarian cancer versus normal tissues with fiber-modified adenoviruses Mol Ther 5695–704. [DOI] [PubMed] [Google Scholar]
- Eisenhauer EA, Therasse P, Bogaerts J, Schwartz LH, Sargent D, Ford R.et al. (2009New response evaluation criteria in solid tumours: revised RECIST guideline (version 1.1) Eur J Cancer 45228–247. [DOI] [PubMed] [Google Scholar]
Associated Data
This section collects any data citations, data availability statements, or supplementary materials included in this article.
Supplementary Materials
Characteristics of individual treatment cycles.
Individual values for serum virus titers, cytokine levels, and neutralizing antibody titers.
Adverse events.
Summary and comparison of adverse events.


