Abstract
Akt is encoded by a gene family for which each isoform serves distinct but overlapping functions. Based on the phenotypes of the germ line gene disruptions, Akt1 has been associated with control of growth, whereas Akt2 has been linked to metabolic regulation. Here we show that Akt1 serves an unexpected role in the regulation of energy metabolism, as mice deficient for Akt1 exhibit protection from diet-induced obesity and its associated insulin resistance. Although skeletal muscle contributes most of the resting and exercising energy expenditure, muscle-specific deletion of Akt1 does not recapitulate the phenotype, indicating that the role of Akt1 in skeletal muscle is cell nonautonomous. These data indicate a previously unknown function of Akt1 in energy metabolism and provide a novel target for treatment of obesity.
INTRODUCTION
Obesity has become a worldwide health problem, largely due to its health care costs as well as associated complications, like cardiovascular disease, cancer, and type II diabetes. Many ongoing studies have been directed toward preventing and treating obesity, although thus far most of the positive responses have not been long-lasting. The maintenance of a stable body weight requires a delicate balance between food intake and energy expenditure, which is easily disrupted in people enjoying the modern diet and a sedentary lifestyle and with a predisposing genetic make-up. Reduced physical activity and lower energy expenditure are associated with weight gain in human subjects (19, 35, 37). Lean mass, mostly skeletal muscle, contributes most of the resting and exercising energy expenditure (4). With the advent of the ability to manipulate the mouse genome, the identification of genes determining energy expenditure and body mass has become feasible and is being studied intensively. One mechanism that has been suggested to increase basal metabolic rate and afford protection from diet-induced obesity in mice is a stimulated mitochondrial biogenesis and increased respiratory uncoupling in skeletal muscle (9–11, 29, 39).
The serine-threonine protein kinase family Akt, also known as protein kinase B (PKB), is comprised of three isoforms, Akt1/PKBα, Akt2/PKBβ, and Akt3/PKBγ, each encoded by a distinct gene (40). All three members have been ablated in mice individually or in combination by our group and others (16). Akt1 is expressed ubiquitously, and its knockout shows no compensatory elevation of Akt2 expression and results in smaller body size and growth retardation with normal glucose homeostasis (6, 8). Akt2 is expressed primarily in insulin-responsive tissues, like liver, skeletal muscle, and adipose tissues (7). Genetic ablation of Akt2 in mice results in a diabetes-like phenotype that includes impaired glucose tolerance, reduced insulin-dependent glucose uptake in muscle and adipose tissue, and increased hepatic glucose production as determined by studies employing a euglycemic-hyperinsulinemic clamp (7, 14). Recent studies also showed that deletion of Akt2 in liver ameliorated hepatic steatosis in several obese mouse models (20, 24, 38). Akt3 is expressed predominantly in brain and testes, and germ line deletion of Akt3 in mice causes a reduction in brain size without affecting glucose homeostasis (13). Taken together, these data suggest that Akt2 is most important to the regulation of metabolism, whereas Akt1 is critical to growth control, although there are many reports indicating overlapping functions among Akt isoforms (5, 12, 14, 31, 41). For example, in 2010, Buzzi et al. reported that Akt1 knockout mice have improved insulin sensitivity and elevated insulin secretion, potentially as a result of decreased insulin receptor substrate 2 (IRS2) signaling in pancreatic β cells, which argues for a metabolic role of Akt1 in mice (5).
In our original description of the phenotypes of Akt1 null (Akt1−/−) mice, we noted a trend toward improved glucose tolerance that did not achieve statistical significance (8). In order to stress the system and possibly elicit a more striking indication for a role for Akt1 in metabolic control, we placed Akt1−/− mice on a high-fat diet (HFD). Surprisingly, mice with deletion of Akt1 were protected from diet-induced obesity and its associated insulin resistance. In this paper, we describe the analysis of this phenotype and report an increase in energy expenditure resulting from germ line deletion of Akt1.
MATERIALS AND METHODS
Animals.
Akt1−/− mice were backcrossed >10 generations to C57BL/6J mice from Jackson Laboratory (8). ob/ob mice were purchased from Jackson laboratory. Akt1loxP/loxP mice were generated by first obtaining the Akt1 gene spanning from intron 3 to intron 13 via screening of a mouse genomic library (lambda FIXII Library; Stratagene). After digestion with SmaI and HindIII, a 1.5-kb fragment of intron 3 was treated with Klenow enzyme and subcloned into the preblunted XbaI site of the loxP-flanked neomycin resistance/thymidine kinase selection cassette vector (pInt3Akt1-loxPneo/TK). A 1.5-kb fragment, which spanned intron 3 to intron 5 and was obtained from Akt1 genomic DNA by digestion with HindIII, was treatment with Klenow enzyme and subcloned into the loxP cassette vector (plox-Akt1ex4-5). A 3-kb fragment obtained from Akt1 genomic DNA by digestion with HindIII and SstI, which spanned intron 5 to intron 12, was treated with Klenow enzyme and inserted into the preblunted ClaI site of plox-Akt1ex4-5 (plox-Akt1ex4-12). After digesting plox-Akt1ex4-12 with SalI and HindIII, a 4.5-kb fragment was inserted between the SalI and HindIII sites of pInt3Akt1-loxPneo/TK. J1 embryonic stem cells were electroporated with 40 μg of the NotI-digested targeting vector and subjected to selection with G418, and the clones were screened for homologous recombination by PCR amplification of the intron 4 region and Southern blot analysis. Cells that were heterozygous for loxP sites flanking exons 3 and 4 of the Akt1 gene were injected into blastocysts derived from C57BL/6J mice and implanted into pseudopregnant CD-1 foster mothers according to standard methods. Chimeric mice (>90% as judged by coat color) were then bred with C57BL/6J mice. EIIa > Cre mice were obtained from Klaus Kaestner, University of Pennsylvania. Nestin > Cre and MCK > Cre mice were purchased from Jackson Laboratory. Mice that were bred with Cre lines were of an FVB-C57BL/6J mixed background, and male littermates were used for all studies. Mice were maintained on a normal chow diet (laboratory rodent diet 5001; LabDiet) unless otherwise noted and kept under a 12-h light-dark cycle (7 a.m./7 p.m.) in a barrier facility. When fed the HFD (D12331i; Research Diets), mice were started on it at 4 to 5 weeks of age, continuing for 22 weeks.
Metabolic measurements.
For glucose tolerance tests, mice were fasted overnight followed by oral gavage with 1 g/kg of body weight of glucose, and blood glucose levels were measured at the time points designated below.
Euglycemic-hyperinsulinemic clamping was performed by the Mouse Phenotyping, Physiology and Metabolism Core at the University of Pennsylvania. Wild-type (WT) and Akt1−/− mice were challenged on the HFD for 22 weeks before clamping. Mice were given a 10-mU/kg insulin bolus and then infused with 2.5 mU of insulin/kg/min. Blood glucose levels were maintained between 120 and 140 mg/dl.
Hepatic and serum triglyceride levels were measured as described previously (24). The measurements of other serum constituents were performed by the Radioimmunoassay and Biomarker Core (the Core) at the University of Pennsylvania.
Body composition, energy expenditure, locomotor activity, and food intake were analyzed by the Mouse Phenotyping, Physiology and Metabolism Core at the University of Pennsylvania. Body composition was determined by nuclear magnetic resonance (NMR) imaging analysis or dual-energy X-ray absorptiometry (DEXA), as noted below. Energy expenditure, locomotor activity, and food intake were assessed by using the Comprehensive Laboratory Animal Monitoring system (CLAMS). The respiratory exchange ratio (RER) was calculated as the volume of CO2 versus volume of oxygen (VCO2/VO2) ratio. For fasting-feeding experiments, food was removed at 7:00 a.m., the start of the light cycle, and freely accessible from 7:00 p.m. to 7:00 a.m. the next day (the entire dark cycle). Mice were trained under these conditions for 7 days before being subjected to measurements at the Core facility. During the monitoring process, water was accessible at all times.
Muscle palmitate oxidation assay.
Experimental procedures for the muscle palmitate oxidate assay were modified from those described in a previous report (18). Soleus muscles were quickly removed from overnight-fasted mice and incubated in 0.5 ml Krebs-Ringer bicarbonate buffer (Sigma) for 30 min in an oxygenated 37°C water bath. Then the muscles were transferred to incubation buffer with 0.2-μCi [3H]palmitate and placed in small glass vials in an oxygenated 37°C shaking water bath for 1 h. At the end of the incubation, 0.4 ml buffer was removed from each vial and mixed with 0.4 ml cold 10% trichloroacetic acid (TCA) and centrifuged 10 min, and the supernatant was neutralized with NaOH. After neutralization, the medium was applied to an AGI-X8 resin column (Bio-Rad) to remove charged molecules, and the column contents were eluted with 2 ml H2O into a scintillation vial. Blank control vials contained the same buffer without soleus tissue.
RNA isolation and gene expression analysis.
For RNA isolation and gene expression analysis, total RNA was extracted from skeletal muscle by using TRIzol reagent (Invitrogen), reverse transcribed with random decamers in the RetroScript kit (Ambion), and analyzed by real-time PCR on an Mx3000P quantitative PCR system (Stratagene) as described before (24). Primer sequences are available upon request.
Western blotting.
Mice were sacrificed by spinal dislocation, and tissue samples were removed, clamp-frozen in liquid nitrogen, and stored at −80°C until being processed as described before (24). Blots were probed for Akt1 (2976; Cell Signaling Technology), pAMPK T172 (2535; Cell Signaling Technology), tAMPKα (2603; Cell Signaling Technology), pACC (3661; Cell Signaling Technology), tubulin (2128; Cell Signaling Technology), UCP3 (UCP33-A; Alpha Diagnostic International), and β-actin (ab6276; Abcam). Blots were then probed with horseradish peroxidase (HRP)-conjugated secondary antibodies (Santa Cruz Biotechnology).
Statistics.
All data are presented as means ± standard errors of the means (SEM). As noted in the figure legends, data were analyzed by using an unpaired Student t test with two-tailed analysis, a one-way analysis of variance (ANOVA) followed by the Bonferroni posttest, or a two-way ANOVA followed by the Bonferroni posttest.
RESULTS
Akt1−/− mice are protected from diet-induced obesity.
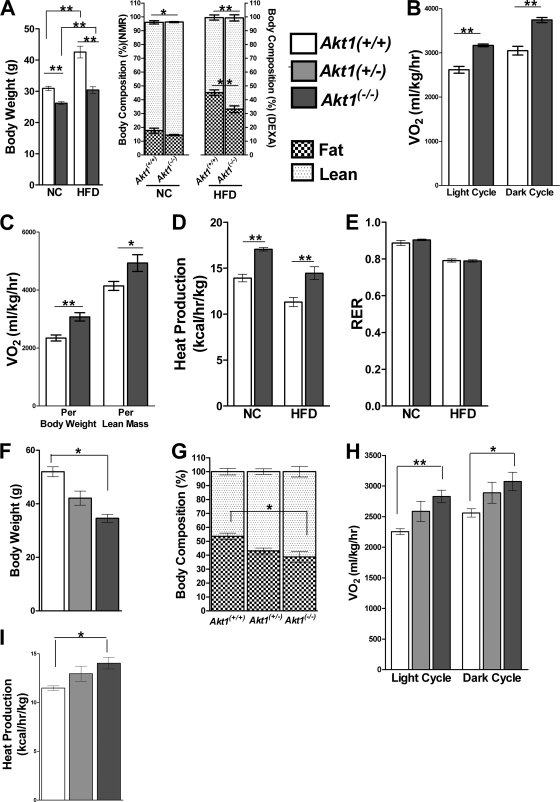
To assess a putative metabolic role for Akt1 in mice, we placed 4- to 5-week-old Akt1−/− mice on a high-fat diet for 22 weeks. During this period, wild-type controls (Akt1+/+) gained significantly more weight than those fed a normal chow (NC) diet, but there was a smaller difference in body weights between Akt1−/− mice on the two diets (Fig. 1A, left). Body composition also differed between WT and Akt1−/− mice, as the latter had a decreased contribution from fat mass (Fig. 1A, right). Even on a normal chow diet, WT mice had a significantly lower proportion of body mass attributable to lean mass than Akt1−/− mice (Fig. 1A, right). These data suggest that Akt1−/− mice have an energy balance that is different from WT mice, although an interpretation of our findings is complicated somewhat by the smaller body sizes of Akt1 null mice.
Fig 1.
Akt1−/− mice are protected from diet-induced obesity. (A) Body weights and compositions of age-matched WT and Akt1−/− mice on NC or the HFD. For the NC group, body composition was determined by NMR analysis, energy expenditure was measured for 24 h, and mice were male and 7 months old (n=7 to 9 mice). For the HFD group, body composition was determined by DEXA, energy expenditure was measured during the light cycle for 4 h, and mice were on HFD at 4 to 5 weeks of age and fed for 22 weeks (n=9 to 10 animals for each genotype). *, P < 0.05; **, P < 0.01 by the Student t test. (B) O2 consumptionof WT and Akt1−/− mice on NC. (C) O2 consumption of WT and Akt1−/− mice on HFD. (D and E) Heat production and RER of WT and Akt1−/− mice on NC or HFD. *, P < 0.05; **, P < 0.01 by the Student t test. (F and G) Body weight and body composition by NMR for independently derived Akt1+/+, Akt1+/−, and Akt1−/− littermates after HFD feeding. (H and I) O2 consumption and heat production of independently derived Akt1+/+, Akt1+/−, and Akt1−/− littermates after HFD feeding. Mice were fed the HFD for 22 weeks (n=4 to 8 animals for each genotype). *, P < 0.05; **, P < 0.01 by one-way ANOVA followed by the Bonferroni posttest. All data are means ± SEM.
To further investigate the mechanism underlying the differences in body size and composition, we monitored the metabolic activities of these mice by using CLAMS. Akt1−/− mice fed NC or HFD consumed significantly greater O2 and produced more CO2 than WT controls (Fig. 1B and C and data not shown). The lean mass of animals represents the major contributor of energy expenditure (4), but when values were normalized to lean mass, Akt1−/− mice still displayed significantly increased O2 consumption and CO2 production on both the NC diet and HFD (Fig. 1C and data not shown). Heat production was also elevated in Akt1−/− mice compared to WT mice on either diet, whereas RER, locomotor activity, and food and water consumption were not significantly different (Fig. 1D and E and data not shown). These data demonstrate that Akt1−/− mice have higher catabolic rates and are resistant to diet-induced obesity than WT mice.
Although these mice were crossed more than 10 generations onto a C57BL/6J background, we were still concerned that cotransmission of a closely linked gene could be responsible for the altered energy metabolism. To exclude this possibility, we generated independent germ line Akt1 null mice by crossing mice carrying Cre recombinase driven by an EIIa promoter with Akt1loxP/loxP mice (25). These mice were null for Akt1, as confirmed by genomic PCR and Western blotting (data not shown). After feeding these mice an HFD for 22 weeks, their body weights were significantly lower than their wild-type littermates, while the Akt1+/− mice displayed an intermediate phenotype (Fig. 1F). When we performed a replication of the experiment described above, the independently derived Akt1−/− mice displayed reduced adiposity after HFD challenge and elevated O2 consumption and heat production (Fig. 1G to I). These data indicate that the altered energetic phenotypes were indeed caused by deletion of Akt1.
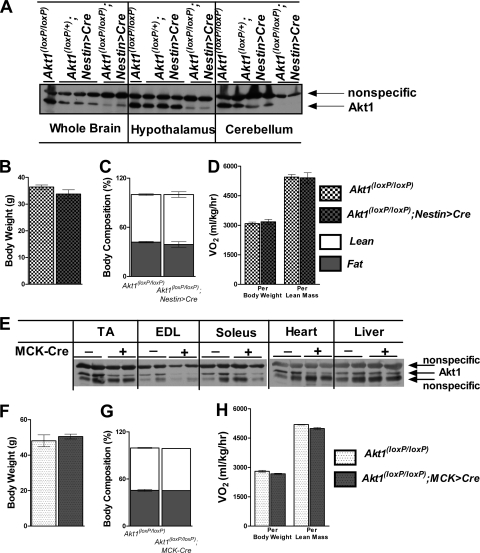
We next turned our attention to the identification of the tissue in which deletion of Akt1 leads to the increased energy expenditure. Akt1 contributes about one-third of total Akt in the brain (13); we bred Akt1loxP/loxP mice with transgenic mice with Cre recombinase driven by a rat Nestin promoter and enhancer (Nestin > Cre), which led to efficient excision of brain Akt1 (Fig. 2A), and we challenged the animals with an HFD for 22 weeks. Akt1loxP/loxP;Nestin > Cre mice did not reproduce the altered energy metabolism and protection diet-induced obesity of the Akt1−/− mice (Fig. 2B to D). Skeletal muscle represents the major contributor of energy expenditure (4); however, deletion of Akt1 in skeletal muscle by Cre driven by the muscle creatine kinase promoter (MCK > Cre) did not recapitulate the effects of Akt1 germ line deletion on body weight or energy expenditure (Fig. 2E to H). The liver also contributes to whole-body energy expenditure, but deletion of Akt1 specifically in the liver, by breeding Akt1loxP/loxP mice to a Cre mouse line driven by an albumin promoter, did not phenocopy the Akt1−/− mice (data not shown).
Fig 2.
Deletion of Akt1 in Nestin or MCK-expressing cells does not prevent diet-induced obesity in mice. (A) Western blot showing the effects of deletion of Akt1 in Akt1loxP/loxP; Nestin > Cre mice. Brain samples were from animals fed NC, and Akt1 levels were examined by Western blotting. Then, mice were fed the HFD for 22 weeks. (B to D) Body weight, body composition by NMR, and O2 consumption for Akt1loxP/loxP; Nestin > Cre mice and their littermate controls fed the HFD. Male mice started on the HFD when 4 weeks old and were maintained on it for 22 weeks before energy expenditure was measured (n=6 for each group). (E) Western blot showing the effects of deletion of Akt1 in Akt1loxP/loxP; MCK > Cre mice. Muscle samples were from animals fed NC, and Akt1 levels were examined by Western blotting. (F to H) Body weight, body composition by NMR, and O2 consumption for Akt1loxP/loxP; MCK > Cre mice and their littermate controls on the HFD. Male mice started on the HFD at 4 weeks of age and were maintained on it for 22 weeks before energy expenditure was measured (n=3 animals for each group). EDL, extensor digitorum longus. All data are presented as means ± SEM.
Akt1−/− mice on the HFD showed improved insulin sensitivity.
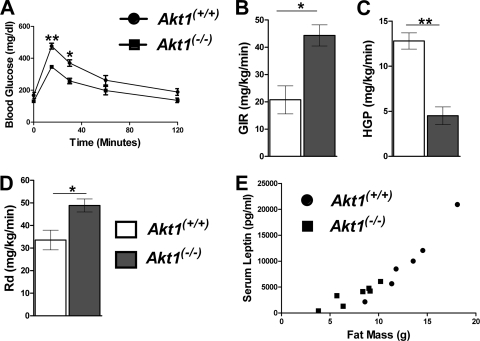
As shown in Fig. 3, when Akt1−/− mice were placed on the HFD, they demonstrated improved glucose tolerance and an increased glucose infusion rate upon euglycemic-hyperinsulinemic clamping compared to similarly fed WT mice (Fig. 3A and B). The latter was due to both a decrease in hepatic glucose production and an elevated peripheral glucose utilization rate (Rd) in Akt1−/− mice (Fig. 3C and D). Akt1−/− mice on an HFD had reduced leptin and total thyroxine and increased adiponectin in serum and no change in resistin levels (Table 1). The direct relationship between leptin and fat was preserved in Akt1−/− mice, consistent with the reduced leptin resulting directly from decreased adiposity (Fig. 3E). Deletion of Akt1 also protected mice from steatosis when fed an HFD (Table 1).
Fig 3.
Akt1−/− mice have improved insulin sensitivity after HFD feeding compared to WT mice. (A) Glucose tolerance test. Mice were fed the HFD for 18 weeks, and 1 g of glucose/kg was orally administrated after overnight fasting (n=3 to 4 animals for each group). The glucose infusion rate (GIR) (B), hepatic glucose production (HGP) (C), and peripheral glucose utilization rate (Rd) (D) during euglycemic-hyperinsulinemic clamping of mice fed the HFD for 22 weeks (n=3 for each group) are shown. All data are presented as means ± SEM, *, P < 0.05; **, P < 0.01 by the Student t test. (E) Serum leptin levels after overnight fasting from mice fed an HFD for 22 weeks (n=6 to 7 animals for each group). All data are presented as means ± SEM.
Table 1.
Metabolic characteristics of Akt1−/− mice on HFD
| Parameter | Value for mouse genotypea |
|
|---|---|---|
| Akt1+/+ | Akt1−/− | |
| Fasted triglyceride (mg/dl) | 50.624 ± 3.177 | 45.952 ± 3.285 |
| Fed triglyceride (mg/dl) | 69.720 ± 13.870 | 61.580 ± 18.770 |
| Fasted insulin (ng/ml) | 2.151 ± 0.577 | 1.632 ± 0.607 |
| Fed insulin (ng/ml) | 4.142 ± 2.908 | 2.900 ± 1.885 |
| Fasted leptin (ng/ml) | 9.882 ± 2.622 | 3.462 ± 0.750* |
| Fasted adiponectin (μg/ml) | 8.618 ± 0.509 | 16.411 ± 0.997** |
| Fasted thyroxine (total T4, in μg/dl) | 3.740 ± 0.156 | 3.088 ± 0.137* |
| Fasted free fatty acid (mM) | 1.106 ± 0.509 | 1.105 ± 0.150 |
| Fasted β-hydroxybutyrate (mg/dl) | 8.342 ± 1.694 | 6.491 ± 0.671 |
| Fasted resistin (ng/ml) | 1.640 ± 0.135 | 1.467 ± 0.353 |
| Fasted liver triglyceride (mg/g of protein) | 57.141 ± 10.698 | 33.479 ± 3.217* |
All data were obtained in overnight-fasted animals or fed animals as indicated and are presented as means ± SEM (n=4 to 7 animals per group). *, P < 0.05; **, P < 0.01 (compared to WT using the Student t test).
Young Akt1 knockout mice display an increased energy expenditure.
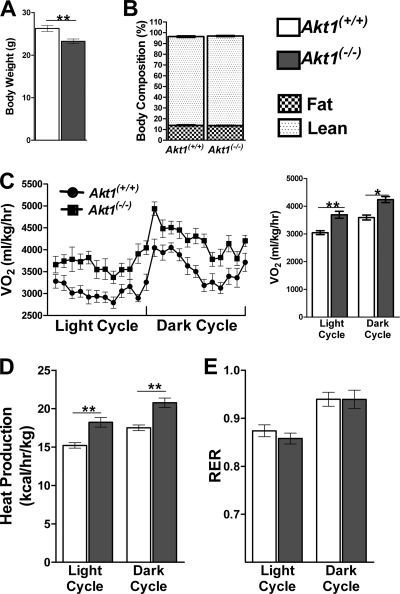
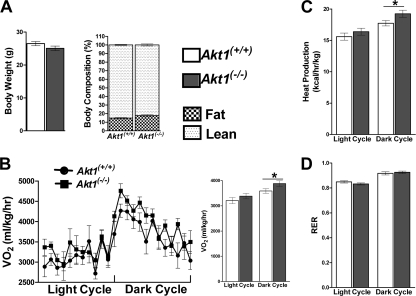
In an attempt to determine whether the reduced adiposity in 7-month-old Akt1−/− mice was the cause or result of altered energy metabolism, we examined 10-week-old mice, an age when Akt1−/− mice were smaller than WT but had indistinguishable body compositions (Fig. 4A and B). Consistent with the results presented above, 24-h O2 consumption and CO2 production were increased in Akt1−/− mice (Fig. 4C and data not shown). Heat production was also significantly elevated in Akt1−/− mice (Fig. 4D). RER, food and water intake, and locomotor activity were not altered in Akt1−/− mice (Fig. 4E and data not shown). Similar phenotypes were observed for the independently derived line of Akt1−/− mice (data not shown). These data suggest that an increased energy expenditure is the primary cause of reduced adiposity in aged mice or mice fed a high-fat diet.
Fig 4.
Akt1−/− mice displayed elevated energy expenditure compared to age-matched controls. (A) Body weights of WT and Akt1−/− mice. Both groups of mice were 10 weeks old and maintained on NC (n=10 animals for each group). **, P < 0.01 by the Student t test. (B to E) Body composition based on NMR, O2 consumption, heat production, and RER of WT and Akt1−/− mice fed NC (n=10 animals for each group). *, P < 0.05; **, P < 0.01 by two-way ANOVA followed by the Bonferroni posttest. All data are presented as means ± SEM.
Weight-matched Akt1−/− mice showed elevated energy expenditures.
As noted above, the smaller body size of Akt1−/− mice compared to their age-matched counterparts complicates the interpretation of the energetic phenotypes, even when the measurements are normalized to body or lean weight (4, 23). To ascertain whether altered energy metabolism in Akt1−/− mice was a consequence of differences in body size, we measured the critical parameters in a cohort of WT and Akt1−/− mice with similar body weights and compositions (Fig. 5A). Once again, VO2 and VCO2 were elevated in Akt1−/− mice, although in this experiment the elevations were noted only during the dark period, when there was also an increase in heat production (Fig. 5B and C and data not shown). There were no significant changes in RER, locomotor activity, or food and water consumption (Fig. 5D and data not shown).
Fig 5.
Akt1−/− mice displayed elevated energy expenditure compared to weight-matched controls. (A) Body weight and composition based on NMR analysis. WT mice were male and 10 weeks old, and Akt1−/− mice were 21 to 22 weeks old; all were maintained on NC. (B to D) O2 consumption, heat production, and RER of Akt1−/− mice and weight-matched WT mice (n=5 to 6 animals per group). *, P < 0.05 by two-way ANOVA followed by the Bonferroni posttest. All data are presented as means ± SEM.
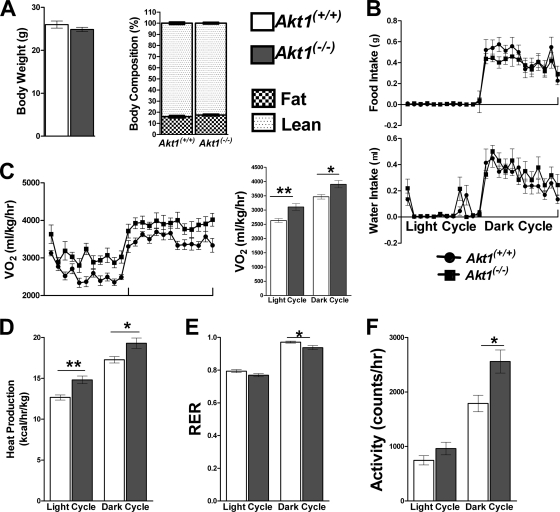
Given the elevated energy expenditure during the dark cycle for Akt1−/− mice in the previous experiment, we sought to accentuate this phenomenon further by subjecting the mice to a fasting-feeding regimen. WT and Akt1−/− mice of similar body weights were trained for 7 days under conditions in which during the light cycle food was removed, to generate a true “fasting” period, whereas mice had free access to food during the dark cycle (“feeding” period). As shown in Fig. 6A, body weights and compositions for this cohort were indistinguishable between WT and Akt1−/− mice. The amount of food and water consumed during the 24-h cycle was not different for the two genotypes (Fig. 6B). In this series of experiments, O2 consumption was increased during both the light and dark cycles in Akt1−/− mice compared to weight-matched controls, and CO2 production was also increased in the light cycle for these mice (Fig. 6C and data not shown). Heat production was also significantly increased in Akt1−/− mice (Fig. 6D). Moreover, Akt1−/− mice displayed decreased RER during the dark cycle and showed a similar trend during the light cycle compared to the weight-matched controls (Fig. 6E); also, in this experiment locomotor activity was enhanced during the dark cycle (Fig. 6F). These data indicate that the increased energy expenditure in Akt1−/− mice cannot be attributed to their reduced body size alone. Age-matched young Akt1−/− mice also showed the same phenotypes when subjected to the fasting-feeding protocol (data not shown).
Fig 6.
Akt1−/− mice exhibited higher energy expenditures than weight-matched WT mice during controlled feeding. (A) Body weight and composition by NMR. WT mice were 10 weeks old, and Akt1−/− mice were 21 to 22 weeks old. (B to F) Food and water consumption, O2 consumption, heat production, RER, and locomotor activity of Akt1−/− mice and weight-matched WT mice. All mice were maintained on NC, and food was removed during the light cycle and provided during the dark cycle (n=10 to 12 animals per group). *, P < 0.05; **, P < 0.01 by two-way ANOVA followed by the Bonferroni posttest. All data are presented as means ± SEM.
Energy metabolism in skeletal muscle from Akt1−/− mice.
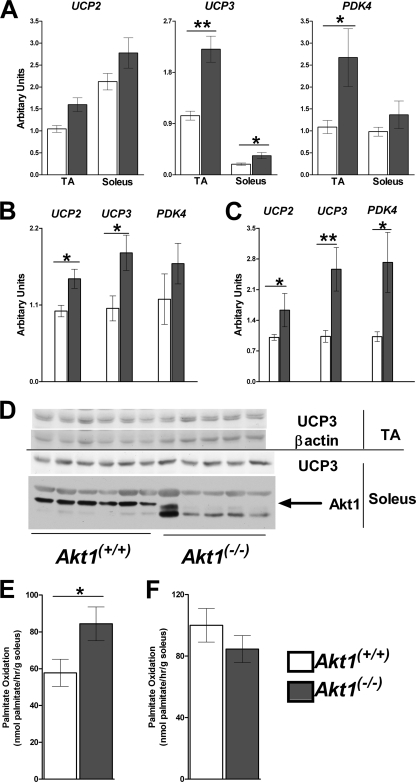
Skeletal muscle contributes most of the energy expenditure in humans as well as in mice (4). One of the major determinants of VO2 is the efficiency of coupling between mitochondrial respiration and ATP production (9, 10, 22). To ask whether alterations in coupling efficiency might account for the change in energetics in Akt1−/− mice, we assessed the expression levels of putative uncoupling proteins (UCPs) in skeletal muscle. UCP3 mRNA levels were significantly increased in tibialis anterior (TA) and soleus muscles from Akt1−/− mice compared to age-matched controls, while UCP2 showed similar trends (Fig. 7A). Using WT mice of a similar weight as controls, both UCP2 and UCP3 expression levels were increased in combined skeletal muscles of Akt1−/− mice (Fig. 7B). These differences persisted in the muscles of mice fed a high-fat diet (Fig. 7C). However, UCP3 protein levels were not significantly altered in TA or soleus muscles from Akt1−/− mice compared to the age-matched controls (Fig. 7D). In isolated skeletal muscle mitochondria, the state IV respiratory rate was the same between Akt1−/− mice and the age-matched controls (data not shown). Pyruvate dehydrogenase kinase 4 (PDK4) phosphorylates and inhibits the pyruvate dehydrogenase complex, resulting in a shift from oxidation of carbohydrates to oxidation of fat. Compared to age-matched controls fed a normal chow or high-fat diet, Akt1−/− mice had higher PDK4 mRNA levels in skeletal muscles (Fig. 7A and C). Consistent with the gene expression pattern and reduced RER under some conditions, ex vivo palmitate oxidation was increased in soleus muscle samples from young Akt1−/− mice compared to age-matched controls (Fig. 7E); however, this difference was not seen in muscle samples from Akt1−/− mice compared to weight-matched controls (Fig. 7F).
Fig 7.
Increased fatty acid oxidation in skeletal muscle from Akt1−/− mice. (A) UCP2, UCP3, and PDK4 expression in skeletal muscles of age-matched young WT and Akt1−/− mice. Mice are as described for Fig. 3 (n=10 for each group). (B) UCP2, UCP3, and PDK4 expression levels in skeletal muscles of weight-matched WT and Akt1−/− mice. Mice are as described for Fig. 4 (n=5 to 6 animals for each group). (C) UCP2, UCP3, and PDK4 expression levels in skeletal muscles of HFD-fed WT and Akt1−/− mice. Mice are as described for Fig. 1 (n=4 to 5 animals for each group). (D) Western blot for UCP3 in muscles from age-matched WT and Akt1−/− mice. (E) Palmitate oxidation rate of isolated soleus muscles from age-matched WT and Akt1−/− mice. Both WT and Akt1−/− mice were 10 weeks old and were fed NC (n=5 to 6 for each genotype). (F) Palmitate oxidation rate of isolated soleus muscles from weight-matched WT and Akt1−/− mice. WT mice were 10 weeks old, and Akt1−/− mice were 22 weeks old. All mice were fed NC (n=5 for each genotype). *, P < 0.05; **, P < 0.01 by the Student t test. All data are presented as means ± SEM.
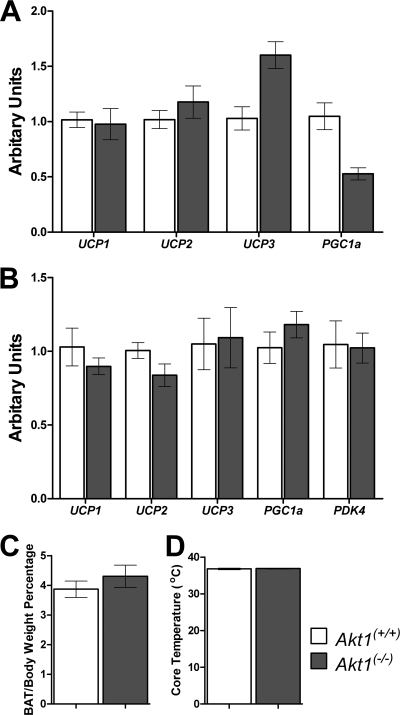
Induction of UCP1 in intramuscular brown adipocytes leads to protection from diet-induced obesity in mice (2); however, in these studies UCP1 mRNA was not detected in muscle samples (data not shown). Elevated heat production was observed in Akt1−/− mice under most conditions; however, the expression levels of genes encoding uncoupling proteins or the coactivator PGC-1α (peroxisome proliferator-activated receptor gamma, coactivator 1α) in brown adipose tissue were not changed in either age-matched or weight-matched Akt1−/− mice fed a normal chow diet (Fig. 8A and B). The brown adipose tissue weights and core temperatures from Akt1−/− mice were not different than age-matched controls (Fig. 8C and D).
Fig 8.
mRNA levels of uncoupling proteins are not altered in brown adipose tissue from Akt1−/− mice. (A) UCP1, UCP2, UCP3, and PGC1α expression in brown adipose tissue of age-matched young WT and Akt1−/− mice. Mice are as described for Fig. 3 (n=7 for each group). (B) UCP1, UCP2, UCP3, PGC1α, and PDK4 expression in brown adipose tissue of weight-matched WT and Akt1−/− mice. Mice are as described for Fig. 4 (n=5 to 6 animals for each group). (C and D) Brown adipose tissue (BAT) weight percentage of body weight and core temperature of age-matched young WT and Akt1−/− mice (n=5 to 6 animals for each group). All data are presented as means ± SEM.
Two pathways recognized to regulate mitochondrial number, activity, and efficiency in muscle are those dependent on peroxisome proliferator-activated receptor δ (PPARδ) and AMP-activated protein kinase (AMPK) (1, 29, 36, 39). However, the expression levels of PPARδ and its targets, adipose differentiation-related protein (ADRP), forkhead box O1 (FoxO1), and PGC1α, were comparable in skeletal muscle from Akt1−/− and control mice (data not shown) (28, 29). Similarly, AMPK activation as assessed by phosphorylation of AMPK and its target, acetyl-coenzyme A carboxylase (ACC), was indistinguishable in soleus and TA muscles between Akt1−/− and WT mice (data not shown). Lastly, muscle citrate synthase activity, an indication of muscle mitochondrial number, was not altered by germ line deletion of Akt1 (data not shown).
DISCUSSION
The recent epidemic of obesity and its associated conditions, cardiovascular diseases, cancer, and diabetes mellitus, has increased the demand for novel therapeutics targeted toward modulating appetite and/or energy metabolism. The search for clinically useful drugs has thus far met with limited success, and therefore the identification of novel potential targets remains of great interest. In this study, we showed that mice with germ line deletion of Akt1 displayed many of the features one would desire in individuals treated with an ideal antiobesity drug: a mild increase in metabolic rate, prevention of both diet- and age-related obesity, and protection from insulin resistance.
The optimal strategies for measurement and presentation of energy expenditure in mice are controversial, particularly when comparing animals with different body weights and body compositions (4, 23). Use of age-matched animals might overestimate the metabolic rate for mice with lower body weights, while comparing weight-matched animals might introduce artifacts related to aging, which leads to muscle mass loss and compromised mitochondrial function (30). This issue is particularly challenging when studying Akt1−/− mice on a C57BL/6J background, since these mice are born about 20% smaller than WT mice and remain so for life (6, 8). In order to be certain of the energetic effects of loss of Akt1, we used two approaches: (i) we compared Akt1−/− mice to control mice under as many conditions as feasible and (ii) we tried to dissociate the changes in body size from the body size by generating mice with tissue-specific loss of Akt1. Regarding the first approach, we compared the energy expenditures of Akt1−/− mice to age-matched as well as weight-matched controls, and we observed consistent outcomes for almost all assays. Although there were some quantitative differences, e.g., Akt1−/− mice showed milder effects on O2 consumption and CO2 production than weight-matched as opposed to age-matched mice (Fig. 4 and 5), the qualitative alterations were consistent. We also studied the mice under defined feeding conditions, in which they were deprived of food during the light cycle. In these experiments, once again the increase in metabolic rate in the Akt1−/− mice was evident independently of control group and, surprisingly, there was also higher locomotor activity during the dark cycle in the Akt1−/− mice (Fig. 6 and data not shown). In addition to age and size, body composition influences energy expenditure, and there is no consensus on the best normalization tool to use when expressing VO2 or VCO2 (4, 23). Under conditions of normal chow feeding, the body compositions of WT and Akt1−/− mice were indistinguishable, and thus energy expenditure values were similar when normalized to either body weight or lean mass. In the HFD studies, normalization of energy expenditure to body weight or to lean mass showed an increased VO2 in Akt1−/− mice (Fig. 1C), and so the choice of the correct normalization parameter was not an issue. To exclude the remote possibility that these phenotypes were caused by a locus or loci tightly linked to Akt1, we generated an independent Akt1−/− mouse line by breeding Akt1lox/lox mice to EIIa > Cre mice. These mice behaved similar to the original line generated: smaller body size and increased energy expenditure on a normal chow diet, an elevated energy expenditure, and protection from obesity when fed am HFD (Fig. 1F to I and data not shown). Interestingly, in the newly derived line, Akt1+/− mice displayed intermediate effects for most metabolic parameters (Fig. 1G to I), suggesting that Akt1 is regulatory and not just permissive in the control of energy metabolism. The slight quantitative differences in phenotypes between the two mouse lines were almost certainly due to their distinct genetic backgrounds. Lastly, we were unable to reproduce the increased VO2 and VCO2 in mice by deleting Akt1 selectively in brain, muscle, or liver tissue (Fig. 2 and data not shown); whereas these data did not allow dissociation of energy expenditure from body size, they suggested strongly that the increased metabolic rate is cell nonautonomous in muscle.
Lean mass, which is primarily skeletal muscle, contributes most of the energy expenditure during both rest and exercise (4). Several studies using mouse genetics have suggested that increasing mitochondria biogenesis in skeletal muscle leads to increased energy expenditure and protection from diet-induced obesity in mice (1, 29, 36, 39). Increased mitochondrial mass alone with preservation of normal function would be unlikely to influence metabolic rate, and in fact these genetic models also reveal increased expression of UCP3 and PDK4 in skeletal muscle (29, 39). Skeletal muscle from Akt1−/− mice had an increase in UCP3 mRNA comparable to that in transgenic mice protected from increases in adiposity, but there were no changes in the UCP3 protein. Consistent with this observation, the coupling efficiency was unchanged in isolated mitochondria from Akt1−/− skeletal muscle. Induction of UCP1, which is the major uncoupling protein in brown adipose tissue, in intramuscular brown adipocytes increases energy expenditure and prevents diet-induced obesity in mice (2); however, we did not observe increases in UCP1 in muscles or brown adipose tissue from Akt1−/− mice (Fig. 8A and B and data not shown). Phosphorylation of the canonical Akt target Forkhead box O 1 in brain and skeletal muscle was not altered in Akt1−/− mice compared to controls (data not shown), suggesting that this transcription factor is unlikely to be responsible for the energy expenditure phenotypes (17).
Mice deficient for Akt1 showed an elevation in the expression PDK4 as well as UCP3 in skeletal muscle (Fig. 7). PDK4, the major isoform in muscle, phosphorylates and suppresses the activity of the pyruvate dehydrogenase complex, which converts carbohydrate-derived pyruvate into acetyl coenzyme A (32). This has the effect of promoting fatty acid oxidation relative to carbohydrates. UCP3 and PDK4 are often coregulated as part of the transition to fatty acid oxidation, most notably during fasting or HFD feeding, but also upon exercise (21, 32–34). Coordinate increases in UCP3 and PDK4 expression levels in skeletal muscle also result from genetic manipulations that promote mitochondrial biogenesis (29, 39). Activation of PPARδ by overexpression or agonist treatment induces UCP3 and PDK4 expression levels and mitochondrial biogenesis, and it increases oxidative fiber composition, possibly through activation of AMPK (29, 39). Loss of S6K1 in mice results in increased muscle mitochondrial content, elevated energy expenditure, and protection from diet-induced obesity, an effect also linked to activation of AMPK in skeletal muscle (1, 36). We did not observe increases in mitochondrial content or activation of AMPK and PPARδ in skeletal muscle from Akt1−/− mice; in addition, the modest decreases in the cross-sectional areas of both type I and type II muscle fibers in Akt1−/− mice are proportional to body size (15).
It was reported recently that 5- to 6-month-old Akt1−/− mice, which were generated independently by another laboratory, had decreased blood glucose levels, improved glucose tolerance, and insulin sensitivity (5). A primary effect on pancreatic β-cells and abnormal insulin secretion was suggested to be responsible for most of this phenotype, although improved insulin sensitivity was also reported (5). We did not find differences in serum insulin levels in young Akt1−/− mice (8), and insulin levels tended to be lower in Akt1−/− mice after HFD feeding (Table 1). It is likely that the decrease in insulin resistance described by Buzzi et al. was secondary to increased energy expenditure and prevention of the increased adipose mass that normally accompanies aging.
In this study, we identified a novel function of Akt1 in the control of energy metabolism. Most tantalizing, the data reported here suggest that Akt1 might be a reasonable target for therapeutics aimed at the prevention of obesity. Compounds with relative specificity for individual Akt isoforms have already been developed (3, 26, 42). An important question is whether the isoform-specific roles of the Akt family in mice are recapitulated in humans; a recent report describing an association between an AKT1 gene G205T (rs1130214) polymorphism and VO2 in humans has suggested that this is the case (27).
ACKNOWLEDGMENTS
This work was supported by NIH grants RO1 DK56886 and PO1 DK49210 to M.J.B. The Mouse Phenotyping, Physiology and Metabolism Core and the Radioimmunoassay and Biomarker Core were supported by the Diabetes and Endocrinology Research Center, University of Pennsylvania (NIH DK-19525).
We thank Mary Selak, The Children's Hospital of Philadelphia, for help and suggestions on muscle mitochondrial analysis, and Ravindra Dhir, University of Pennsylvania, for suggestions on energy expenditure measurements and ex vivo fatty acid oxidation measurements.
Footnotes
Published ahead of print 28 October 2011
REFERENCES
- 1. Aguilar V, et al. 2007. S6 kinase deletion suppresses muscle growth adaptations to nutrient availability by activating AMP kinase. Cell Metab. 5:476–487 [DOI] [PubMed] [Google Scholar]
- 2. Almind K, Manieri M, Sivitz WI, Cinti S, Kahn CR. 2007. Ectopic brown adipose tissue in muscle provides a mechanism for differences in risk of metabolic syndrome in mice. Proc. Natl. Acad. Sci. U. S. A. 104:2366–2371 [DOI] [PMC free article] [PubMed] [Google Scholar]
- 3. Barnett SF, et al. 2005. Identification and characterization of pleckstrin-homology-domain-dependent and isoenzyme-specific Akt inhibitors. Biochem. J. 385:399–408 [DOI] [PMC free article] [PubMed] [Google Scholar]
- 4. Butler AA, Kozak LP. 2010. A recurring problem with the analysis of energy expenditure in genetic models expressing lean and obese phenotypes. Diabetes 59:323–329 [DOI] [PMC free article] [PubMed] [Google Scholar]
- 5. Buzzi F, et al. 2010. Differential effects of protein kinase B/Akt isoforms on glucose homeostasis and islet mass. Mol. Cell. Biol. 30:601–612 [DOI] [PMC free article] [PubMed] [Google Scholar]
- 6. Chen WS, et al. 2001. Growth retardation and increased apoptosis in mice with homozygous disruption of the Akt1 gene. Genes Dev. 15:2203–2208 [DOI] [PMC free article] [PubMed] [Google Scholar]
- 7. Cho H, et al. 2001. Insulin resistance and a diabetes mellitus-like syndrome in mice lacking the protein kinase Akt2 (PKB beta). Science 292:1728–1731 [DOI] [PubMed] [Google Scholar]
- 8. Cho H, Thorvaldsen JL, Chu Q, Feng F, Birnbaum MJ. 2001. Akt1/PKBα is required for normal growth but dispensable for maintenance of glucose homeostasis in mice. J. Biol. Chem. 276:38349–38352 [DOI] [PubMed] [Google Scholar]
- 9. Choi CS, et al. 2007. Overexpression of uncoupling protein 3 in skeletal muscle protects against fat-induced insulin resistance. J. Clin. Invest. 117:1995–2003 [DOI] [PMC free article] [PubMed] [Google Scholar]
- 10. Clapham JC, et al. 2000. Mice overexpressing human uncoupling protein-3 in skeletal muscle are hyperphagic and lean. Nature 406:415–418 [DOI] [PubMed] [Google Scholar]
- 11. Costford SR, Chaudhry SN, Crawford SA, Salkhordeh M, Harper ME. 2008. Long-term high-fat feeding induces greater fat storage in mice lacking UCP3. Am. J. Physiol. Endocrinol. Metab. 295:E1018–E1024 [DOI] [PubMed] [Google Scholar]
- 12. Dummler B, et al. 2006. Life with a single isoform of Akt: mice lacking Akt2 and Akt3 are viable but display impaired glucose homeostasis and growth deficiencies. Mol. Cell. Biol. 26:8042–8051 [DOI] [PMC free article] [PubMed] [Google Scholar]
- 13. Easton RM, et al. 2005. Role for Akt3/protein kinase Bγ in attainment of normal brain size. Mol. Cell. Biol. 25:1869–1878 [DOI] [PMC free article] [PubMed] [Google Scholar]
- 14. Garofalo RS, et al. 2003. Severe diabetes, age-dependent loss of adipose tissue, and mild growth deficiency in mice lacking Akt2/PKB beta. J. Clin. Invest. 112:197–208 [DOI] [PMC free article] [PubMed] [Google Scholar]
- 15. Goncalves MD, et al. 2010. Akt deficiency attenuates muscle size and function but not the response to ActRIIB inhibition. PLoS One 5:e12707. [DOI] [PMC free article] [PubMed] [Google Scholar]
- 16. Gonzalez E, McGraw TE. 2009. The Akt kinases: isoform specificity in metabolism and cancer. Cell Cycle 8:2502–2508 [DOI] [PMC free article] [PubMed] [Google Scholar]
- 17. Gross DN, Wan M, Birnbaum MJ. 2009. The role of FOXO in the regulation of metabolism. Curr. Diab. Rep. 9:208–214 [DOI] [PubMed] [Google Scholar]
- 18. Guan HP, Goldstein JL, Brown MS, Liang G. 2009. Accelerated fatty acid oxidation in muscle averts fasting-induced hepatic steatosis in SJL/J mice. J. Biol. Chem. 284:24644–24652 [DOI] [PMC free article] [PubMed] [Google Scholar]
- 19. Hamilton MT, Hamilton DG, Zderic TW. 2007. Role of low energy expenditure and sitting in obesity, metabolic syndrome, type 2 diabetes, and cardiovascular disease. Diabetes 56:2655–2667 [DOI] [PubMed] [Google Scholar]
- 20. He L, et al. 2010. The critical role of AKT2 in hepatic steatosis induced by PTEN loss. Am. J. Pathol. 176:2302–2308 [DOI] [PMC free article] [PubMed] [Google Scholar]
- 21. Hildebrandt AL, Pilegaard H, Neufer PD. 2003. Differential transcriptional activation of select metabolic genes in response to variations in exercise intensity and duration. Am. J. Physiol. Endocrinol. Metab. 285:E1021–E1027 [DOI] [PubMed] [Google Scholar]
- 22. Horvath TL, et al. 2003. Uncoupling proteins-2 and 3 influence obesity and inflammation in transgenic mice. Int. J. Obes. Relat. Metab. Disord. 27:433–442 [DOI] [PubMed] [Google Scholar]
- 23. Kaiyala KJ, et al. 2010. Identification of body fat mass as a major determinant of metabolic rate in mice. Diabetes 59:1657–1666 [DOI] [PMC free article] [PubMed] [Google Scholar]
- 24. Leavens KF, Easton RM, Shulman GI, Previs SF, Birnbaum MJ. 2009. Akt2 is required for hepatic lipid accumulation in models of insulin resistance. Cell Metab. 10:405–418 [DOI] [PMC free article] [PubMed] [Google Scholar]
- 25. Le Lay J, et al. 2009. CRTC2 (TORC2) contributes to the transcriptional response to fasting in the liver but is not required for the maintenance of glucose homeostasis. Cell Metab. 10:55–62 [DOI] [PMC free article] [PubMed] [Google Scholar]
- 26. Lindsley CW, et al. 2005. Allosteric Akt (PKB) inhibitors: discovery and SAR of isozyme selective inhibitors. Bioorg. Med. Chem. Lett. 15:761–764 [DOI] [PubMed] [Google Scholar]
- 27. McKenzie JA, Witkowski S, Ludlow AT, Roth SM, Hagberg JM. 2011. AKT1 G205T genotype influences obesity-related metabolic phenotypes and their responses to aerobic exercise training in older Caucasians. Exp. Physiol. 96:338–347 [DOI] [PMC free article] [PubMed] [Google Scholar]
- 28. Nahle Z, et al. 2008. CD36-dependent regulation of muscle FoxO1 and PDK4 in the PPAR delta/beta-mediated adaptation to metabolic stress. J. Biol. Chem. 283:14317–14326 [DOI] [PMC free article] [PubMed] [Google Scholar]
- 29. Narkar VA, et al. 2008. AMPK and PPARδ agonists are exercise mimetics. Cell 134:405–415 [DOI] [PMC free article] [PubMed] [Google Scholar]
- 30. Paradies G, Petrosillo G, Paradies V, Ruggiero FM. 2010. Oxidative stress, mitochondrial bioenergetics, and cardiolipin in aging. Free Radic. Biol. Med. 48:1286–1295 [DOI] [PubMed] [Google Scholar]
- 31. Peng XD, et al. 2003. Dwarfism, impaired skin development, skeletal muscle atrophy, delayed bone development, and impeded adipogenesis in mice lacking Akt1 and Akt2. Genes Dev. 17:1352–1365 [DOI] [PMC free article] [PubMed] [Google Scholar]
- 32. Pilegaard H, Neufer PD. 2004. Transcriptional regulation of pyruvate dehydrogenase kinase 4 in skeletal muscle during and after exercise. Proc. Nutr. Soc. 63:221–226 [DOI] [PubMed] [Google Scholar]
- 33. Samec S, Seydoux J, Dulloo AG. 1999. Post-starvation gene expression of skeletal muscle uncoupling protein 2 and uncoupling protein 3 in response to dietary fat levels and fatty acid composition: a link with insulin resistance. Diabetes 48:436–441 [DOI] [PubMed] [Google Scholar]
- 34. Samec S, Seydoux J, Dulloo AG. 1998. Role of UCP homologues in skeletal muscles and brown adipose tissue: mediators of thermogenesis or regulators of lipids as fuel substrate? FASEB J. 12:715–724 [DOI] [PubMed] [Google Scholar]
- 35. Slentz CA, Houmard JA, Kraus WE. 2009. Exercise, abdominal obesity, skeletal muscle, and metabolic risk: evidence for a dose response. Obesity (Silver Spring) 17(Suppl. 3):S27–S33 [DOI] [PMC free article] [PubMed] [Google Scholar]
- 36. Um SH, et al. 2004. Absence of S6K1 protects against age- and diet-induced obesity while enhancing insulin sensitivity. Nature 431:200–205 [DOI] [PubMed] [Google Scholar]
- 37. Venables MC, Jeukendrup AE. 2009. Physical inactivity and obesity: links with insulin resistance and type 2 diabetes mellitus. Diabetes Metab. Res. Rev. 25(Suppl. 1):S18–S23 [DOI] [PubMed] [Google Scholar]
- 38. Wan M, et al. 2011. Postprandial hepatic lipid metabolism requires signaling through Akt2 independent of the transcription factors FoxA2, FoxO1 and SREBP1c. Cell Metab. 14:516–527 [DOI] [PMC free article] [PubMed] [Google Scholar]
- 39. Wang YX, et al. 2004. Regulation of muscle fiber type and running endurance by PPARδ. PLoS Biol. 2:e294. [DOI] [PMC free article] [PubMed] [Google Scholar]
- 40. Whiteman EL, Cho H, Birnbaum MJ. 2002. Role of Akt/protein kinase B in metabolism. Trends Endocrinol. Metab. 13:444–451 [DOI] [PubMed] [Google Scholar]
- 41. Yang ZZ, et al. 2005. Dosage-dependent effects of Akt1/protein kinase Bα (PKBα) and Akt3/PKBγ on thymus, skin, and cardiovascular and nervous system development in mice. Mol. Cell. Biol. 25:10407–10418 [DOI] [PMC free article] [PubMed] [Google Scholar]
- 42. Zhao Z, et al. 2008. Development of potent, allosteric dual Akt1 and Akt2 inhibitors with improved physical properties and cell activity. Bioorg. Med. Chem. Lett. 18:49–53 [DOI] [PubMed] [Google Scholar]


