Abstract
Developmental and homeostatic remodeling of cellular organelles is mediated by a complex process termed autophagy. The cohort of proteins that constitute the autophagy machinery functions in a multistep biochemical pathway. Though components of the autophagy machinery are broadly expressed, autophagy can occur in specialized cellular contexts, and mechanisms underlying cell-type-specific autophagy are poorly understood. We demonstrate that the master regulator of hematopoiesis, GATA-1, directly activates transcription of genes encoding the essential autophagy component microtubule-associated protein 1 light chain 3B (LC3B) and its homologs (MAP1LC3A, GABARAP, GABARAPL1, and GATE-16). In addition, GATA-1 directly activates genes involved in the biogenesis/function of lysosomes, which mediate autophagic protein turnover. We demonstrate that GATA-1 utilizes the forkhead protein FoxO3 to activate select autophagy genes. GATA-1-dependent LC3B induction is tightly coupled to accumulation of the active form of LC3B and autophagosomes, which mediate mitochondrial clearance as a critical step in erythropoiesis. These results illustrate a novel mechanism by which a master regulator of development establishes a genetic network to instigate cell-type-specific autophagy.
INTRODUCTION
Cellular differentiation requires massive remodeling of subcellular structures to accommodate specialized functions of cell progeny. For example, the differentiation of committed hematopoietic progenitors into erythrocytes requires disposal of mitochondria (mitophagy) and nuclei (enucleation), which are not required for erythrocyte function. The process whereby cells consume organelles is termed autophagy (29). Autophagy mediates morphological remodeling in developmental and pathophysiological contexts. A cohort of autophagy proteins functions in a multistep reaction to generate an autophagosome that engulfs damaged organelles (53). The subsequent fusion of the loaded autophagosome with the lysosome results in proteolysis of the engulfed proteins.
Core components of the autophagy machinery are broadly expressed, and therefore diverse cell types are competent to execute autophagy. A recent proteomics analysis expanded the repertoire of proteins linked to autophagy and illustrated their complex interaction networks (2). Many questions remain unanswered regarding how this complex network of apparently ubiquitous autophagy components is established and what role cell-type-specific factors have in instigating and regulating autophagy.
Since autophagy is a critical step in erythrocyte development (19, 39, 41, 57), it is particularly instructive to analyze cell-type-specific autophagy in this context. Targeted deletion of the BCL-2 family member NIX yields anemia, impaired erythroid maturation, and impaired mitophagy during terminal erythroid differentiation (39, 41). Furthermore, a conditional knockout in hematopoietic cells of Atg7, which encodes a protein resembling a ubiquitin-activating enzyme, yields severe anemia, defective erythropoiesis, and lethality shortly after birth (31). The defective mitophagy in Atg7 null mice led to erythroblast and erythrocyte cell death, thereby explaining the anemia. In addition, erythrocyte maturation is defective in UNC51-like kinase (Atg1) mutant mice (19). Ribosomes and mitochondria are retained in the Atg1 mutant reticulocytes. While these studies provide strong evidence that autophagy is crucial for erythropoiesis and implicate NIX, ATG7, and ATG1 as key mediators, it will be crucial to establish how autophagy is instigated during erythroid maturation and other cell-type-specific processes and to elucidate the requisite regulatory factors/signals.
As nutrient starvation induces autophagy (28), cellular differentiation-linked autophagy might be a consequence of dramatically reduced metabolic activity and/or precursor cell proliferative potential. The primary instigators of differentiation would not, therefore, directly induce the synthesis, assembly, and function of autophagy components even though the function of this machinery is required for the differentiation program. Alternatively, factors/signals instigating differentiation might directly control the production of autophagy proteins transcriptionally or posttranscriptionally as an essential step in establishing the requisite genetic/protein network for differentiation.
Broadly expressed transcription factors, including ATF4 (37), E2F1 (35), and p53 (23), are implicated in regulating autophagy gene transcription. Many questions remain unanswered regarding mechanisms underlying autophagy gene expression in cell-type-specific contexts. In skeletal muscle, the forkhead protein FoxO3 occupies autophagy gene (Atg12l, LC3b, Bnip3, and Gabarapl1) promoters (24, 58). Constitutively active FoxO3 increases their expression 3- to 4-fold, while knocking down FoxO3 or expressing dominant negative FoxO3 reduces LC3 levels. FoxO3 also functions as a mediator of antioxidant signaling in erythroid cells (25, 55), but potential relationships between FoxO3 and autophagy in erythroid cells have not been described. Select autophagy genes are also activated by transcription factor EB (TFEB), a member of the microphthalmia-transcription factor E (MiT/TFE) family (42). TFEB overexpression induces UVRAG, WIPI, MAP1LC3B, SQSTM1, VPS11, and ATG9B expression, while small interfering RNA (siRNA)-mediated knockdown of TFEB downregulates these genes (42). TFEB function in erythroid cells has not been studied.
Through mining of our GATA factor genomic data sets, we discovered that the master regulator of hematopoiesis, GATA-1 (4), occupies multiple autophagy genes in erythroid cells. Using a genetic complementation assay in GATA-1-null erythroid precursor cells (10, 11), we demonstrate that GATA-1 directly activates transcription of select autophagy and lysosomal genes and massively induces autophagosomes. GATA-1, the founding member of the GATA factor family (8, 45), is required for erythrocyte, platelet, mast cell, and eosinophil development (12, 27, 34, 43, 48, 50, 54). No prior studies have linked GATA-1 or any other GATA factor to the induction of autophagy. These results demonstrate how an essential developmental regulator can directly induce autophagy as a key step in establishing the developmental program.
MATERIALS AND METHODS
Cell culture.
G1E-ER-GATA-1 (where ER-GATA-1 represents GATA-1 fused to the estrogen receptor [ER] ligand binding domain) and G1E-ER-GATA-1(V205G) (harboring a V205G mutation in GATA-1) cells (15) were derived from murine GATA-1-null G1E proerythroblast-like cells (51) and were cultured in Iscove's modified Dulbecco's medium (IMDM; Gibco) containing 15% fetal bovine serum (FBS; Gemini), 2% penicillin-streptomycin (Gibco), 2 U/ml erythropoietin, 120 nM monothioglycerol (Sigma), 0.6% conditioned medium from a Kit ligand-producing CHO cell line, and 1 μg/ml puromycin (Gemini). To induce ER-GATA-1 activity, cells were treated with 1 μM β-estradiol (Steraloids, Inc.). G1E cells were cultured in the same medium as G1E-ER-GATA-1 without puromycin. Cells were grown in a humidified incubator at 37°C with 5% carbon dioxide.
To differentiate erythroblasts from human peripheral blood mononuclear cells (PBMCs), fresh blood was collected in a heparin-containing tube, diluted with 2 to 4 volumes of phosphate-buffered saline (PBS), and overlaid on Ficoll-Paque Plus (GE Healthcare). Samples were centrifuged at 400 × g for 30 min at room temperature. The upper layer was removed, and mononuclear cells were washed twice with PBS. Mononuclear cells were cultured in StemSpan (Stemcell Technologies) containing stem cell factor (SCF; 100 ng/ml), Flt3-L (33.3 ng/ml), interleukin-3 (IL-3; 13.3 ng/ml), BMP4 (13.3 ng/ml), erythropoietin (EPO; 2.67 U/ml), and 1 μM hydrocortisone (Sigma) for 7 days. Cells were then cultured in StemSpan with SCF (40 ng/ml), IGF-1 (40 ng/ml), IL-3 (13.3 ng/ml), BMP4 (13.3 ng/ml), EPO (3.3 U/ml), and hydrocortisone (1 μM) for another 7 days. Fresh medium was added every other day, and the cell density was maintained at ∼3 × 10⁵/ml. After 14 days, cells were collected by centrifugation at 2,500 × g for 10 min, washed twice with PBS, and cross-linked with 1% formaldehyde in PBS for 10 min. The reaction was stopped by the addition of glycine at a final concentration of 125 mM. After 5 min, cells were washed twice with ice-cold PBS (Ca2+/Mg2+-free), collected by centrifugation at 2,000 × g at 4°C, and flash frozen in liquid nitrogen. All cytokines were from Peprotech, with the exception of BMP4, which was from R&D Systems.
Quantitative real-time RT-PCR.
Total RNA was purified with TRIzol (Invitrogen), and 1.5 μg of RNA was used to prepare cDNA by annealing with 250 ng of a 5:1 mixture of random hexamer and oligo(dT) primers heated at 68°C for 10 min. This step was followed by incubation with murine Moloney leukemia virus reverse transcriptase (Invitrogen) combined with 10 mM dithiothreitol (DTT), RNasin (Promega), and 0.5 mM deoxynucleoside triphosphates (dNTPs) at 42°C for 1 h. The mixture was diluted and heat inactivated at 95°C for 5 min. Real-time PCR (RT-PCR) mixtures (20 μl) contained 2 μl of cDNA, appropriate primers, and 10 μl of SYBR green master mix (Applied Biosystems). Product accumulation was monitored by SYBR green fluorescence. Relative expression was determined from a standard curve of serial dilutions of cDNA samples. mRNA levels were normalized to the 18S rRNA level. The ΔΔCT (where CT is threshold cycle) method was used to quantitatively compare Atg8 homolog gene expression.
Quantitative chromatin immunoprecipitation (ChIP) assay.
Immunoprecipitation of chromatin complexes from G1E-ER-GATA-1 cells was conducted as described previously (13). All samples were cross-linked with 1% formaldehyde for 10 min. ER-GATA-1 was immunoprecipitated using rabbit polyclonal anti-GATA-1 antibody (14). Rabbit preimmune (PI) serum (Covance) was used as a control. Samples were analyzed by quantitative real-time PCR (ABI StepOnePlus). Product was measured by SYBR green fluorescence, and the amount of product was determined relative to a standard curve generated from a serial dilution of input chromatin. Analysis of dissociation curves showed that primer pairs generated single products.
ChIP-seq and data processing.
ChIP assays were conducted with cross-linked human peripheral blood mononuclear cell-derived erythroblasts as described previously (32). Chromatin from 108 cells was incubated with 60 μl of rabbit polyclonal anti-GATA-1 antibody (14). Following overnight incubation at 4°C, protein/DNA complexes were captured with 100 μl of Staph-Seq (Sigma). After samples were washed, cross-links were reversed, DNA was purified, and quantitative PCR (qPCR) was used to confirm enrichment of target sequences in ChIP versus input samples. Libraries were created as described previously, with minor modifications (32). Gel size selection of the 150- to 450-bp fraction was conducted after the adapter ligation step, followed by 18 amplification cycles. ChIP-seq libraries were analyzed with an Illumina GAIIx. Sequence reads were aligned to the University of California, Santa Cruz (UCSC), human genome assembly hg19 using the Eland pipeline (Illumina). Uniquely aligned sequences were used to identify GATA-1 occupancy peaks with Sole-Search, version 2 (http://chipseq.genomecenter.ucdavis.edu/cgi-bin/chipseq.cgi) (3). Peaks were called with an alpha value of 0.001 and a false discovery rate (FDR) of 0.0001.
RNA interference.
Dharmacon siGENOME SmartPools against mouse Atg4b, Foxo3, and Tcfeb were used with nontargeting siRNA as a control. siRNA was transfected into 3 × 10⁶ of G1E-ER-GATA-1 cells with an Amaxa Nucleofector (Amaxa, Inc.) as described previously (21). siRNA was transfected twice, at 0 and 24 h. Cells were treated with β-estradiol at 6 h and harvested at 48 h.
Protein analysis.
Cells were treated with β-estradiol for 0, 24, and 48 h. Equal numbers of cells were lysed with radioimmunoprecipitation assay (RIPA) buffer (150 mM NaCl, 1.0% NP-40, 0.5% sodium deoxycholate, 0.1% sodium dodecyl sulfate, 1 mM EDTA, and 50 mM Tris-HCl [pH, 8.0], 10% glycerol) containing 2 mg/ml leupeptin, 5 mM dithiothreitol, and 0.5 mM phenylmethylsulfonyl fluoride (PMSF). For whole-cell protein samples, identical numbers of cells were boiled for 10 min in SDS sample buffer (25 mM Tris, pH 6.8, 2% β-mercaptoethanol, 3% SDS, 0.005% bromophenol blue, and 5% glycerol). Samples were resolved by SDS-PAGE, and proteins were measured by semiquantitative Western blotting with ECL Plus (GE Healthcare). GATA-1 rat monoclonal antibody (SC-265) was from Santa Cruz Biotechnology. LC3 mouse monoclonal antibody (M115-3), LC3 rabbit polyclonal antibody (PM036), GABARAP mouse monoclonal antibody (M135-3), and ATG4B mouse monoclonal antibody (M134-3) (Medical and Biological Laboratories) were used.
Immunofluorescence.
To detect endogenous LC3B, cells were cytospun and fixed with 3.7% paraformaldehyde in PBS for 10 min at room temperature. Slides were washed with PBS, and cells were permeabilized using 0.2% Triton X-100 in PBS for 15 min at room temperature. After a washing step, slides were blocked with 5% FBS–2% bovine serum albumin (BSA) in PBS for 1 h at 37°C and then incubated with LC3 rabbit polyclonal antibody (Medical and Biological Laboratories) in 2% BSA overnight at 4°C. After being washed, slides were incubated with Alexa Fluor 488–goat anti-rabbit IgG antibody (Invitrogen) for 1 h at 37°C. Slides were washed and mounted using Vectashield mounting medium with 4′,6′-diamidino-2-phenylindole (DAPI; Vector Laboratories, Inc.). Cells were photographed using a 100× (numerical aperture, 1.4) oil objective (Olympus IX2-UCB). Two modes of quantitation were utilized. Cells containing more than three LC3-positive punctate structures were scored as autophagosome-positive cells. Second, cells containing one or more autophagosomes were scored for the number of autophagosomes per cell.
Primers.
The following primers were used for real-time RT-PCR: 18S rRNA mRNA, CGCCGCTAGAGGTGAAATTCT and CGAACCTCCGACTTTCGTTCT; βmajor mRNA, TTTAACGATGGCCTGAATCACTT and CAGCACAATCACGATCATATTGC; Lyl1 mRNA, CCTGACCTGGACTGACAAACCT and CACATGGACCCCACGGATA; Atg3 mRNA, CCATTGAAAACCATCCTCATCTC and GCCTTCTGCAACTGTCTCAATAATT; Atg4b mRNA, GGGAACTGGCCCTACTTCAGA and TCCACCTCCAATCTCGACCTA; Atg5 mRNA, GGACAGCTGCACACACTTGG and TGGCTCTATCCCGTGAATCAT; Atg7 mRNA, GGCCTTTGAGGAATTTTTTGG and ACGTCTCTAGCTCCCTGCATG; Atg12 mRNA, TGAATCAGTCCTTTGCCCCT and CATGCCTGGGATTTGCAGT; Atg16l1 mRNA, GCCCAGTTGAGGATCAAACAC and CTGCTGCATTTGGTTGTTCAG; Map1lc3a mRNA, GTTGGTCAAGATCATCCGGC and CAGCGATGGGTGTGGAGAC; Map1lc3b mRNA, GTGGAAGATGTCCGGCTCAT and TGGTCAGGCACCAGGAACTT; Gabarap mRNA, AGGAGCATCCGTTCGAGAAG and CCAGGTCTCCTATCCGAGCTT; Gabarapl1 mRNA, GACCTCACTGTTGGCCAGTTC and GTGGGAGGGATGGTGTTGTT; Gate-16 mRNA, TCAGTTCATGTGGATCATCAGGA and TCCCATAGTTAGGCTGGACTGTG; Fog1 mRNA, CCTTGCTACCGCAGTCATCA and ACCAGATCCCGCAGTCTTTG; Atp6v0e mRNA, TGGTTTATCCCCAAGGGTCC and TTGAGCTGTGCCAGAATTGC; Clcn7 mRNA, ATACAACTCCATGGCCGCAG and GGCCGAGAGTCATGGGATT; Ctsb mRNA, AGTCAACGTGGAGGTGTCTGC and CAGAAGCTCCATGCTCCAGAG; Lamp1 mRNA, ACCTGTCGAGTGGCAACTTCA and GGGCACAAGTGGTGGTGAG; Neu1 mRNA, ACAGAGATGTTTGCCCCTGG and AAGACCCCATCTCGCTCCA; Tcfeb mRNA, CCCTGAGATGCAGATGCCTAA and TGCTGGTGACACCCACCAT; Foxo3 mRNA, CAAGGATAAGGGCGACAGCA and CCCGTGCCTTCATTCTGAA; Bnip3l mRNA, CGTCTTCCATCCACAATGGAG and TTGTGGTGAAGGGCTGTCAC. For ChIP analysis the following primers were used: HS2(GATA), AGGGTGTGTGGCCAGATGTT and ACCCAGATAGCACTGATCACTCAC; Necdin promoter, GGTCCTGCTCTGATCCGAAG and GGGTCGCTCAGGTCCTTACTT; Map1lc3a promoter, AGTCCCTCTATCCCCTCCACC and GGGAATGTTACCGAGGGTCAG; Map1lc3a(+11.1 kb), CCCCAGCTCAGGACAACAA and TGCTGCCACTACTGCCACC; Map1lc3b(−1.5 kb), CTGCATCTCCCTTCTGGACACT and CATCCTAGCACACTGGAGACTGAA; Map1lc3b promoter, TCTGAGAAGGGACAGCTGAGATAA and GTGAGCAATCAGACTGTGTCCAG; Map1lc3b intron 1, CCAGTGGGATATTGGTCTCG and CGAAGGACACAGCCAAGC; Gabarap(−24.5 kb), CGTGTCCTAGCTTTGGCCC and TCGTTAGACGTGGGACCGTAC; Gabarap promoter, CTGGATGGAGTCCCTGATGG and CTCCAGCTGTATGCCCTTCC; Gabarap(+29 kb), AACTTCAGTCGTCGCTGGTTACT and AACTTCAGTCGTCGCTGGTTACT; Gabarapl1 promoter, CTCTTGGGAAAAGCCACCC and GCCGCACTACGTGGCTAAAC; Gabarapl1 intron 1, GGAGGTCCAGCAAGAGAAAGC and GGAATAGTTAGCTCTCTTCTTCCTCATAG; Gate-16(−10.6 kb), TGAAGGGAGTGGCTTCTGGT and GCTGCCCTTTTGTCCCTCTT; Gate-16 promoter, AGGGTTAGTGCCGAGCCAC and GGCGAAGTGCCAGTGTCAG; Gate-16(+26.5 kb), GACACTAAAGACAATCAAACCAGGC and CCGTCTTTTCCTACCACACAGAG.
ChIP-seq data accession number.
The ChIP-seq data have been deposited in the NIH Gene Expression Omnibus (GEO) database under accession numberGSE32491.
RESULTS AND DISCUSSION
Genome-wide analysis of GATA-1 chromatin occupancy in primary human erythroblasts.
Genome-wide studies of GATA-1 chromatin occupancy have analyzed endogenous GATA-1 in K562 erythroleukemia cells (9) and biotinylated GATA-1 in MEL cells (5, 56). To develop additional mechanistic insights, we conducted ChIP-seq with endogenous GATA-1 in primary human erythroblasts differentiated ex vivo from peripheral blood mononuclear cells (PBMCs). Immunoprecipitated DNA from two independent primary erythroblast cultures, each differentiated from a unique PBMC sample, was analyzed by massively parallel sequencing. Sequences were mapped to the UCSC human genome assembly hg19. Peak calling analysis of the individual replicates with the Sole-Search utility with a false discovery rate of 0.001 yielded 5,939 and 8,573 peaks for the two samples. GATA-1 occupied established GATA-1-activated (β-globin and PPOX) and -repressed target genes (GATA2 and LYL1) (Fig. 1A) with patterns similar or identical to those observed in K562 cells (9). To assess reproducibility of the ChIP-seq data from the two independent primary erythroblast cultures, we compared the full data sets and also the top 40% of each to the full additional data set (Fig. 1B). This analysis revealed 86% identity, consistent with expectations for replicate analyses with identical samples.
Fig 1.
GATA-1 ChIP-seq with primary human erythroblasts derived from peripheral blood mononuclear cells (PBMC). (A) Representative ChIP-seq profiles of GATA-1-activated (β-like globin genes and PPOX) and -repressed (GATA2 and LYL1) genes. Chr, chromosome. (B) Comparison of GATA-1 ChIP-seq data from two independent primary erythroblast cultures differentiated from distinct PBMC samples. Rep, replicate. (C) Location analysis of GATA-1 peaks using the cis-Regulatory Element Annotation System (http://ceas.cbi.pku.edu.cn/). UTR, untranslated region. (D) Comparison of primary human erythroblast and K562 cell GATA-1 occupancy peaks. (E) Gene ontology analysis of genes occupied by GATA-1 in both primary human erythroblasts and K562 cells (K562-primary erythroblast-shared genes) versus those occupied by GATA-1 only in K562 cells (K562-unique genes). Unique GO terms, GO terms diagnostic of only one of the gene categories; common GO terms; GO terms diagnostic of both gene categories.
All sequence reads from the two biological replicates were merged and subjected to peak calling with a false discovery rate of 0.0001, which yielded 13,100 peaks. Location analysis conducted with these peaks using the cis-Regulatory Element Annotation System (CEAS [http://ceas.cbi.pku.edu.cn]) revealed GATA-1 occupancy predominantly at sites >1 kb away from RefSeq genes (“enhancer”) (44%) and introns (43%) (Fig. 1C). Only 7% of the GATA-1 occupancy sites mapped to proximal promoters (<1 kb upstream of the RefSeq 5′ start) (Fig. 1C). The patterns of GATA-1 occupancy sites with respect to gene features in the primary cells were indistinguishable from those of the prior K562 cell GATA-1 data set.
The prior K562 cell ChIP-seq analysis revealed a rich set of GATA factor targets and important insights for the control of hematopoiesis. K562 cells resemble primitive erythroid cells and are transformed, and therefore the GATA-1 genetic network in K562 cells is likely to differ from that of definitive/primary cells. We conducted bioinformatic analysis to compare the K562 and primary cell data sets. GATA-1 peaks in primary erythroblasts were ranked and truncated to yield an equivalent number of peaks as for the K562 cells (5,749). Comparison of the 5,749 GATA-1 peaks revealed 35% overlap (Fig. 1D). Based on the ENCODE overlap rule, the top 40% of the peaks was compared to the entire peak set for the other cell type, which revealed 50 to 54% overlap. Gene ontology (GO) analysis was conducted to compare the cohort of genes occupied by GATA-1 in both K562 cells and primary erythroblasts versus genes occupied by GATA-1 solely in K562 cells. This analysis indicated that genes occupied by GATA-1 in both K562 cells and primary erythroblasts exhibited characteristic gene ontology functions including hematopoiesis and porphyrin metabolism. Several unique functional categories were assigned to genes occupied by GATA-1 only in K562 cells (Fig. 1E). In aggregate, the bioinformatic analysis highlighted major similarities in the genes occupied in the two systems, as well as certain significant differences.
GATA-1 directly regulates autophagy gene expression.
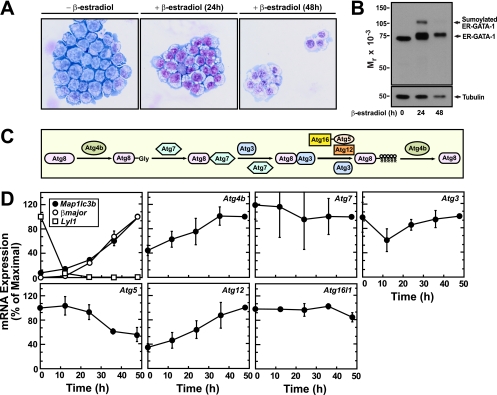
Included within the K562 and primary erythroblast ChIP-seq data sets were genes encoding components of the autophagy machinery. As autophagy is important for erythropoiesis and as the factors/signals that instigate autophagy during erythropoiesis are unknown, we further evaluated the GATA-1 link to autophagy gene expression/function. We used a genetic complementation system consisting of GATA-1-null erythroid precursor cells that stably express a conditionally active allele of GATA-1 (G1E-ER-GATA-1 cells) to analyze mechanisms underlying erythropoiesis-associated autophagy. β-Estradiol treatment of these cells activates ER-GATA-1 and induces erythroid maturation characterized by normal morphological changes (Fig. 2A) and recapitulation of a normal erythroid transcriptional profile (15, 52). ER-GATA-1 is expressed in uninduced and induced G1E-ER-GATA-1 cells (Fig. 2B) but requires β-estradiol for its activity to regulate target genes.
Fig 2.
Differential expression of autophagy genes during ER-GATA-1-induced G1E-ER-GATA-1 cell maturation. (A) Wright stain analysis of G1E-ER-GATA-1 cell morphology after 0, 24, or 48 h of treatment with β-estradiol. (B) Western blot analysis of ER-GATA-1 in boiled whole-cell samples from untreated and β-estradiol-treated G1E-ER-GATA-1 cells. (C) Biochemical pathway of ATG8 conjugation system. (D) Real-time RT-PCR analysis of gene expression in G1E-ER-GATA-1 cells following β-estradiol-induced activation of ER-GATA-1 for various times (mean ± standard error; 3 independent experiments). βmajor and Lyl1 represent established GATA-1-activated and -repressed genes, respectively.
We tested whether genes encoding components of the autophagy machinery (autophagy genes) (Fig. 2C) are differentially expressed during erythroid maturation of G1E-ER-GATA-1 cells. Quantitative analysis revealed ER-GATA-1-mediated activation of Map1lc3b, Atg4b, and Atg12 and repression of Atg5, while Atg3, Atg7, and Atg16l1 expression levels were not significantly affected (Fig. 2D). The kinetics of ER-GATA-1-mediated activation of Map1lc3b was indistinguishable from that of βmajor, a direct GATA-1 target gene (Fig. 2D).
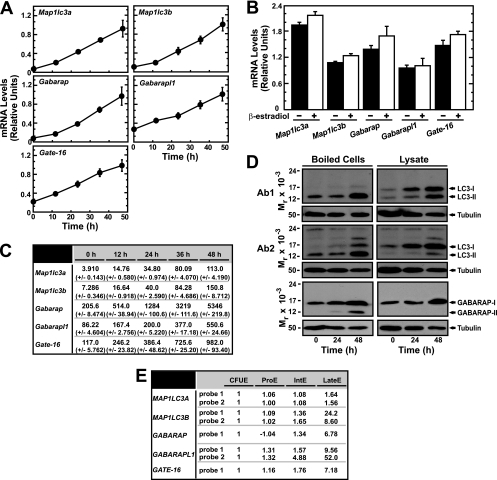
Multiple Atg8 homologs exist, including Map1lc3a, Map1lc3b, Gabarap, Gabarapl1, and Gate-16. These genes and their respective proteins have not been studied in erythroid cells. We tested whether ER-GATA-1 uniquely induces Map1lc3b or if other homologs are also regulated. ER-GATA-1 activated Map1lc3a, Map1lc3b, Gabarap, Gabarapl1, and Gate-16 expression with similar kinetics (Fig. 3A). As a control, we tested whether β-estradiol alters autophagy gene expression in G1E cells lacking ER-GATA-1, and the expression of these genes was unaffected (Fig. 3B). Based on the values calculated by the comparative CT method from real-time RT-PCR, Gabarap, Gabarapl1, and Gate-16 transcripts were most abundant. Map1lc3a and Map1lc3b were also moderately abundant (Fig. 3C).
Fig 3.
GATA-1-mediated control of genes encoding ATG8 homologs. (A) Real-time RT-PCR analysis of mammalian ATG8 homolog transcript levels in G1E-ER-GATA-1 cells following activation of ER-GATA-1 for various times (mean ± standard error; 3 independent experiments). (B) Real-time RT-PCR analysis of mammalian ATG8 homolog transcript levels in β-estradiol-treated (24 h) G1E cells lacking ER-GATA-1 (mean ± standard error; 3 independent experiments). (C) Quantitative analysis of ATG8 homolog transcript levels by the ΔΔCT method using primers with indistinguishable efficiencies in G1E-ER-GATA-1 cells (mean ± standard error; 3 independent experiments). (D) Semiquantitative Western blot analysis of LC3B and GABARAP from G1E-ER-GATA-1 cells containing activated ER-GATA-1. Representative images are shown from two to three independent experiments. (E) Expression levels of Atg8 homologs during primary human erythroid differentiation. Data were mined from the HEM database (https://cellline.molbiol.ox.ac.uk/eryth/index.html). The expression of the respective genes in erythroid CFU (CFUE) cells was designated 1. Other values represent the expression level relative to that of CFUE cells. ProE, proerythroblast; IntE, intermediate erythroblast; lateE, late erythroblast.
We tested whether ER-GATA-1-mediated induction of autophagy gene expression increases the steady-state levels of autophagy proteins. As the precise method of generating protein extracts influences the relative recovery of distinct LC3 species (30), we conducted semiquantitative Western blotting with boiled cells and whole-cell lysates. Western blot analysis of boiled cells revealed considerably more of the lipidated form of LC3 (LC3-II) than the nonlipidated form (LC3-I). Phosphatidylethanolamine (PE) conjugation of LC3 (lipidation) is important for its association with the autophagosome membrane (17). ER-GATA-1 induced LC3-I and LC3-II (Fig. 3D). ER-GATA-1-mediated induction of LC3-I and LC3-II was also apparent with whole-cell lysates although LC3-I was the more abundant species detected under these conditions (Fig. 3D). Two distinct anti-LC3 antibodies yielded indistinguishable results (Fig. 3D). ER-GATA-1 also induced the LC3 homolog GABARAP and its lipidated form (GABARAP-II) (Fig. 3D).
To determine whether ER-GATA-1-dependent activation of autophagy genes/proteins is relevant to human erythropoiesis, we mined an expression database of gene expression during primary human erythroblast maturation ex vivo (Human Erythroblast Maturation [HEM] Database [https://cellline.molbiol.ox.ac.uk/eryth/index.html]) (26). In accordance with our results, expression of Atg8 homologs was induced upon erythroblast differentiation (Fig. 3E). Thus, GATA-1 activates select autophagy genes in murine erythroid cells, and their expression increases during normal human erythropoiesis.
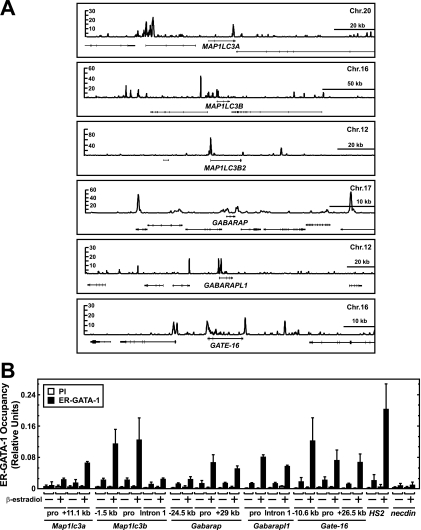
Mining the primary human erythroblast ChIP-seq data set revealed GATA-1 occupancy of sites at and near multiple autophagy genes (Fig. 4A). Quantitative ChIP analysis of ER-GATA-1 chromatin occupancy in G1E-ER-GATA-1 cells at sites corresponding to the human ChIP-seq peaks confirmed occupancy at these loci (Fig. 4B). Combined with the identical kinetics of ER-GATA-1 activation of autophagy genes and βmajor (Fig. 2D), these results indicate that GATA-1 directly activates autophagy gene transcription.
Fig 4.
GATA-1 occupies genes encoding ATG8 homologs in primary human erythroblasts and G1E-ER-GATA-1 cells. (A) ChIP-seq profiles of GATA-1 occupancy at loci encoding mammalian ATG8 homologs in primary human erythroblasts. ATG8 homolog genes are arranged in a 5′ → 3′ orientation. (B) ChIP analysis of ER-GATA-1 occupancy at mammalian Atg8 homologs in untreated and β-estradiol-treated (24 h) G1E-ER-GATA-1 cells at sites corresponding to the GATA-1 occupancy sites in the primary human erythroblasts (mean ± standard error; 3 independent experiments). The results obtained with the preimmune antibody (PI) are depicted by the left bar for each condition. pro, promoter.
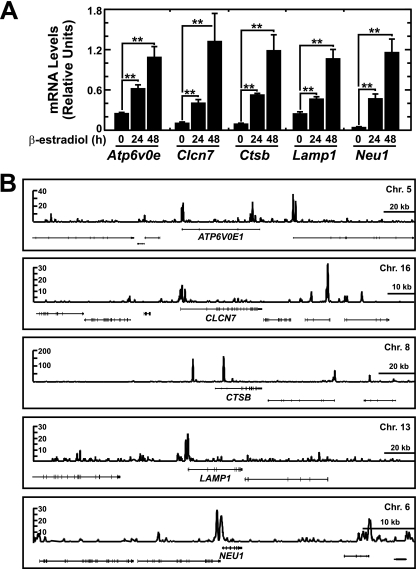
Since GATA-1 directly activates autophagy genes and since the lysosome mediates autophagic protein turnover, we asked whether GATA-1 also regulates lysosomal genes. Quantitation of a subset of genes involved in lysosome biogenesis/function (38) revealed that ER-GATA-1 induced expression of genes encoding membrane transporters (Atp6v0e and Clcn7), hydrolases (Ctsb and Neu1), and the prototypical lysosomal component Lamp1 4- to 20-fold (Fig. 5A). GATA-1 occupied these loci in primary erythroblasts (Fig. 5B), indicating a direct mechanism of transcriptional control.
Fig 5.
GATA-1 directly activates genes encoding lysosomal proteins. (A) Real-time RT-PCR analysis of lysosomal gene expression in G1E-ER-GATA-1 cells following ER-GATA-1 activation for various times (mean ± standard error; 3 independent experiments; ∗∗, P < 0.01). Values were normalized to 18S rRNA expression levels. (B) ChIP-seq profiles of GATA-1 occupancy at GATA-1-regulated lysosomal genes in primary human erythroblasts.
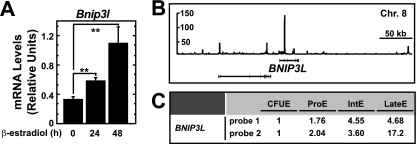
The critical mitochondrial protein NIX mediates mitophagy during erythropoiesis. Given its autophagy function, we tested whether GATA-1 regulates NIX expression. In a genetic complementation assay, ER-GATA-1 significantly induced Bnip3l (encodes NIX) mRNA 3.3-fold (Fig. 6A). Endogenous GATA-1 occupied an intronic site at BNIP3L in primary human erythroblasts (Fig. 6B), indicating a direct activation mechanism. Mining the Human Erythroblast Maturation Database (26) also revealed that BNIP3L expression increases during primary human erythroid cell differentiation (Fig. 6C).
Fig 6.
GATA-1 directly activates Bnip3l encoding the autophagy regulator NIX. (A) Real-time RT-PCR analysis of Bnip3l transcript levels in G1E-ER-GATA-1 cells following ER-GATA-1 activation for various times (mean ± standard error; 3 independent experiments; ∗∗, P < 0.01). Values were normalized to 18S rRNA expression levels. (B) ChIP-seq profile of GATA-1 occupancy at BNIP3L in primary human erythroblasts. (C) Expression level of BNIP3L during primary human erythroblast differentiation from the Human Erythroblast Maturation Database.
GATA-1-dependent autophagosome assembly.
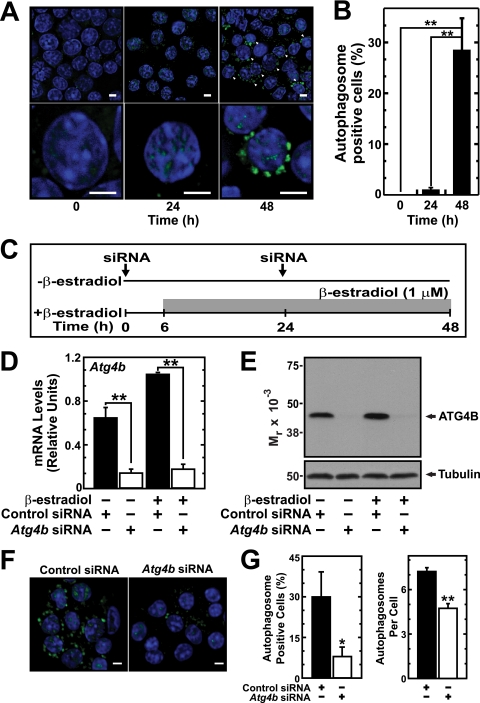
Though mitochondrial clearance during erythropoiesis is critical for reticulocyte maturation, it commences at the orthochromatic erythroblast stage when enucleation occurs (31). The vast majority of G1E-ER-GATA-1 cells do not undergo enucleation, and therefore one would not expect this system to have utility for gauging autophagosome function during late stages of erythropoiesis. However, since ER-GATA-1 strongly induced components of the autophagy machinery and increased LC3 lipidation, we asked whether ER-GATA-1-dependent induction of these components suffices to induce autophagosome assembly. Alternatively, factors missing from the system, perhaps due to developmental stage, might be required for autophagosome assembly. We conducted immunofluorescence analysis of endogenous LC3 in control and β-estradiol-treated G1E-ER-GATA-1 cells. β-Estradiol treatment induced a massive accumulation of LC3-positive puncta surrounding the nucleus, with ∼30% of the cells exhibiting these structures 48 h post-β-estradiol treatment; autophagosome-positive cells were nearly undetectable in untreated cells (Fig. 7A and B).
Fig 7.
GATA-1 induces autophagosomes. (A) Representative images of LC3 staining in G1E-ER-GATA-1 cells after various times of β-estradiol treatment. Arrows indicate cells positive for LC3-containing autophagosomes. Scale bar, 5 μm. (B) Quantitation of cells containing LC3-positive autophagosomes (mean ± standard error; 5 independent experiments; ∗∗, P < 0.01). (C) ATG4B knockdown strategy in G1E-ER-GATA-1 cells. (D) Real-time RT-PCR analysis of Atg4b transcript expression in ATG4B-knockdown G1E-ER-GATA-1 cells (mean ± standard error; 3 independent experiments; ∗∗, P < 0.01). Values were normalized to 18S rRNA expression. (E) Semiquantitative Western blot analysis of ATG4B from G1E-ER-GATA-1 cells transfected with Atg4b or control siRNA. Representative images are shown from two independent experiments. (F) Representative images of LC3 staining in G1E-ER-GATA-1 cells transfected with Atg4b or control siRNA. Scale bar, 10 μm. (G) Quantitation of cells containing LC3-positive autophagosomes and the number of autophagosomes per cell (mean ± standard error; 3 independent experiments; ∗, P < 0.05; ∗∗, P < 0.01).
As an alternative approach to assessing whether GATA-1 induces autophagosome assembly via a canonical mechanism, we conducted a loss-of-function analysis with a pivotal component of the autophagy machinery. ATG4B is a cysteine protease that functions in the LC3 conjugation pathway by cleaving the C terminus of LC3 (pro-LC3) to yield unconjugated soluble LC3 (LC3-I) (Fig. 2C) (44). This step is followed by conjugation of phosphatidylethanolamine (PE) to form lipidated LC3 (LC3-II), which localizes to the autophagosome membrane (16). To test whether GATA-1-mediated induction of LC3-positive cellular structures requires ATG4B, we knocked down ATG4B in G1E-ER-GATA-1 cells, activated ER-GATA-1 with β-estradiol, and quantitated autophagosome-positive cells (Fig. 7C). Under conditions in which the siRNA knockdown reduced Atg4b mRNA by 78 to 82% (Fig. 7D) and considerably reduced ATG4B protein levels (Fig. 7E), autophagosome-positive cells decreased by ∼70% (Fig. 7F and G, left). The number of autophagosomes per cell also significantly decreased (Fig. 7G, right). The ATG4B requirement for ER-GATA-1-induced LC3 assembly into autophagosomes provides strong evidence that GATA-1 control of autophagy gene transcription has important consequences for stimulating canonical ATG4B-dependent autophagosome assembly.
Novel modes of autophagy and lysosomal gene control.
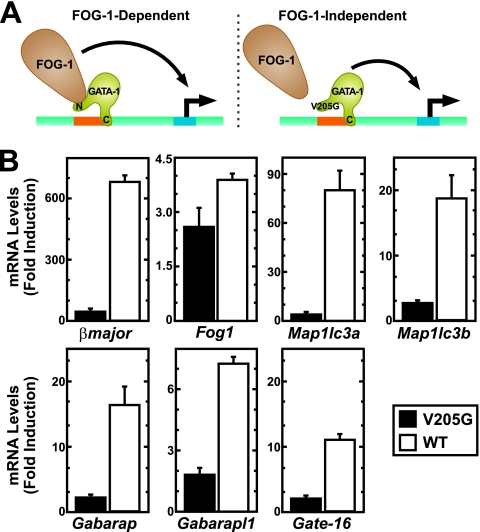
GATA-1 regulates a large cohort of target genes through a mechanism that requires FOG-1 (Fig. 8A) (6, 46, 47). A much smaller number of GATA-1 target genes are FOG-1 independent (4, 6, 15, 18, 33). To assess whether GATA-1 requires FOG-1 to regulate autophagy genes, we compared the capacity of a GATA-1 mutant compromised for FOG-1 binding [ER-GATA-1(V205G)] to ER-GATA-1 in a genetic complementation assay in G1E-ER-GATA-1 cells. Previously, we established G1E cell lines stably expressing equivalent levels of ER-GATA-1 and ER-GATA-1(V205G) (15, 20). Following β-estradiol treatment, autophagy gene expression was quantitated. The V205G mutant was severely compromised in its capacity to activate the autophagy genes (Fig. 8B). The mutant was significantly less effective than ER-GATA-1 in activating the established FOG-1-dependent GATA-1 target gene βmajor, and it resembled ER-GATA-1 in activating the FOG-1-independent GATA-1 target gene Fog1 (Fig. 8B). The crippled activity of the mutant indicated that GATA-1 partners with FOG-1 to regulate autophagy genes.
Fig 8.
FOG-1 requirement for GATA-1-mediated autophagy gene activation. (A) FOG-1-dependent and -independent modes of GATA-1 gene regulation. The V205G mutant exhibits reduced FOG-1 binding and therefore represents a tool to identify FOG-1-dependent and -independent GATA-1 target genes. (B) Real-time RT-PCR analysis of gene expression in G1E-ER-GATA-1 or G1E-ER-GATA-1(V205G) cells (mean ± standard error; 2 to 3 independent experiments). Values were normalized to 18S rRNA expression. βmajor and Fog1 represent established FOG-1-dependent and -independent GATA-1 target genes. WT, wild type.
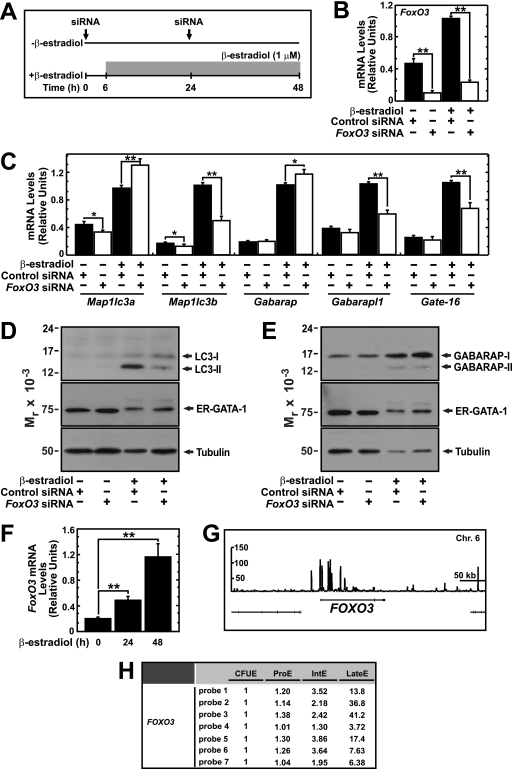
FoxO3 induces autophagy genes during muscle atrophy (24, 58) and is essential for the antioxidant response in erythroid cells (25, 55). However, a potential link between FoxO3 function and autophagy in erythroid cells has not been described. To test whether GATA-1-mediated activation of autophagy genes requires FoxO3, we conducted a loss-of-function analysis in which FoxO3 was knocked down with siRNA in control and β-estradiol-treated G1E-ER-GATA-1 cells (Fig. 9A). The knockdown, which reduced FoxO3 mRNA levels by 76 and 77% in control and β-estradiol-treated cells, respectively (Fig. 9B), resulted in a 35 to 50% decrease in ER-GATA-1-mediated induction of Map1lc3b, Gabarapl1, and Gate-16 (Fig. 9C). Map1lc3a and Gabarap expression increased by 34 and 15%, respectively. Furthermore, the FoxO3 knockdown strongly reduced LC3 (Fig. 9D), but not GABARAP (Fig. 9E), protein levels, indicating that FoxO3 is required for ER-GATA-1-mediated induction of LC3.
Fig 9.
FoxO3-dependent mechanism of GATA-1-mediated autophagy gene regulation. (A) FoxO3 knockdown strategy in G1E-ER-GATA-1 cells. (B and C) Real-time RT-PCR analysis of gene expression in control and FoxO3-knockdown G1E-ER-GATA-1 cells (mean ± standard error; 4 independent experiments; ∗, P < 0.05; ∗∗, P < 0.01). Values were normalized to 18S rRNA expression levels. (D) Semiquantitative Western blot analysis of LC3-I, LC3-II, ER-GATA-1, and tubulin in control and FoxO3-knockdown G1E-ER-GATA-1 cells. (E) Semiquantitative Western blot analysis of GABARAP-I, GABARAP-II, ER-GATA-1, and tubulin in control and FoxO3-knockdown G1E-ER-GATA-1 cells. A representative image is shown from two independent experiments. (F) Real-time RT-PCR analysis of FoxO3 transcript levels in G1E-ER-GATA-1 cells following ER-GATA-1 activation for various times (mean ± standard error; 3 independent experiments; ∗∗, P < 0.01). Values were normalized to 18S rRNA expression levels. (G) ChIP-seq profile of GATA-1 occupancy at FOXO3 in primary human erythroblasts. (H) Expression level of FOXO3 during primary human erythroblast differentiation from Human Erythroblast Maturation Database.
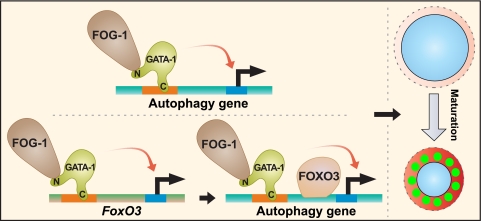
To analyze mechanisms underlying the dual GATA-1 and FoxO3 requirement for autophagy gene expression, we tested whether GATA-1 regulates FoxO3 mRNA levels in G1E-ER-GATA-1 cells. ER-GATA-1 significantly induced FoxO3 mRNA up to 5.5-fold (Fig. 9F). The primary erythroblast ChIP-seq data set revealed GATA-1 occupancy of the FOXO3 locus (Fig. 9G). Consistent with the G1E-ER-GATA-1 cell findings, mining the Human Erythroblast Maturation Database (26) revealed that FOXO3 expression increases upon erythroid differentiation (Fig. 9H). These results provide evidence for a bimodal mechanism in which GATA-1 regulates autophagy genes directly by functioning at their loci and indirectly by inducing FoxO3, which in turn directly activates these genes.
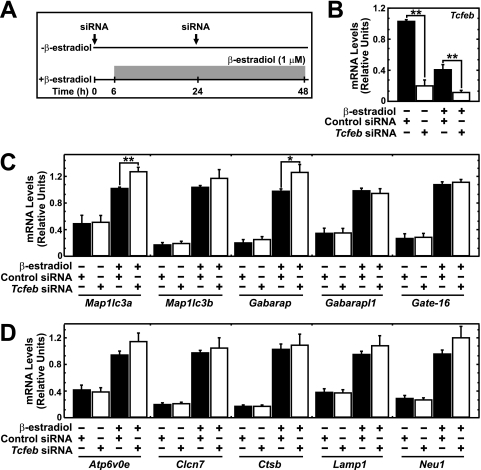
Autophagy is commonly studied in the context of nutrient deprivation (36). Under these conditions, transcription factor EB (TFEB) translocates from the cytoplasm to the nucleus, in which it activates autophagy and lysosomal genes (40, 42). However, this mechanism has not been reported in hematopoietic cells. To distinguish between TFEB-dependent and -independent mechanisms of GATA-1-mediated autophagy and lysosomal gene activation, we knocked down TFEB, activated ER-GATA-1, and quantitated gene expression (Fig. 10A). The knockdown efficiency was 80% and 70% in untreated and treated G1E-ER-GATA-1 cells, respectively (Fig. 10B). Reducing expression of Tcfeb, which encodes TFEB, did not impair ER-GATA-1-mediated induction of autophagy (Fig. 10C) or lysosomal genes (Fig. 10D) and slightly increased Map1lc3a and Gabarap expression (Fig. 10C). As GATA-1-mediated induction of autophagy and lysosomal genes was largely insensitive to downregulating TFEB and as the magnitude of the downregulation was considerable, these genes are subject to a novel TFEB-independent mode of transcriptional control in erythroid cells.
Fig 10.
TFEB-independent mechanism of GATA-1-mediated lysosomal gene activation. (A) TFEB knockdown strategy in G1E-ER-GATA-1 cells. (B) siRNA-mediated knockdown of Tcfeb expression in untreated and β-estradiol-treated G1E-ER-GATA-1 cells. Quantitative RT-PCR analysis of Tcfeb (B), autophagy (C), and lysosomal (D) gene transcripts in TFEB knockdown G1E-ER-GATA-1 cells (mean ± standard error; 4 to 5 independent experiments; ∗, P < 0.05; ∗∗, P < 0.01). Values were normalized to 18S rRNA expression levels.
Transcriptional control of autophagy by a master regulator of hematopoiesis.
Autophagy is essential for cellular remodeling and homeostatic functions (22, 29). The importance of autophagy during differentiation and development has emerged from targeted disruption of autophagy genes in mice. Although this work demonstrates that Ulk1 and Atg7 are required for erythrocyte development (19, 31, 57), mechanisms underlying how the autophagy response is mounted during erythropoiesis are poorly understood. We demonstrate here that GATA-1 and FOG-1 directly regulate genes encoding autophagy components. This transcriptional response increases autophagy protein levels, the active form of LC3 (LC3-II), and autophagosomes. During erythroid differentiation of primary human erythroblasts, expression of LC3 and LC3 homologs increases, consistent with the GATA-1-dependent mechanism that we have described. Thus, the transcriptional program to control autophagy described herein has relevance to normal erythropoiesis.
Evidence has accrued for both transcription-independent and -dependent mechanisms underlying starvation-induced autophagy. Transcription-dependent mechanisms involve FoxO3 and TFEB, which directly activate autophagy genes in skeletal muscle and liver cells, respectively (24, 42). Our results indicate that GATA-1 directly activates autophagy gene transcription (Fig. 11). FoxO3 was required for maximal GATA-1-mediated activation of select autophagy genes and for GATA-1-mediated induction of LC3 in erythroid cells. Whereas certain autophagy genes (Map1lc3b, Gabarapl1, and Gate-16) were induced by FoxO3, Map1lc3a and Gabarap were repressed. Despite these qualitatively distinct FoxO3 activities, GATA-1 activates expression of all of these genes and also FoxO3. FoxO3 differentially regulates target genes in response to erythropoietin by functioning with different partners (1). By analogy, FoxO3 might also differentially regulate LC3 homolog genes in a context-dependent manner. Though LC3 and GATE-16 subfamilies function differently in autophagosome formation (49), many questions remain unanswered regarding the individual functions of LC3 homolog genes in autophagy.
Fig 11.
Bimodal model of GATA-1-dependent autophagy gene control. GATA-1 directly regulates autophagy genes. Through the induction of FoxO3 expression, GATA-1 indirectly regulates autophagy genes.
In summary, GATA-1 establishes a transcriptional program that provides the differentiating erythroblast with the requisite autophagy machinery and lysosomal components to ensure high-fidelity generation of erythrocytes. The concept of a master developmental regulator instigating cell-type-specific autophagy by directly controlling levels of the respective protein machinery is compelling, and it will be important to assess how broadly this mechanism applies in distinct contexts of cell-type-specific autophagy. Furthermore, given the direct GATA-1 actions at autophagy and lysosomal genes, direct FoxO3 actions at these genes, coregulation by GATA-1 and FoxO3, and GATA-1 induction of FoxO3 expression, which indirectly activates autophagy (Fig. 11), it will be instructive to consider this complex network from a systems perspective. Accordingly, one can develop computational strategies to predict how perturbations in the system impact the quality and quantity of erythrocytes generated from committed progenitors with the goal of systematically modulating this fundamental biological progress.
ACKNOWLEDGMENTS
The work was supported by NIH DK50107 (E.H.B.) and DK68634 (E.H.B.). Y.-A.K. and A.K.L. are predoctoral and postdoctoral fellows, respectively, of the American Heart Association. The GATA-1 ChIP-seq data were generated by the laboratory of Peggy Farnham as part of the ENCODE project (7); data generation and analysis were supported by funds from the NHGRI (1U54HG004558).
Footnotes
Published ahead of print 24 October 2011
REFERENCES
- 1. Bakker WJ, et al. 2007. Differential regulation of Foxo3a target genes in erythropoiesis. Mol. Cell. Biol. 27:3839–3854 [DOI] [PMC free article] [PubMed] [Google Scholar]
- 2. Behrends C, Sowa ME, Gygi SP, Harper JW. 2010. Network organization of the human autophagy system. Nature 466:68–76 [DOI] [PMC free article] [PubMed] [Google Scholar]
- 3. Blahnik KR, et al. 2010. Sole-Search: an integrated analysis program for peak detection and functional annotation using ChIP-seq data. Nucleic Acids Res. 38:e13. [DOI] [PMC free article] [PubMed] [Google Scholar]
- 4. Bresnick EH, Lee HY, Fujiwara T, Johnson KD, Keles S. 2010. GATA switches as developmental drivers. J. Biol. Chem. 285:31087–31093 [DOI] [PMC free article] [PubMed] [Google Scholar]
- 5. Celada A, et al. 1996. The transcription factor PU. 1 is involved in macrophage proliferation. J. Exp. Med. 184:61–69 [DOI] [PMC free article] [PubMed] [Google Scholar]
- 6. Crispino JD, Lodish MB, MacKay JP, Orkin SH. 1999. Use of altered specificity mutants to probe a specific protein-protein interaction in differentiation: the GATA-1:FOG complex. Mol. Cell 3:219–228 [DOI] [PubMed] [Google Scholar]
- 7. Encode Project Consortium 2007. Identification and analysis of functional elements in 1% of the human genome by the ENCODE pilot project. Nature 447:799–816 [DOI] [PMC free article] [PubMed] [Google Scholar]
- 8. Evans T, Felsenfeld G. 1989. The erythroid-specific transcription factor Eryf1: a new finger protein. Cell 58:877–885 [DOI] [PubMed] [Google Scholar]
- 9. Fujiwara T, et al. 2009. Discovering hematopoietic mechanisms through genome-wide analysis of GATA factor chromatin occupancy. Mol. Cell 36:667–681 [DOI] [PMC free article] [PubMed] [Google Scholar]
- 10. Grass JA, et al. 2003. GATA-1-dependent transcriptional repression of GATA-2 via disruption of positive autoregulation and domain-wide chromatin remodeling. Proc. Natl. Acad. Sci. U. S. A. 100:8811–8816 [DOI] [PMC free article] [PubMed] [Google Scholar]
- 11. Gregory T, et al. 1999. GATA-1 and erythropoietin cooperate to promoter erythroid cell survival by regulating bcl-xL expression. Blood 94:87–96 [PubMed] [Google Scholar]
- 12. Hirasawa R, et al. 2002. Essential and instructive roles of GATA factors in eosinophil development. J. Exp. Med. 195:1379–1386 [DOI] [PMC free article] [PubMed] [Google Scholar]
- 13. Im H, et al. 2004. Measurement of protein-DNA interactions in vivo by chromatin immunoprecipitation. Methods Mol. Biol. 284:129–146 [DOI] [PubMed] [Google Scholar]
- 14. Im H, et al. 2005. Chromatin domain activation via GATA-1 utilization of a small subset of dispersed GATA motifs within a broad chromosomal region. Proc. Natl. Acad. Sci. U. S. A. 102:17065–17070 [DOI] [PMC free article] [PubMed] [Google Scholar]
- 15. Johnson KD, et al. 2007. Friend of GATA-1-independent transcriptional repression: a novel mode of GATA-1 function. Blood 109:5230–5233 [DOI] [PMC free article] [PubMed] [Google Scholar]
- 16. Kabeya Y, et al. 2000. LC3, a mammalian homologue of yeast Apg8p, is localized in autophagosome membranes after processing. EMBO J. 19:5720–5728 [DOI] [PMC free article] [PubMed] [Google Scholar]
- 17. Kabeya Y, et al. 2004. LC3, GABARAP and GATE16 localize to autophagosomal membrane depending on form-II formation. J. Cell Sci. 117:2805–2812 [DOI] [PubMed] [Google Scholar]
- 18. Kim S-I, Bultman SJ, Jing H, Blobel GA, Bresnick EB. 2007. Dissecting molecular steps in chromatin domain activation during hematopoietic differentiation. Mol. Cell. Biol. 27:4551–4565 [DOI] [PMC free article] [PubMed] [Google Scholar]
- 19. Kundu M, et al. 2008. Ulk1 plays a critical role in the autophagic clearance of mitochondria and ribosomes during reticulocyte maturation. Blood 112:1493–1502 [DOI] [PMC free article] [PubMed] [Google Scholar]
- 20. Lee HY, et al. 2009. Controlling hematopoiesis through sumoylation-dependent regulation of a GATA factor. Mol. Cell 36:984–995 [DOI] [PMC free article] [PubMed] [Google Scholar]
- 21. Lee HY, Johnson KD, Boyer ME, Bresnick EH. 2011. Relocalizing genetic loci into specific subnuclear neighborhoods. J. Biol. Chem. 286:18834–18844 [DOI] [PMC free article] [PubMed] [Google Scholar]
- 22. Levine B, Mizushima N, Virgin HW. 2011. Autophagy in immunity and inflammation. Nature 469:323–335 [DOI] [PMC free article] [PubMed] [Google Scholar]
- 23. Maiuri MC, et al. 2010. Autophagy regulation by p53. Curr. Opin. Cell Biol. 22:181–185 [DOI] [PubMed] [Google Scholar]
- 24. Mammucari C, et al. 2007. FoxO3 controls autophagy in skeletal muscle in vivo. Cell Metab. 6:458–471 [DOI] [PubMed] [Google Scholar]
- 25. Marinkovic D, et al. 2007. FoxO3 is required for the regulation of oxidative stress in erythropoiesis. J. Clin. Invest. 117:2133–2144 [DOI] [PMC free article] [PubMed] [Google Scholar]
- 26. Merryweather-Clarke AT, et al. 2011. Global gene expression analysis of human erythroid progenitors. Blood 117:e96–e108 [DOI] [PubMed] [Google Scholar]
- 27. Migliaccio AR, et al. 2003. GATA-1 as a regulator of mast cell differentiation revealed by the phenotype of the GATA-1low mouse mutant. J. Exp. Med. 197:281–296 [DOI] [PMC free article] [PubMed] [Google Scholar]
- 28. Mizushima N. 2007. Autophagy: process and function. Genes Dev. 21:2861–2873 [DOI] [PubMed] [Google Scholar]
- 29. Mizushima N, Levine B. 2010. Autophagy in mammalian development and differentiation. Nat. Cell Biol. 12:823–830 [DOI] [PMC free article] [PubMed] [Google Scholar]
- 30. Mizushima N, Yoshimori T. 2007. How to interpret LC3 immunoblotting. Autophagy 3:542–545 [DOI] [PubMed] [Google Scholar]
- 31. Mortensen M, et al. 2010. Loss of autophagy in erythroid cells leads to defective removal of mitochondria and severe anemia in vivo. Proc. Natl. Acad. Sci. U. S. A. 107:832–837 [DOI] [PMC free article] [PubMed] [Google Scholar]
- 32. O'Geen H, Frietze S, Farnham PJ. 2010. Using ChIP-seq technology to identify targets of zinc finger transcription factors. Methods Mol. Biol. 649:437–455 [DOI] [PMC free article] [PubMed] [Google Scholar]
- 33. Pal S, et al. 2004. Neurokinin-B transcription in erythroid cells: direct activation by the hematopoietic transcription factor GATA-1. J. Biol. Chem. 279:31348–31356 [DOI] [PubMed] [Google Scholar]
- 34. Pevny L, et al. 1991. Erythroid differentiation in chimaeric mice blocked by a targeted mutation in the gene for transcription factor GATA-1. Nature 349:257–260 [DOI] [PubMed] [Google Scholar]
- 35. Polager S, Ofir M, Ginsberg D. 2008. E2F1 regulates autophagy and the transcription of autophagy genes. Oncogene 27:4860–4864 [DOI] [PubMed] [Google Scholar]
- 36. Rabinowitz JD, White E. 2010. Autophagy and metabolism. Science 330:1344–1348 [DOI] [PMC free article] [PubMed] [Google Scholar]
- 37. Rzymski T, et al. 2010. Regulation of autophagy by ATF4 in response to severe hypoxia. Oncogene 29:4424–4435 [DOI] [PubMed] [Google Scholar]
- 38. Saftig P, Klumperman J. 2009. Lysosome biogenesis and lysosomal membrane proteins: trafficking meets function. Nat. Rev. Mol. Cell Biol. 10:623–635 [DOI] [PubMed] [Google Scholar]
- 39. Sandoval H, et al. 2008. Essential role for Nix in autophagic maturation of erythroid cells. Nature 454:232–235 [DOI] [PMC free article] [PubMed] [Google Scholar]
- 40. Sardiello M, et al. 2009. A gene network regulating lysosomal biogenesis and function. Science 325:473–477 [DOI] [PubMed] [Google Scholar]
- 41. Schweers RL, et al. 2007. NIX is required for programmed mitochondrial clearance during reticulocyte maturation. Proc. Natl. Acad. Sci. U. S. A. 104:19500–19505 [DOI] [PMC free article] [PubMed] [Google Scholar]
- 42. Settembre C, et al. 2011. TFEB links autophagy to lysosomal biogenesis. Science 332:1429–1433 [DOI] [PMC free article] [PubMed] [Google Scholar]
- 43. Simon MC, et al. 1992. Rescue of erythroid development in gene targeted GATA-1− mouse embryonic stem cells. Nat. Genet. 1:92–98 [DOI] [PubMed] [Google Scholar]
- 44. Tanida I, et al. 2004. HsAtg4B/HsApg4B/autophagin-1 cleaves the carboxyl termini of three human Atg8 homologues and delipidates microtubule-associated protein light chain 3- and GABAA receptor-associated protein-phospholipid conjugates. J. Biol. Chem. 279:36268–36276 [DOI] [PubMed] [Google Scholar]
- 45. Tsai SF, et al. 1989. Cloning of cDNA for the major DNA-binding protein of the erythroid lineage through expression in mammalian cells. Nature 339:446–451 [DOI] [PubMed] [Google Scholar]
- 46. Tsang AP, Fujiwara Y, Hom DB, Orkin SH. 1998. Failure of megakaryopoiesis and arrested erythropoiesis in mice lacking the GATA-1 transcriptional cofactor FOG. Genes Dev. 12:1176–1188 [DOI] [PMC free article] [PubMed] [Google Scholar]
- 47. Tsang AP, et al. 1997. FOG, a multitype zinc finger protein, acts as a cofactor for transcription factor GATA-1 in erythroid and megakaryocytic differentiation. Cell 90:109–119 [DOI] [PubMed] [Google Scholar]
- 48. Vyas P, Ault K, Jackson CW, Orkin SH, Shivdasani RA. 1999. Consequences of GATA-1 deficiency in megakaryocytes and platelets. Blood 93:2867–2875 [PubMed] [Google Scholar]
- 49. Weidberg H, et al. 2010. LC3 and GATE-16/GABARAP subfamilies are both essential yet act differently in autophagosome biogenesis. EMBO J. 29:1792–1802 [DOI] [PMC free article] [PubMed] [Google Scholar]
- 50. Weiss MJ, Keller G, Orkin SH. 1994. Novel insights into erythroid development revealed through in vitro differentiation of GATA-1 embryonic stem cells. Genes Dev. 8:1184–1197 [DOI] [PubMed] [Google Scholar]
- 51. Weiss MJ, Yu C, Orkin SH. 1997. Erythroid-cell-specific properties of transcription factor GATA-1 revealed by phenotypic rescue of a gene-targeted cell line. Mol. Cell. Biol. 17:1642–1651 [DOI] [PMC free article] [PubMed] [Google Scholar]
- 52. Welch JJ, et al. 2004. Global regulation of erythroid gene expression by transcription factor GATA-1. Blood 104:3136–3147 [DOI] [PubMed] [Google Scholar]
- 53. Xie Z, Klionsky DJ. 2007. Autophagosome formation: core machinery and adaptations. Nat. Cell Biol. 9:1102–1109 [DOI] [PubMed] [Google Scholar]
- 54. Yu C, et al. 2002. Targeted deletion of a high-affinity GATA-binding site in the GATA-1 promoter leads to selective loss of the eosinophil lineage in vivo. J. Exp. Med. 195:1387–1395 [DOI] [PMC free article] [PubMed] [Google Scholar]
- 55. Yu D, et al. 2010. miR-451 protects against erythroid oxidant stress by repressing 14-3-3zeta. Genes Dev. 24:1620–1633 [DOI] [PMC free article] [PubMed] [Google Scholar]
- 56. Yu M, et al. 2009. Insights into GATA-1-mediated gene activation versus repression via genome-wide chromatin occupancy analysis. Mol. Cell 36:682–695 [DOI] [PMC free article] [PubMed] [Google Scholar]
- 57. Zhang J, et al. 2009. Mitochondrial clearance is regulated by Atg7-dependent and -independent mechanisms during reticulocyte maturation. Blood 114:157–164 [DOI] [PMC free article] [PubMed] [Google Scholar]
- 58. Zhao J, et al. 2007. FoxO3 coordinately activates protein degradation by the autophagic/lysosomal and proteasomal pathways in atrophying muscle cells. Cell Metab. 6:472–483 [DOI] [PubMed] [Google Scholar]


