

Abstract
Little is known about the rate at which genetic variation is generated within intrahost populations of dengue virus (DENV) and what implications this diversity has for dengue pathogenesis, disease severity, and host immunity. Previous studies of intrahost DENV variation have used a low frequency of sampling and/or experimental methods that do not fully account for errors generated through amplification and sequencing of viral RNAs. We investigated the extent and pattern of genetic diversity in sequence data in domain III (DIII) of the envelope (E) gene in serial plasma samples (n = 49) taken from 17 patients infected with DENV type 1 (DENV-1), totaling some 8,458 clones. Statistically rigorous approaches were employed to account for artifactual variants resulting from amplification and sequencing, which we suggest have played a major role in previous studies of intrahost genetic variation. Accordingly, nucleotide sequence diversities of viral populations were very low, with conservative estimates of the average levels of genetic diversity ranging from 0 to 0.0013. Despite such sequence conservation, we observed clear evidence for mixed infection, with the presence of multiple phylogenetically distinct lineages present within the same host, while the presence of stop codon mutations in some samples suggests the action of complementation. In contrast to some previous studies we observed no relationship between the extent and pattern of DENV-1 genetic diversity and disease severity, immune status, or level of viremia.
INTRODUCTION
Dengue virus (DENV) is a single-strand positive-sense RNA virus of the family Flaviviridae and exists as four closely related antigenically distinct serotypes denoted DENV-1 to DENV-4. These serotypes differ at the consensus level by 25 to 40% at the amino acid level (15, 30). Genetic variation within each of the four serotypes is defined as a series of “genotypes” (or “subtypes”), which can vary from one another by up to ∼6 to 8% and 3% at the nucleotide and amino acid levels, respectively (15, 25, 32). For example, at least four major genotypes of DENV-1 exist, each with a different geographical distribution (9, 38). The basis for the genetic diversity in DENV is its error-prone RNA polymerase (10), such that mutations commonly occur during viral replication and on which a combination of genetic drift and negative and/or positive natural selection is able to act. This high rate of replication error results in DENV existing as a population of closely related variants within an individually infected host (33, 34), and this intrahost genetic diversity has been proposed to have implications for pathogenesis of DENV infection, variable disease outcomes, virus evolution, and host immunity (6).
Several previous studies have confirmed that the population of DENV in humans and within individual Aedes mosquitoes contains measurable genetic variation (8, 19, 33, 34). Levels of within-host genetic diversity have been previously shown to vary among patients. Reported levels of intrahost genetic diversity ranged from 0.21 to 1.67% for the E gene of DENV-3, with genome-defective DENVs observed in 3.9% to 5.8% of clones (33, 34). Another similar study showed that the intrahost diversity for the C and NS2B genes ranged from 0.12 to 1.02% and 0.16 to 1.20%, respectively (34). Lin et al. (19) showed that DENV exhibits substantial sequence diversity in humans and to a lesser extent in mosquitoes, with the major variant transmitted in both humans and mosquitoes. Intriguingly, Descloux et al. suggested that the level of intrahost genetic diversity was lower in patients suffering severe dengue disease, i.e., dengue hemorrhagic fever (DHF) and dengue shock syndrome (DSS), than in those experiencing the milder dengue fever (DF), such that there is a direct link between viral genetic diversity and clinical outcome (8).
All previous studies of intrahost DENV genetic diversity have utilized point measurements in which a limited set of clones (n = 10 to 50) containing short, amplified segments of the viral genome were sequenced. In most cases the proportion of mutations due to experimental (PCR/sequencing) error in these studies is uncertain, but it is likely an important contributor to the levels of diversity observed. As well as a limited sample of population diversity, it is unknown whether the extent of sequence variation changes during the course of infection, and the relationship between intrahost genetic variation and dengue severity is unclear. To address these issues, we undertook an expansive study of intrahost DENV variation by sequencing a median of 155 high-quality clones from serial plasma samples taken from 17 patients infected with DENV-1 and applying a rigorous quality control to exclude artifactual mutations. With these data we explored the relationship between intrahost genetic diversity and clinical outcome, focusing on the sequence encoding domain III (DIII) of the envelope (E) gene. Importantly, DIII is involved in cell receptor binding and is the major target of virus-neutralizing antibodies in humans (3, 21), and hence mutations within this region may have important functional consequences.
MATERIALS AND METHODS
Study population.
Plasma samples from dengue patients included in the placebo arm of a clinical trial of chloroquine were used for this study (29). We selected 17 patients for study based on the serotype of infection (i.e., DENV-1), serological response (i.e., primary or secondary), and disease severity (i.e., DF or DHF). Classification of disease severity was according to 1997 WHO classification criteria (36). For each patient, three sequential plasma samples, beginning with the enrolment plasma sample, were selected for analysis. Samples were selected to represent the breadth of viremia levels found in DENV-1-infected patients. Briefly, we selected three primary DF, seven secondary DF, and seven secondary DHF patients, with medians age of 19, 19, and 20 years, respectively, and a male/female ratio of 1.3. The median day of illness at admission was 2.2 (range, 0.6 to 2.8 days).
Whole-genome (consensus) sequencing of DENV-1.
Viral genomes in the enrolment samples were sequenced as part of the Broad Institute's Genome Resources in Dengue project using a capillary sequencing-directed amplification viral sequencing pipeline as previously reported (24). In short, isolated viral RNAs were reverse transcribed, and then overlapping amplicons that span the complete genome were amplified using a high-fidelity polymerase; resulting products were Sanger sequenced, and the resulting sequence coverage was ∼8-fold. Resulting sequence reads were assembled using the Broad Institute's AV454 algorithm (13a). Consensus assemblies were used for alignment of clone reads as part of the variant calling process (see below).
RNA extraction, real-time PCR, cloning, and sequencing.
Dengue viral RNA was isolated directly from plasma using the QIAamp viral RNA minikit (Qiagen, Germany). RNA was reverse transcribed, and DENV-1 viremia levels were assessed using an internally controlled, serotype-specific, real-time reverse transcriptase PCR (RT-PCR) assay that has been described elsewhere (18); results were expressed as cDNA equivalents per ml of serum.
The 462-nucleotide (nt) region carrying DIII of the E gene was amplified using the primers DIII-E P3 (5′-CAAGAAGGAGCAATGCACAC-3′, corresponding to genome positions 1701 to 1720 of the DENV-1 reference strain [Hawaii, 1944]) and DIII-E P5 (5′-CCAAAGTCCCATGCGGTGTC-3′, positions 2182 to 2201). The PCR was performed with 5 μl 5× polymerase buffer (Roche), 1 μl 10 mM DIII-E P3 primer, 1 μl 10 mM DIII-E P5′ primer, 3.5 μl 25 mM MgCl2 (Roche), 1 μl 10 mM deoxynucleoside triphosphates (dNTPs) (Invitrogen), 2.5 U Expand High Fidelity Plus polymerase (Roche), and RNase-free water to a final volume of 25 μl. The PCR conditions were 94°C for 2 min, followed by 45 cycles of 94°C for 15 s, 60°C for 30 s, and 72°C for 45 s, and then 72°C for 7 min. The resulting PCR product was visualized on a 1% agarose gel using ethidium bromide staining and UV light.
PCR amplimers were cloned into the T/A cloning vector pCRII-TOPO, which was transformed into TOP10 competent cells (Invitrogen). Each transformation culture was plated out on Luria-Bertani (LB)–ampicillin–isopropylthiogalactoside (IPTG)–5-bromo-4-chloro-3-indolyl-β-d-galactopyranoside (X-Gal) plates and grown overnight at 37°C. A total of 382 white colonies (suggestive for amplicon insertion) were selected from each sample and sequenced using dye terminator chemistry on an ABI 3730xl sequencer (Applied Biosystems) from both ends to generate paired end reads and quality files.
Variant calling. (i) Read alignment and merging.
Reads from each sample were aligned to the consensus genome sequence present in the enrolment plasma sample using the BLAST-Like Alignment Tool (BLAT) version 33 (17). A custom script was used to merge overlapping forward and reverse reads, simultaneously assign appropriate base quality scores, and trim the resulting reads to the target amplicon sequence.
Overlapping forward and reverse reads were merged into a single contig and assigned quality scores. To control for poor alignment at the ends of reads, forward and reverse reads were required to have at least 5 bases aligning into the designed primer (i.e., DIII-E P3 and DIII-E P5) or were trimmed backwards 5 bases from the end of their alignment. The quality scores were assigned based on the agreement or disagreement of the bases between the forward and the reverse reads. The sum of quality scores was assigned for bases agreeing; bases disagreeing were assigned to the base with the highest quality score and the quality score was assigned as the difference. Gaps were given quality equal to the lower quality of the adjacent base or the lowest quality of any contiguous base of the same type (homopolymer adjustment); a base(s) was discarded when the gap had higher quality than the inserted base(s) on the opposite strand, and bases retained their quality scores if the quality of bases was higher. Indels of the same length in both reads were retained as real. Complex events (e.g., inserts relative to reference opposite deletions or insertions or deletions of different length) were replaced with a number of Ns equal to the length of the consensus between the two flanking consistent alignments and given a quality score of 0. When the overlapping region of the forward or reverse read did not extend to the designed primer, the merged read was extended to include whichever read had the largest number of aligning bases on that side of the overlap and was assigned the raw quality for those bases. In cases where both complement forward or reverse reads did not align, we trimmed the single read to the target amplicon region and retained it for variant calling.
(ii) Base variant calling.
To reduce false-positive base variant calls, we employed a neighborhood quality standard (NQS) algorithm (2) to filter bases used for variant calling. Bases not meeting an NQS condition over those regions were excluded; i.e., a base satisfies the NQS condition if the base has PHRED score of ≥20 and the neighboring five bases on each side have PHRED scores of ≥15. Two variant base data sets were generated for downstream analysis. In the first, highest-quality data set, defined as VP, base variants were called using the V-Phaser algorithm (A. Macalalad et al., submitted for publication). In short, V-Phaser applies an error probability model defined by a process read error rate, and refined by the inclusion of variant nucleotide phasing information, to define the frequency at which a nucleotide polymorphism needs to be observed to be a true variant given the observed sequence coverage. In general, for the data sets analyzed as part of this study, variants were identified as real if they were observed on two or more reads. To explore how erroneous PCR and sequencing may have contributed to the observed levels of genetic diversity, we generated a second variant data set, defined as 1HQ, that included variants that were seen only once (i.e., singletons). In both the 1HQ and VP data sets, only high-quality bases that passed NQS were used for base variant calling.
(iii) Variant haplotype calling.
For each aligned read (see “Read alignment and merging” above), we computed a vector of valid base variant calls (see “Base variant calling” above). The minimal set of such vectors required to explain all reads was collected using a custom haplotype calling algorithm. For each sample, the algorithm was seeded with a single read and then reads were assigned a haplotype. If a read matched unambiguously based on the variant positions to an existing haplotype group (in first iteration match is to seed read), it was assigned that haplotype; otherwise, it was assigned as a new haplotype. This process was iterated until all reads were grouped into defined haplotypes defined by variant vectors. We assigned reads that have variant vectors with missing data (e.g., due to failure to align or presence of a call which is not considered valid) by a similar process. For reads that the partial vector maps unambiguously to a complete haplotype, the missing information is “corrected” based on the complete vector; those reads that do not map unambiguously are assigned as “incomplete” haplotypes.
Evolutionary analysis. (i) Measurements of genetic variation.
Alignments of full-length pseudoreads (i.e., all valid variants) from the haplotypes were generated with the MUSCLE software (version 3.7) (11), using default settings. Because of the very low numbers of mutations observed, the mean pairwise genetic diversity within each sample was calculated from the uncorrected pairwise distance matrix (p distance) between taxa, and the population standard error (SE) was estimated with 1,000 bootstrap replicates using the MEGA5 program (27). To estimate the mean numbers of synonymous (dS) and nonsynonymous (dN) substitutions per site (dN/dS ratio) in each sample, we utilized the Jukes-Cantor substitution model within MEGA5 (27). Mutations detected within each sample were further characterized as to their frequency and presence in other samples and were mapped to inferred amino acid sequences.
(ii) Pattern of intrahost evolution.
The evolutionary relationships among the DENV-1 sequences from each sample were inferred through the construction of minimum spanning networks, utilizing the program TCS 1.21 (5) and following the algorithm of Templeton et al. (28). Inferences from this method depend on the chosen probability of parsimony, and we chose a value of 99% (i.e., a 99% connection limit). This number of mutational differences associated with the probability just before the (99%) cutoff is the maximum number of mutational connections between pairs of sequences. Networks that are unconnected at the 99% probability of parsimony were linked by decreasing the connection probability. The power of this approach is that it allows the population frequency of each mutation to be assessed, and the parsimony-based approach is justified by the small number of total mutations observed.
(iii) Global DENV-1 phylogenetic inference.
To determine the frequency of mixed infections in our data sets, the sequences of each individual patient were aligned together with 1,390 previously published DENV-1 E gene sequences (i.e., “background data set”), which combine subsets of genotype I (n = 1,111), II (n = 91), and III (n = 188). Phylogenetic trees for these data were then estimated using the maximum-likelihood (ML) method available in the RAxML package (version 7.0.4) (26). In all cases we used the GTR+Γ4 model of nucleotide substitution, as determined by ModelTest v3.7 (23). The reliability of specific groupings on the trees was estimated using bootstrapping with 1,000 pseudoreplicates.
Nucleotide sequence accession numbers.
All nucleotide sequences generated here have been submitted to GenBank and assigned accession numbers 2262271431 to 2299350311 (see Table S2 in the supplemental material).
RESULTS
Extent and pattern of intrahost genetic variation.
The clinical, serological, and demographic features of the 17 DENV-1 infected patients who participated in this study are shown in Table 1. To determine the intrahost evolutionary dynamics of DENV-1 in these patients, we studied genetic diversity in 49 serial plasma samples collected during the course of their illness. Overall, we sequenced 8,458 clones of the 463-nucleotide region carrying DIII of the E gene derived from 49 serial plasma samples collected during the course of infection. In the VP data set, 8,458 clones were assigned into complete haplotypes, with a median of 155 (range, 4 to 362) clones analyzed at each time point (Table 2); these data excluded singleton mutations and included only high-quality variant positions that were seen frequently enough at a given sequence coverage to be unlikely to occur as a result of error alone (i.e., typically observed at least twice). In the 1HQ data set, which contains all variants observed, including singletons that may be artifacts resulting from process errors, 8,315 and 143 clones were assigned to complete and incomplete haplotypes, respectively. A median of 155 (range, 4 to 361) clones were analyzed at each time point (Table 3).
Table 1.
Summary of characteristics of the 17 patients with DEVN-1 infections
| Patient no. | Disease outcomea | Immune statusb | Clade (within genotype 1)c | Age (yr) | Sexd | Consensus assembly GenBank accession no. | DENV-1 RNA (copies/ml) |
Day of illness | Sequence ID no. | |
|---|---|---|---|---|---|---|---|---|---|---|
| Peak viremia | Samples | |||||||||
| 49 | DF | Pri | 1 | 18 | M | FJ410197 | 7.97 × 10⁸ | 2.60 × 10⁸ | 2.7 | G2500 |
| 3.97 × 10⁷ | 3.7 | G2501 | ||||||||
| 8.64 × 10⁵ | 4.5 | G2502 | ||||||||
| 76 | DF | Pri | 1 | 21 | M | FJ410205 | 2.33 × 10⁸ | 2.33 × 10⁸ | 2.8 | G2506 |
| 5.42 × 10⁶ | 3.8 | G2507 | ||||||||
| 1.10 × 10⁶ | 4.8 | G2508 | ||||||||
| 336 | DF | Pri | 1 | 19 | F | FJ461319 | 5.33 × 10⁷ | 5.33 × 10⁷ | 2.4 | G2542 |
| 1.18 × 10⁷ | 3.1 | G2543 | ||||||||
| 6.08 × 10⁶ | 3.4 | G2544 | ||||||||
| 82 | DF | Sec | N/A | 15 | M | N/A | 1.61 × 10⁹ | 1.61 × 10⁹ | 3.0 | G2509 |
| 9.35 × 10⁷ | 4.0 | G2510 | ||||||||
| 1.76 × 10⁷ | 5.0 | G2511 | ||||||||
| 107 | DF | Sec | 4 | 18 | M | FJ432746 | 3.76 × 10¹⁰ | 1.34 × 10¹⁰ | 1.6 | G2512 |
| 1.04 × 10¹⁰ | 3.3 | G2513 | ||||||||
| 3.88 × 10⁹ | 3.6 | G2514 | ||||||||
| 121 | DF | Sec | 5 | 22 | M | FJ410212 | 4.87 × 10⁹ | 4.87 × 10⁹ | 1.6 | G2515 |
| 2.19 × 10⁸ | 3.6 | G2516 | ||||||||
| 5.42 × 10⁶ | 4.9 | G2517 | ||||||||
| 171 | DF | Sec | 4 | 19 | M | FJ410279 | 6.10 × 10¹⁰ | 1.49 × 10¹⁰ | 1.9 | G2527 |
| 2.71 × 10¹⁰ | 3.7 | G2528 | ||||||||
| 2.43 × 10⁸ | 4.7 | G2529 | ||||||||
| 309 | DF | Sec | 4 | 18 | F | FJ410216 | 1.03 × 10¹⁰ | 5.30 × 10⁹ | 3.0 | G2536 |
| 7.06 × 10⁸ | 4.0 | G2537 | ||||||||
| 7.75 × 10⁷ | 5.0 | G2538 | ||||||||
| 323 | DF | Sec | 1 | 31 | F | FJ461316 | 2.31 × 10¹⁰ | 1.00 × 10¹⁰ | 1.4 | G2539 |
| 5.16 × 10⁸ | 3.4 | G2540 | ||||||||
| 5.85 × 10⁷ | 4.4 | G2541 | ||||||||
| 383 | DF | Sec | 1 | 34 | F | FJ410247 | 1.29 × 10¹⁰ | 2.22 × 10⁹ | 1.8 | G2551 |
| 2.25 × 10⁹ | 3.8 | G2552 | ||||||||
| 7.88 × 10⁷ | 4.8 | G2553 | ||||||||
| 59 | DHF I | Sec | 4 | 25 | M | FJ410199 | 1.65 × 10¹⁰ | 1.65 × 10¹⁰ | 2.3 | G2503 |
| 2.65 × 10⁹ | 3.3 | G2504 | ||||||||
| 1.91 × 10⁷ | 4.0 | G2505 | ||||||||
| 146 | DHF II | Sec | 2 | 16 | M | FJ410269 | 3.99 × 10⁹ | 3.99 × 10⁹ | 2.4 | G2518 |
| 2.64 × 10⁸ | 3.4 | G2519 | ||||||||
| 1.61 × 10⁸ | 3.6 | G2520 | ||||||||
| 154 | DHF II | Sec | 1 | 34 | M | FJ410272 | 2.08 × 10⁹ | 2.08 × 10⁹ | 2.3 | G2521 |
| 3.04 × 10⁸ | 3.3 | G2522 | ||||||||
| 5.00 × 10⁶ | 4.0 | G2523 | ||||||||
| 162 | DHF II | Sec | 1 | 38 | M | FJ410275 | 1.24 × 10¹⁰ | 1.24 × 10¹⁰ | 2.4 | G2524 |
| 1.01 × 10⁸ | 3.4 | G2525 | ||||||||
| 4.94 × 10⁵ | 4.2 | G2526 | ||||||||
| 349 | DHF II | Sec | 1 | 20 | F | FJ547065 | 2.36 × 10¹⁰ | 2.36 × 10¹⁰ | 2.7 | G2545 |
| 1.56 × 10⁹ | 3.7 | G2546 | ||||||||
| 3.79 × 10⁷ | 4.7 | G2547 | ||||||||
| 376 | DHF II | Sec | 4 | 20 | F | FJ410244 | 2.06 × 10⁸ | 2.06 × 10⁸ | 2.6 | G2548 |
| 6.52 × 10⁷ | 3.4 | G2549 | ||||||||
| 1.68 × 10⁴ | 4.4 | G2550 | ||||||||
| 391 | DHF II | Sec | 5 | 18 | F | FJ410220 | 2.19 × 10⁹ | 2.19 × 10⁹ | 2.3 | G2554 |
| 1.52 × 10⁸ | 3.3 | G2555 | ||||||||
| 1.22 × 10⁶ | 4.0 | G2556 | ||||||||
DF, dengue fever; DHF I and II, dengue hemorrhagic fever grades 1 and 2.
Pri, primary dengue; Sec, secondary dengue.
Clades of genotype I as designated by Raghwani et al. (24).
M, male; F, female.
Table 2.
Analysis of intrahost variation in DENV sequences in sequential samples from 17 patients in the VP data set
| Sequence ID no. | Clone merged sequences (n) | Nucleotide mutations |
Pairwise distance |
Global dN/dSa | Haplotypes (n) | Total no. of amino acid mutations | No. of stop codons | Coverage (mean) | ||
|---|---|---|---|---|---|---|---|---|---|---|
| Total no. | % | Mean | SE | |||||||
| G2500 | 118 | 1 | 117.7 | |||||||
| G2501 | 47 | 1 | 47.0 | |||||||
| G2503 | 323 | 1 | 322.7 | |||||||
| G2504 | 301 | 7 | 0.005 | 0.00010 | 0.00006 | 0.133 | 3 | 2 | 300.1 | |
| G2505 | 235 | 44 | 0.037 | 0.00080 | 0.00022 | 0.379 | 11 | 26 | 4 | 234.8 |
| G2506 | 257 | 1 | 256.5 | |||||||
| G2507 | 39 | 3 | 0.015 | 0.00031 | 0.00030 | 2 | 3 | 39.0 | ||
| G2508 | 8 | 1 | 7.9 | |||||||
| G2509 | 292 | 63 | 0.043 | 0.00073 | 0.00071 | 2 | 63 | 291.7 | ||
| G2510 | 144 | 51 | 0.071 | 0.00130 | 0.00078 | 1.947 | 10 | 45 | 143.8 | |
| G2511 | 63 | 22 | 0.069 | 0.00100 | 0.00097 | 2 | 22 | 62.9 | ||
| G2512 | 329 | 5 | 0.003 | 0.00007 | 0.00005 | 3 | 5 | 328.5 | ||
| G2513 | 362 | 1 | 361.7 | |||||||
| G2514 | 309 | 1 | 308.7 | |||||||
| G2515 | 170 | 1 | 169.8 | |||||||
| G2516 | 130 | 1 | 129.9 | |||||||
| G2517 | 155 | 1 | 154.8 | |||||||
| G2518 | 47 | 1 | 47.0 | |||||||
| G2519 | 232 | 4 | 0.003 | 0.00007 | 0.00007 | 2 | 4 | 231.7 | ||
| G2520 | 285 | 1 | 284.7 | |||||||
| G2521 | 230 | 1 | 229.1 | |||||||
| G2522 | 4 | 1 | 3.9 | |||||||
| G2523 | 17 | 1 | 17.0 | |||||||
| G2524 | 252 | 33 | 0.026 | 0.00049 | 0.00047 | 0.000 | 2 | 0 | 251.8 | |
| G2525 | 58 | 3 | 0.010 | 0.00022 | 0.00020 | 0.000 | 2 | 0 | 58.0 | |
| G2526 | 6 | 1 | 6.0 | |||||||
| G2527 | 213 | 3 | 0.003 | 0.00006 | 0.00006 | 0.000 | 2 | 0 | 212.6 | |
| G2528 | 207 | 1 | 206.5 | |||||||
| G2529 | 15 | 1 | 15.0 | |||||||
| G2536 | 330 | 4 | 0.002 | 0.00005 | 0.00005 | 0.000 | 2 | 0 | 329.6 | |
| G2537 | 252 | 1 | 251.8 | |||||||
| G2538 | 69 | 1 | 68.9 | |||||||
| G2539 | 354 | 1 | 353.8 | |||||||
| G2540 | 142 | 1 | 141.8 | |||||||
| G2541 | 27 | 1 | 27.0 | |||||||
| G2542 | 176 | 14 | 0.016 | 0.00034 | 0.00013 | 0.000 | 2 | 0 | 175.8 | |
| G2543 | 93 | 4 | 0.009 | 0.00018 | 0.00017 | 0.000 | 2 | 0 | 92.9 | |
| G2544 | 9 | 1 | 9.0 | |||||||
| G2545 | 348 | 4 | 0.002 | 0.00005 | 0.00003 | 0.273 | 2 | 2 | 347.7 | |
| G2546 | 263 | 5 | 0.004 | 0.00008 | 0.00006 | 0.000 | 3 | 0 | 262.7 | |
| G2547 | 142 | 1 | 141.8 | |||||||
| G2548 | 123 | 8 | 0.013 | 0.00028 | 0.00015 | 0.318 | 4 | 5 | 2 | 122.8 |
| G2549 | 13 | 1 | 13.0 | |||||||
| G2551 | 325 | 1 | 324.5 | |||||||
| G2552 | 320 | 4 | 0.002 | 0.00005 | 0.00005 | 0.000 | 2 | 0 | 319.8 | |
| G2553 | 112 | 1 | 111.9 | |||||||
| G2554 | 308 | 1 | 307.8 | |||||||
| G2555 | 154 | 1 | 153.9 | |||||||
| G2556 | 50 | 1 | 49.9 | |||||||
dN/dS, ratio of nonsynonymous/synonymous substitutions per site.
Table 3.
Analysis of intrahost variation in DENV sequences in sequential samples from 17 patients in the 1HQ data set
| Study ID no. | Clone merged sequences (n) | Nucleotide mutations |
Pairwise distance |
Global dN/dSa | Haplotypes (n) | Total no. of amino acid mutations | No. of stop codons | Coverage (mean) | ||
|---|---|---|---|---|---|---|---|---|---|---|
| Total no. | % | Mean | SE | |||||||
| G2500 | 116 | 23 | 0.042 | 0.00093 | 0.00020 | 0.269 | 13 | 12 | 108.4 | |
| G2501 | 47 | 8 | 0.035 | 0.00074 | 0.00026 | 0.183 | 8 | 3 | 45.5 | |
| G2503 | 317 | 92 | 0.057 | 0.00125 | 0.00012 | 0.750 | 69 | 64 | 318.5 | |
| G2504 | 285 | 80 | 0.060 | 0.00127 | 0.00019 | 0.859 | 56 | 62 | 1 | 265.8 |
| G2505 | 233 | 121 | 0.104 | 0.00225 | 0.00030 | 0.500 | 59 | 76 | 5 | 231.8 |
| G2506 | 254 | 45 | 0.038 | 0.00078 | 0.00011 | 0.473 | 40 | 28 | 233.1 | |
| G2507 | 39 | 17 | 0.088 | 0.00186 | 0.00050 | 0.718 | 13 | 12 | 38.5 | |
| G2508 | 8 | 4 | 0.111 | 0.00216 | 0.00105 | 4 | 4 | 7.1 | ||
| G2509 | 254 | 156 | 0.122 | 0.00277 | 0.00080 | 0.609 | 83 | 121 | 3 | 255.2 |
| G2510 | 141 | 97 | 0.137 | 0.00276 | 0.00083 | 0.923 | 43 | 78 | 140.5 | |
| G2511 | 63 | 47 | 0.149 | 0.00271 | 0.00102 | 1.682 | 24 | 41 | 1 | 62.9 |
| G2512 | 320 | 94 | 0.061 | 0.00127 | 0.00013 | 0.899 | 76 | 70 | 306.8 | |
| G2513 | 361 | 135 | 0.074 | 0.00163 | 0.00015 | 0.668 | 99 | 92 | 3 | 361.0 |
| G2514 | 307 | 69 | 0.047 | 0.00103 | 0.00013 | 0.506 | 55 | 45 | 1 | 293.9 |
| G2515 | 169 | 37 | 0.045 | 0.00100 | 0.00016 | 0.398 | 32 | 22 | 165.0 | |
| G2516 | 130 | 33 | 0.051 | 0.00109 | 0.00019 | 0.758 | 26 | 24 | 2 | 128.8 |
| G2517 | 155 | 71 | 0.092 | 0.00198 | 0.00023 | 0.518 | 56 | 44 | 152.7 | |
| G2518 | 47 | 12 | 0.052 | 0.00119 | 0.00033 | 0.679 | 11 | 9 | 46.2 | |
| G2519 | 230 | 116 | 0.101 | 0.00216 | 0.00020 | 0.592 | 89 | 76 | 228.0 | |
| G2520 | 284 | 90 | 0.064 | 0.00138 | 0.00016 | 0.653 | 72 | 62 | 279.5 | |
| G2521 | 212 | 82 | 0.077 | 0.00155 | 0.00018 | 0.442 | 64 | 46 | 2 | 210.5 |
| G2522 | 4 | 3 | 0.198 | 0.00324 | 0.00183 | 0.613 | 3 | 2 | 3.1 | |
| G2523 | 17 | 8 | 0.095 | 0.00203 | 0.00067 | 0.307 | 8 | 4 | 16.8 | |
| G2524 | 250 | 99 | 0.079 | 0.00162 | 0.00048 | 0.247 | 57 | 42 | 248.9 | |
| G2525 | 58 | 25 | 0.087 | 0.00185 | 0.00039 | 0.435 | 20 | 15 | 1 | 57.2 |
| G2526 | 6 | 5 | 0.166 | 0.00360 | 0.00154 | 0.461 | 5 | 3 | 6.0 | |
| G2527 | 210 | 80 | 0.077 | 0.00174 | 0.00022 | 0.344 | 54 | 45 | 1 | 206.8 |
| G2528 | 201 | 68 | 0.069 | 0.00150 | 0.00020 | 0.823 | 49 | 51 | 194.5 | |
| G2529 | 15 | 5 | 0.070 | 0.00144 | 0.00063 | 0.465 | 4 | 3 | 14.1 | |
| G2536 | 328 | 142 | 0.087 | 0.00189 | 0.00016 | 0.482 | 101 | 89 | 2 | 323.3 |
| G2537 | 251 | 93 | 0.074 | 0.00167 | 0.00019 | 0.535 | 74 | 63 | 3 | 248.6 |
| G2538 | 69 | 38 | 0.110 | 0.00238 | 0.00037 | 0.325 | 29 | 19 | 1 | 68.5 |
| G2539 | 353 | 87 | 0.050 | 0.00109 | 0.00012 | 0.667 | 70 | 61 | 348.5 | |
| G2540 | 140 | 50 | 0.071 | 0.00151 | 0.00022 | 0.697 | 40 | 34 | 139.2 | |
| G2541 | 27 | 5 | 0.037 | 0.00080 | 0.00033 | 0.460 | 6 | 3 | 26.9 | |
| G2542 | 175 | 50 | 0.058 | 0.00123 | 0.00019 | 0.234 | 31 | 22 | 172.6 | |
| G2543 | 92 | 38 | 0.083 | 0.00178 | 0.00031 | 0.426 | 29 | 22 | 91.2 | |
| G2544 | 9 | 1 | 0.022 | 0.00048 | 0.00049 | 0.000 | 2 | 0 | 9.0 | |
| G2545 | 346 | 128 | 0.073 | 0.00158 | 0.00015 | 0.556 | 94 | 82 | 4 | 347.4 |
| G2546 | 260 | 109 | 0.084 | 0.00174 | 0.00019 | 0.782 | 72 | 74 | 258.1 | |
| G2547 | 141 | 63 | 0.089 | 0.00196 | 0.00022 | 0.871 | 46 | 46 | 1 | 140.0 |
| G2548 | 122 | 67 | 0.110 | 0.00240 | 0.00030 | 0.395 | 44 | 39 | 4 | 120.8 |
| G2549 | 13 | 4 | 0.061 | 0.00133 | 0.00061 | 0.923 | 5 | 3 | 13.0 | |
| G2551 | 316 | 100 | 0.063 | 0.00131 | 0.00013 | 0.320 | 70 | 49 | 315.6 | |
| G2552 | 317 | 90 | 0.056 | 0.00123 | 0.00013 | 0.606 | 71 | 59 | 319.2 | |
| G2553 | 112 | 26 | 0.047 | 0.00100 | 0.00019 | 0.581 | 22 | 17 | 110.8 | |
| G2554 | 308 | 57 | 0.037 | 0.00081 | 0.00011 | 0.725 | 46 | 41 | 1 | 304.6 |
| G2555 | 153 | 42 | 0.055 | 0.00116 | 0.00019 | 0.530 | 34 | 26 | 152.5 | |
| G2556 | 50 | 24 | 0.098 | 0.00207 | 0.00039 | 0.745 | 21 | 17 | 48.7 | |
dN/dS, ratio of nonsynonymous/synonymous substitutions per site.
In the VP data set, which included only highly confident variant calls but which may have excluded some bona fide mutations at low frequency, we identified a total of 281 nucleotide mutations across the 8,458 clones of the 463-nt region (Table 2), corresponding to a mutational frequency of 7.2 × 10⁻⁵ (95% confidence interval [CI], 6.4 × 10⁻⁵ to 8.1 × 10⁻⁵) mutations per nucleotide site. Across all patients and time points, these mutations were observed at 43 residues (see Table S1 in the supplemental material). In all patients, the majority of sequences (65 to 100%; mean, 97%) recovered were identical to the consensus. A measure of selection pressure could be calculated in 18 samples, with mean values of pairwise distance ranging from 0.00005 to 0.00130 (mean, 0.00034) (Table 2). There was no significant difference in the mean pairwise distance between patients with DHF and DF (0.00030 versus 0.00041) (Table 2). To determine the selection pressure affecting DENV within each patient, we estimated the mean dN/dS value for each sample. Mean dN/dS values varied between 0.13 and 1.9, with an average value of 0.23. Of the 8,458 clones sequenced, 4 clones contained a total of 6 stop codons (0.05%) (Table 2). In sum, these stringently filtered data provided a conservative picture of the level of genetic diversity in these samples, but those are very likely to be real biological variants and suggest that sequence diversities in viral populations may be very low.
Intrahost phylogenetic relationships.
To infer the evolutionary history of mutations in each sample, we inferred minimum spanning networks (Fig. 1 and 2). In five patients (i.e., patients 49, 121, 154, 323, and 391), the viral population harbored only the consensus sequence. Six patients (i.e., patients 59, 82, 107, 336, 349, and 376) contained haplotypes that are multiple mutational steps (≥2) away from the consensus sequence, such that longer branches stem from the consensus sequence. In addition, two patients (82 and 162) harbored multiple phylogenetically distinct viral lineages (i.e., haplotypes) across multiple time points (Fig. 1A and B). A third patient (patient 336) also supported multiple haplotypes when the parsimony probability was reduced to 97% (Fig. 1E); in this network, hap 1 (n = 2) required seven additional mutational steps, which was suggestive of mixed infections.
Fig 1.

Minimum spanning networks of intrahost DENV-1 sequence data (VP data set). Each network was inferred by compiling sequences from multiple days. The number in the upper left corner of each panel corresponds to the patient number; percentages indicate the probability of parsimony used to construct the network. Haplotypes with the high ancestral probability are displayed as circles. Circle sizes are proportional to the number of sequences that exhibit each variant, and the pie chart in each circle indicate the percentage of each variant at different time points. Connecting lines indicate a single mutation shared among haplotypes. (A and B) Minimum spanning network in which multiple viral lineages were observed across time points (patients 82 and 162). (C) Minimum spanning network in which one mutation was shared between haplotypes (patient 309). (D) Minimum spanning network with star-like typology (patient 59). (E) Minimum spanning network with reduced parsimony probability (patient 336).
Fig 2.

Minimum spanning networks of intrahost DENV sequence data (VP data set) in which one (B, E, G, J, and K) and/or two (C, I, and J) mutations were shared between haplotypes. All sequences were identical to the consensus in panels A, D, F, H, and L. Refer to Fig. 1 for more information.
Evidence of mixed infections.
Notably, one sample (G2542, patient 336) contained two identical clones that differed by 7 nt (1.5%) from the consensus sequence and hence showed a difference far greater than that observed in the majority of other patients (mean = 0.1%). This prompted us to determine whether the high level of genetic diversity in patient 336 was due to mixed infections from different origins within the global diversity of DENV-1. Phylogenetic analyses of the alignment of all haplotypes of each patient with the “background data set” (a global samples of DENV-1 E DIII sequences from GenBank) provided strong evidence for multiple infections, all involving genotype 1 viruses (Fig. 3). Specifically, patient 336 harbored a mixed infection with viruses from clade 1 and 5 (clades are as described by Raghwani et al. [24]).
Fig 3.
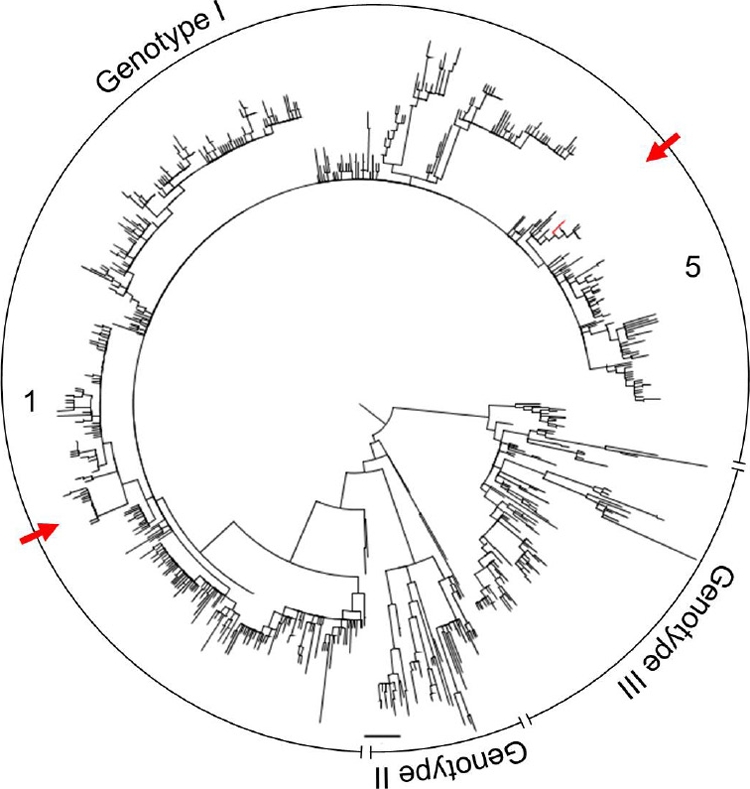
Maximum-likelihood (ML) phylogenetic tree for all (n = 89) consensus sequences derived from clones in the VP data set in relation to 1,390 equivalent background DENV-1 sequences collected from GenBank. Red lines represent clones from sample G2542, and red arrows signify mixed infection. Clades are indicated as numbers. Horizontal branches are drawn to a scale of nucleotide substitutions per site, and the tree is midpoint rooted; nodes are ordered increasingly and presented as a polar tree.
Analysis of the 1HQ data set.
As a comparison with the high-quality but conservative VP data set and to assess the likely extent of sequencing errors, we performed an additional analysis of the 1HQ data set. Among the 8,315 clones of the VP data set, 2936 nucleotide mutations were observed, corresponding to a mutation frequency of 7.6 × 10⁻⁴ (95% CI, 7.4 to 7.9 × 10⁻⁴) mutations per nucleotide site (Table 3). A total of 1,922 amino acid mutations were observed. The majority of clones (n = 1434, 17.4%) harbored a single amino acid mutation, while 2.8% carried multiple amino acid mutations. Mean estimates of pairwise genetic diversity varied from 0.00048 to 0.00360 (mean, 0.00164), and the mean dN/dS values ranged from 0 to 1.6 (mean, 0.58). These dN/dS values are much higher than those seen between patients, which are normally <0.1, suggesting that intrahost variation is characterized by transient deleterious mutations or caused by the experimental procedure, which results in an elevation of dN/dS values (14). In addition, 36 in-frame stop codons in 32 clones were identified in 17 of the 49 samples studied (Table 3). Genome-defective DENVs were observed in 0.38% of clones. All mutations in the VP data set (n = 43) were also observed in sequential samples and/or across multiple patients in the 1HQ data set (see Table S1 [left] in the supplemental material). Many mutation positions (n = 625 of 845; 74%) were observed in sequential samples and/or across multiple patients in the 1HQ data set, but these mutations lacked statistical rigor to be called a valid variant in the VP data set.
DISCUSSION
The intrahost population genetic structure of DENV has previously been described as a population of closely related sequences (1, 7, 14, 19, 33, 34). Our study, which comprises the largest series of samples and patients as well as stringent filtering of sequence quality, confirms these observations but shows that the occurrence of mutations in the virus population are much lower than previously reported. The mean pairwise genetic diversity varied between 0.00048 and 0.00360 and between 0.00005 and 0.00130 in the 1HQ and VP data sets, respectively, with no significant difference in the mean pairwise distance between patients with DHF and DF. The substantially higher sequence variation in our 1HQ data set resembled that described in previous reports (8, 19, 33, 34). However, given that the 1HQ data set undoubtedly includes a significant number of artifactual mutations, the high sequence variation in this data set should be regarded as the upper bound of DENV genetic diversity. As a consequence, it is likely that previous estimates of intrahost genetic diversity in DENV have been inflated by the erroneous inclusion of PCR and sequencing errors in the diversity calculations and hence should be treated with caution.
It is important to note that accurate estimations of intrahost sequence variability depend largely on the accuracy of the experimental procedure, particularly the fidelity of RT-PCR and sequencing. However, distinguishing bona fide from artifactual mutations is not a trivial exercise. Our rigorous approach to error correction relies on (i) the alignment of clonal sequences to a reference sequence for haplotype calling, (ii) the identification of unambiguous mutations with a high quality score of a base(s), and (iii) whether mutations were seen once (1HQ data set) or frequently enough at a given sequence coverage to be unlikely to be from error (VP data set). Indeed, the 1HQ data set must harbor a high, but undetermined, number of artifactual mutations which were likely introduced during reverse transcription, PCR amplification, or sequencing. The process error rate (i.e., RT-PCR plus cloning plus Sanger sequencing) can be expected to be on the order of 2 8 × 10⁻⁶ to 8 × 10⁻⁶/nt/cycle when a proofreading polymerase is used, as reported by Malet et al. (20), which corresponds to an expectation that ∼0.036% of the observed variants could be errors in our experimental system (0.024 to 0.269% mutations observed in the 1HQ data set). Conversely, the VP data set undoubtedly represents biological variants but may underestimate the true intrahost sequence variation, as the variant calling algorithm will call singletons as errors despite some of these mutations possibly representing true biological variants. Notably, the probability of a mutation occurring independently at random across multiple sequential samples is very low, and hence singleton variants observed in multiple samples may have a higher likelihood of being true biological variants than those observed in a single patient. Indeed, although RT, PCR, and sequencing errors likely contribute to the majority of variants observed in the 1HQ data set, we were able to identify mutations that occurred in multiple patients and at multiple time points (see Table S1 in the supplemental material), suggesting that they are biological variants even though they are at low frequency within individual patients and hence are excluded from the VP data set.
Overall, our VP data set indicates that the DIII segment of the E gene in DENV-1 exhibits limited sequence variation during the course of infection. In addition, it is striking that in both the VP and HQ1 data sets, we found no clear evidence for adaptive evolution in the DIII region, in the form of consistently high dN/dS ratios and/or mutations that exhibited a steady increase in frequency, even though it is thought to be the principle target for neutralizing antibodies (3, 21). The lack of positive selection in this case is likely to be a function of the fact that dengue is a self-limiting infection in which innate, humoral, and cellular immune mechanisms remove the virus population before evidence of positive selection can be detected (4, 13, 22, 31).
The relationship between viral genetic variation and disease severity has been well documented for human immunodeficiency virus type 1 (HIV-1) and hepatitis C virus (HCV) (12, 35). For example, higher HIV-1 sequence diversity has been shown to be associated with slower disease progression (35). Similarly, disease progression in HCV infection was associated with measurable genetic evolution, while resolving hepatitis correlated with evolutionary stasis in the acute phase of HCV infection (12). Because our analysis considered a relatively large number of sequences per patient and these patients likely harbored differences in immunological responses, we were able to look for associations between the intrahost diversity of DENV-1 and disease outcome, immune status, or viremia. Notably, we observed no clear evolutionary patterns in relation to any of these variables. These results are in contrast to results reported by Descloux et al. (8), who showed higher intrahost sequence variation in patients with DHF/DSS than in those with DF. The basis for the differences in results between our studies is unknown but could be related to the methods used to filter sequence quality or to sample size. In addition, Descloux et al. assessed a much smaller number of clones (662 clones from 16 serum samples at a single time point), increasing the chance of stochastic effects.
Finally, one of the most striking observations from this study was the presence within some patients of phylogenetically distinct lineages or subtypes of genotype 1 DENV-1, indicative of mixed infection. That these mixed-infection events were also observed within the high-quality VP data sets indicates that they are bona fide. This is the first time that intraserotype mixed infection has been reported for DENV-1, and we likely greatly underestimate its true frequency as we are able to infer the occurrence of mixed infection only when it involves lineages that fall into topologically distinct places on phylogenetic trees (i.e., we cannot identify mixed infection among very closely related viral lineages). Intriguingly, a previous study of DENV-2 evolution also revealed the presence of mixed infection, such that individual patients harbored multiple phylogenetically distinct lineages (1). We therefore conclude that mixed infection is a potentially important contributor to intrahost virus genetic and phenotypic diversity and provides the raw material for intraserotype recombination (16, 37). However, we were unable to determine whether these mixed infections represent the simultaneous infection (i.e., coinfection) or superinfection of multiple viral lineages in humans. This is clearly an area that requires additional study.
Supplementary Material
ACKNOWLEDGMENTS
This study was funded by the Wellcome Trust (C.P.S.) and in part with U.S. Federal funds from the National Institute of Allergy and Infectious Diseases, National Institutes of Health, Department of Health and Human Services, under contract no. HHSN272200900006C (B.W.B.) and HHSN272200900018C (B.W.B.). Khoa T. D. Thai is supported by a “Mosaic” fellowship from the Netherlands Organization for Scientific Research (NWO) (grant 017.004.074).
Footnotes
Supplemental material for this article may be found at http://jvi.asm.org/.
The authors have paid a fee to allow immediate free access to this article.
REFERENCES
- 1. Aaskov J, Buzacott K, Thu HM, Lowry K, Holmes EC. 2006. Long-term transmission of defective RNA viruses in humans and Aedes mosquitoes. Science 311:236–238 [DOI] [PubMed] [Google Scholar]
- 2. Altshuler D, et al. 2000. An SNP map of the human genome generated by reduced representation shotgun sequencing. Nature 407:513–516 [DOI] [PubMed] [Google Scholar]
- 3. Beltramello M, et al. 2010. The human immune response to dengue virus is dominated by highly cross-reactive antibodies endowed with neutralizing and enhancing activity. Cell Host Microbe 8:271–283 [DOI] [PMC free article] [PubMed] [Google Scholar]
- 4. Chau TN, et al. 2010. Clinical and virological features of Dengue in Vietnamese infants. PLoS Negl. Trop. Dis. 4:e657. [DOI] [PMC free article] [PubMed] [Google Scholar]
- 5. Clement M, Posada D, Crandall KA. 2000. TCS: a computer program to estimate gene genealogies. Mol. Ecol. 9:1657–1659 [DOI] [PubMed] [Google Scholar]
- 6. Clyde K, Kyle JL, Harris E. 2006. Recent advances in deciphering viral and host determinants of dengue virus replication and pathogenesis. J. Virol. 80:11418–11431 [DOI] [PMC free article] [PubMed] [Google Scholar]
- 7. Craig S, et al. 2003. Diverse dengue type 2 virus populations contain recombinant and both parental viruses in a single mosquito host. J. Virol. 77:4463–4467 [DOI] [PMC free article] [PubMed] [Google Scholar]
- 8. Descloux E, Cao-Lormeau VM, Roche C, De LX. 2009. Dengue 1 diversity and microevolution, French Polynesia 2001-2006: connection with epidemiology and clinics. PLoS Negl. Trop. Dis. 3:e493. [DOI] [PMC free article] [PubMed] [Google Scholar]
- 9. Diaz FJ, et al. 2006. Dengue virus circulation and evolution in Mexico: a phylogenetic perspective. Arch. Med. Res. 37:760–773 [DOI] [PubMed] [Google Scholar]
- 10. Domingo E, Holland JJ. 1997. RNA virus mutations and fitness for survival. Annu. Rev. Microbiol. 51:151–178 [DOI] [PubMed] [Google Scholar]
- 11. Edgar RC. 2004. MUSCLE: multiple sequence alignment with high accuracy and high throughput. Nucleic Acids Res. 32:1792–1797 [DOI] [PMC free article] [PubMed] [Google Scholar]
- 12. Farci P, et al. 2000. The outcome of acute hepatitis C predicted by the evolution of the viral quasispecies. Science 288:339–344 [DOI] [PubMed] [Google Scholar]
- 13. Gubler DJ. 1998. Dengue and dengue hemorrhagic fever. Clin. Microbiol. Rev. 11:480–496 [DOI] [PMC free article] [PubMed] [Google Scholar]
- 13a. Henn MR, et al. Whole genome deep sequencing of HIV-1 reveals the impact of early minor variants upon immune recognition during acute infection. PLoS Pathogens, in press [DOI] [PMC free article] [PubMed] [Google Scholar]
- 14. Holmes EC. 2003. Patterns of intra- and interhost nonsynonymous variation reveal strong purifying selection in dengue virus. J. Virol. 77:11296–11298 [DOI] [PMC free article] [PubMed] [Google Scholar]
- 15. Holmes EC, Twiddy SS. 2003. The origin, emergence and evolutionary genetics of dengue virus. Infect. Genet. Evol. 3:19–28 [DOI] [PubMed] [Google Scholar]
- 16. Holmes EC, Worobey M, Rambaut A. 1999. Phylogenetic evidence for recombination in dengue virus. Mol. Biol. Evol. 16:405–409 [DOI] [PubMed] [Google Scholar]
- 17. Kent WJ. 2002. BLAT—the BLAST-like alignment tool. Genome Res. 12:656–664 [DOI] [PMC free article] [PubMed] [Google Scholar]
- 18. Laue T, Emmerich P, Schmitz H. 1999. Detection of dengue virus RNA in patients after primary or secondary dengue infection by using the TaqMan automated amplification system. J. Clin. Microbiol. 37:2543–2547 [DOI] [PMC free article] [PubMed] [Google Scholar]
- 19. Lin SR, et al. 2004. Study of sequence variation of dengue type 3 virus in naturally infected mosquitoes and human hosts: implications for transmission and evolution. J. Virol. 78:12717–12721 [DOI] [PMC free article] [PubMed] [Google Scholar]
- 20. Malet I, Belnard M, Agut H, Cahour A. 2003. From RNA to quasispecies: a DNA polymerase with proofreading activity is highly recommended for accurate assessment of viral diversity. J. Virol. Methods 109:161–170 [DOI] [PubMed] [Google Scholar]
- 21. Midgley CM, et al. 2011. An in-depth analysis of original antigenic sin in dengue virus infection. J. Virol. 85:410–421 [DOI] [PMC free article] [PubMed] [Google Scholar]
- 22. Murgue B, Roche C, Chungue E, Deparis X. 2000. Prospective study of the duration and magnitude of viraemia in children hospitalised during the 1996-1997 dengue-2 outbreak in French Polynesia. J. Med. Virol. 60:432–438 [DOI] [PubMed] [Google Scholar]
- 23. Posada D, Crandall KA. 1998. MODELTEST: testing the model of DNA substitution. Bioinformatics 14:817–818 [DOI] [PubMed] [Google Scholar]
- 24. Raghwani J, et al. 2011. Endemic dengue associated with the co-circulation of multiple viral lineages and localized density-dependent transmission. PLoS Pathog. 7:e1002064. [DOI] [PMC free article] [PubMed] [Google Scholar]
- 25. Rico-Hesse R. 1990. Molecular evolution and distribution of dengue viruses type 1 and 2 in nature. Virology 174:479–493 [DOI] [PubMed] [Google Scholar]
- 26. Stamatakis A. 2006. RAxML-VI-HPC: maximum likelihood-based phylogenetic analyses with thousands of taxa and mixed models. Bioinformatics 22:2688–2690 [DOI] [PubMed] [Google Scholar]
- 27. Tamura K, et al. 2011. MEGA5: molecular evolutionary genetics analysis using maximum likelihood, evolutionary distance, and maximum parsimony methods. Mol. Biol. Evol. 28:2731–2739 [DOI] [PMC free article] [PubMed] [Google Scholar]
- 28. Templeton AR, Crandall KA, Sing CF. 1992. A cladistic analysis of phenotypic associations with haplotypes inferred from restriction endonuclease mapping and DNA sequence data. III. Cladogram estimation. Genetics 132:619–633 [DOI] [PMC free article] [PubMed] [Google Scholar]
- 29. Tricou V, et al. 2010. A randomized controlled trial of chloroquine for the treatment of dengue in Vietnamese adults. PLoS Negl. Trop. Dis. 4:e785. [DOI] [PMC free article] [PubMed] [Google Scholar]
- 30. Vasilakis N, Weaver SC. 2008. The history and evolution of human dengue emergence. Adv. Virus Res. 72:1–76 [DOI] [PubMed] [Google Scholar]
- 31. Vaughn DW, et al. 2000. Dengue viremia titer, antibody response pattern, and virus serotype correlate with disease severity. J. Infect. Dis. 181:2–9 [DOI] [PubMed] [Google Scholar]
- 32. Vu TT, et al. 2010. Emergence of the Asian 1 genotype of dengue virus serotype 2 in Viet Nam: in vivo fitness advantage and lineage replacement in South-East Asia. PLoS Negl. Trop. Dis. 4:e757. [DOI] [PMC free article] [PubMed] [Google Scholar]
- 33. Wang WK, Lin SR, Lee CM, King CC, Chang SC. 2002. Dengue type 3 virus in plasma is a population of closely related genomes: quasispecies. J. Virol. 76:4662–4665 [DOI] [PMC free article] [PubMed] [Google Scholar]
- 34. Wang WK, Sung TL, Lee CN, Lin TY, King CC. 2002. Sequence diversity of the capsid gene and the nonstructural gene NS2B of dengue-3 virus in vivo. Virology 303:181–191 [DOI] [PubMed] [Google Scholar]
- 35. Wolinsky SM, et al. 1996. Adaptive evolution of human immunodeficiency virus-type 1 during the natural course of infection. Science 272:537–542 [DOI] [PubMed] [Google Scholar]
- 36. World Health Organization 1997. Dengue haemorrhagic fever. Diagnosis, treatment and control. World Health Organization, Geneva, Switzerland [Google Scholar]
- 37. Worobey M, Rambaut A, Holmes EC. 1999. Widespread intra-serotype recombination in natural populations of dengue virus. Proc. Natl. Acad. Sci. U. S. A. 96:7352–7357 [DOI] [PMC free article] [PubMed] [Google Scholar]
- 38. Zhang C, et al. 2005. Clade replacements in dengue virus serotypes 1 and 3 are associated with changing serotype prevalence. J. Virol. 79:15123–15130 [DOI] [PMC free article] [PubMed] [Google Scholar]
Associated Data
This section collects any data citations, data availability statements, or supplementary materials included in this article.